Abstract
Using novel murine models of claudin-low and basal-like breast cancer, we tested the hypothesis that diet-induced obesity (DIO) and calorie restriction (CR) differentially modulate progression of these aggressive breast cancer subtypes. For model development, we characterized two cell lines, “mesenchymal (M)-Wnt” and “epithelial (E)-Wnt,” derived from MMTV-Wnt-1 transgenic mouse mammary tumors. M-Wnt, relative to E-Wnt, cells were tumor-initiating cell (TIC)-enriched (62% vs 2.4% CD44high/CD24low), and displayed enhanced aldefluor-positivity, epithelial-to-mesenchymal transition (EMT) marker expression, mammosphere-forming ability, migration, invasion, and tumorigenicity (p<0.001, each parameter). M-Wnt and E-Wnt cells clustered with claudin-low and basal-like breast tumors, respectively, in gene expression profiles, and recapitulated these tumors when orthotopically transplanted into ovariectomized C57BL/6 mice. To assess the effects of energy balance interventions on tumor progression and EMT, mice were administered DIO, control or CR diets for 8 weeks before orthotopic transplantation of M-Wnt or E-Wnt cells (for each cell line, n=20 mice/diet), and continued on their diets for 6 weeks while tumor growth was monitored. Relative to control, DIO enhanced M-Wnt (p=0.01), but not E-Wnt, tumor progression; upregulated EMT- and TIC-associated markers including N-cadherin, fibronectin, TGFβ, SNAIL, FOXC2, and Oct4 (p<0.05, each); and increased intratumoral adipocytes. Conversely, CR suppressed M-Wnt and E-Wnt tumor progression (p<0.02, each) and inhibited EMT and intratumoral adipocyte accumulation. Thus dietary energy balance interventions differentially modulate EMT and progression of claudin-low and basal-like tumors. EMT pathway components may represent targets for breaking the obesity-breast cancer link, particularly for preventing and/or controlling TIC-enriched subtypes such as claudin-low breast cancer.
Keywords: basal-like breast cancer, claudin-low breast cancer, diet, epithelial-to-mesenchymal transition, mice
Introduction
Obesity increases risk and progression of breast cancer in postmenopausal women (1); whereas, intentional weight loss or calorie restriction (CR) moderately protects against breast cancer (2,3). Breast cancers are multiple distinct diseases, with intrinsic molecular subtypes categorized as basal-like, luminal A, luminal B, triple-negative, claudin-low or Her-2-positive breast cancer (4,5). Epidemiological data suggest that the strength of the obesity-breast cancer link varies by intrinsic breast cancer subtype and differentiation status (6). While obesity is a well-established risk and prognostic factor for the luminal A breast cancer subtype in postmenopausal women (6,7), the relationships between dietary energy balance and claudin-low or basal-like breast cancers are not well established, due partially to a paucity of relevant experimental model systems.
Features of claudin-low, and to a lesser extent basal-like, breast tumors include Wnt/β-catenin pathway activation, stem cell-like gene expression and poor morphologic differentiation (4,8). The Wnt/β-catenin pathway is associated with the epithelial-to-mesenchymal transition (EMT), which is a key developmental program and regulator of tumor-initiating cells (TICs) possessing stem/progenitor cell properties (8). Links between dietary energy balance and EMT in breast cancer are plausible but remain unclear. TGFβ, a master regulator of EMT, is overexpressed in multiple tissues from obese humans and rodents (9,10). SNAIL and TWIST, transcription factors that regulate E-cadherin and trigger EMT, are upregulated in melanoma cells treated in vitro with serum from obese mice (11). EMT-driven TIC enrichment correlates with hallmarks of cancer progression, including proliferation, angiogenesis, invasion, metastasis, wound healing, and therapeutic resistance (12). Given the poor prognosis conferred by claudin low and basal-like breast cancers (6), identification of mechanistic targets and strategies to prevent or control these breast cancer subtypes is critical.
Here we describe two cell lines that recapitulate claudin-low and basal-like breast tumors, respectively, when orthotopically transplanted into ovariectomized C57BL/6 mice. Ovariectomy was used to mimic the postmenopausal state, which is associated with increased susceptibility to weight gain and breast cancer in women. Both cell lines were derived from spontaneous mammary tumors from mouse mammary tumor virus (MMTV)-Wnt-1 transgenic mice. Using these cells in vitro and in vivo, we tested the hypothesis that alterations in dietary energy balance, specifically diet-induced obesity (DIO) and CR, modulate claudin-low and basal-like mammary tumor progression, possibly through EMT-related pathways.
Materials and Methods
All animal studies and procedures were approved and monitored by the University of Texas Institutional Animal Care and Use Committee.
Generation and authentication of M-Wnt and E-Wnt tumor cell lines
Twenty clonal cell lines were derived from spontaneous mammary tumors from MMTV-Wnt-1 transgenic mice, as previously described (13). In brief, excised tumors were dissected, mechanically dissociated, and forced through 40 μm mesh. Viable cells were plated at low density in 100 mm plates, grown at 37°C in 5% CO2 in RPMI-1640 media, 10% FBS, penicillin/streptomycin and glutamine (complete media; all components from HyClone, Waltham, MA). One clone (denoted “M-Wnt”) had mesenchymal morphology by microscopic evaluation and was selected for further characterization. Of the remaining 19 clones, all had virtually identical epithelial morphology, and a randomly selected subset (4 clones) had similar cell-surface marker expression (see below). From that subset, one clone (denoted “E-Wnt”) was randomly selected for further characterization.
The M-Wnt and E-Wnt cell lines were tested for species verification, karyotyping, and genomic instability and were authenticated by the Molecular Cytogenetics Core facility at the University of Texas-MD Anderson Cancer Center, Houston, TX. Before in vivo use, M-Wnt and E-Wnt cells were trypsinized, washed with PBS, and viable cells were quantified by trypan blue exclusion using a hemacytometer (Fisher Scientific, Waltham, MA).
In vitro characterization of M-Wnt and E-Wnt cell lines
Flow cytometric analysis of CD44 and CD24 cell-surface markers
Cells were grown to 70% confluence in complete media, scraped or trypsinized, and stained with allophycocyanin anti-mouse CD44 and/or phycoerythrin anti-mouse CD24 (BD Biosciences, San Jose, CA) (14,15). Rat IgG (BD Biosciences) was used as isotype control (14). Cell staining was evaluated (4 biological replicates performed on different days) using flow cytometry (FACSCalibur, BD Biosciences), with data from ≥1×10⁴ cells acquired and analyzed (Cell Quest Pro software, BD Biosciences) (14).
Flow cytometric analysis of aldehyde dehydrogenase (ALDH) activity
The ALDEFLUOR kit (StemCell Technologies, Durham, NC) was used per manufacturer’s instructions to identify and enumerate by flow cytometry (Accuri C6 Flow Cytometer, Accuri, Ann Arbor, MI) the population of cells with high ALDH enzymatic activity (16). In brief, cells were incubated with an ALDH fluorescent substrate either with the ALDH inhibitor, diethylaminobenzaldehyde (DEAB; to establish baseline fluorescence), or without DEAB (to define the ALDEFLUOR-positive region) before sorting. Gates were set to include viable, 7-aminoactinomycin D-negative cells (7 biological replicates performed on different days).
Mammosphere-forming capacity
Cells were trypsinized, washed in PBS, and plated in a serial dilution (from 60 to 1 cells/well) in a 96-well plate (6 replicates/dilution). Cells were cultured under serum-free conditions (Dulbecco’s Modified Eagle’s Medium: Nutrient Mixture F12 supplemented with insulin, B27, N-2, epidermal growth factor and fibroblast growth factor; BD Biosciences) in low-adherence plates (Corning, Corning, NY) and fed weekly. At 14 days, mammospheres with >5 cells/sphere were counted (20X magnification), photomicrographs of representative mammospheres taken (n=5/cell line), and diameters measured using SPOT camera software (Sterling Heights, MI).
Scratch assay of cell migration
Cells were grown to confluency at 37°C in 5% CO2 in complete media, wounded using a 10 μL pipette tip, and allowed to migrate. Photomicrographs of the wound were taken immediately and 12 hours later (3 separate experiments, each in triplicate).
Invasion assay
Cells were plated (2.5×10⁴ cells/chamber) in serum-free RPMI-1640 media in Matrigel-coated invasion chambers (BD Biosciences) and allowed to invade (10% FBS as chemoattractant) for 8, 18, or 30 hours. Noninvasive cells were wiped from the upper portion of the membrane. Invasive cells (lower side of the membrane) were stained with 1% crystal violet in methanol for 30 minutes, washed twice in water, mounted on slides, and counted at 20X magnification (3 separate experiments, each in triplicate).
Relative tumorigenicity of M-Wnt and E-Wnt cells
Animals and study design
Upon arrival after purchase (Charles River, Frederick, MD), 110 ovariectomized, 6- to 8-week-old female C57BL/6 mice were singly housed and fed modified AIN-76A diet (catalog #D12450B, Research Diets, Inc., New Brunswick, NJ) ad libitum. Following a 4-week adaptation period, mice were orthotopically transplanted in the ninth mammary fat pad (17), with either M-Wnt cells (1×10⁷, 1×10⁶, 5×10⁵, 2×10⁵, 5×10⁴, 5×10³, 500 or 50 cells/mouse) or E-Wnt cells (5×10⁷, .1×107, 5×10⁶, 5×10⁵, 5×10⁴, 5×10³, 500 or 50 cells/mouse). For each cell line, n=10 mice/group for the first three groups listed; otherwise, n=5 mice/group.
Once detected, tumors were measured twice weekly in two perpendicular dimensions using electronic calipers; cross-sectional area was calculated (maximal length x width, mm2). When tumor diameter reached 1.0 cm in either dimension (or at 16 weeks, whichever occurred first), mice were euthanized by cervical dislocation following isoflurane anesthesia; also for each group with 10 mice/group, 5 mice were randomly selected at 3 weeks and euthanized. Tumors were excised, measured, and weighed.
Tumor processing and storage
Tumors were equally divided into 3 portions that were either: 1) fixed in 10% neutral buffered formalin for 24 hours, transferred to 70% ethanol for 24 hours, embedded in paraffin, and cut into 4 μm thick sections for hematoxylin and eosin (H&E) staining or immunohistochemical analysis; 2) placed in a cryotube, flash frozen in liquid nitrogen and stored at −80°C for subsequent molecular analyses; or 3) flash frozen in Optimal Cutting Temperature medium (Tissue-Tek, Torrance, CA) and stored at −80°C for subsequent immunofluorescence analysis.
Molecular characterization of M-Wnt and E-Wnt cell lines or tumors
Microarray gene expression analysis
RNA was purified from M-Wnt and E-Wnt cells using RNeasy mini Kit (Qiagen). Microarray hybridizations were performed as previously described (5) except that the new arrays reported here were hybridized to custom 180K Agilent microarrays (BARCODE25503) and scanned using an Agilent Technologies Scanner G2505C with Feature Extraction software (Santa Clara, CA). Microarray hybridization data from Herschkowitz et al. (5) (GSE3165) were clustered along with data from the new arrays reported here (GSM652368-GSM652393). The intrinsic gene list used to cluster the arrays was pared from 866 genes to the 666 genes common across both array platforms. A cross-platform normalization factor was computed based on mouse models common to both platforms, including MMTV-Neu and C3(1)/SV40 large T-antigen (C3-Tag) transgenic mice. Arrays were then mean-adjusted and median-centered.
Real-time quantitative reverse transcription (qRT)-PCR of EMT panel
Total RNA was extracted from cell lines using RNeasy Mini kit (Qiagen) and from tumor samples using FastRNA Pro Green Kit (MP Biomedicals, Solon, OH). RNA was reverse transcribed with Multiscribe RT (Applied Biosystems, Carlsbad, CA). The resulting cDNAs were assayed in triplicate for PCR using Taqman® Gene Expression Assays for an EMT panel that includes E-cadherin, N-cadherin, fibronectin, vimentin, Snail, Twist, Slug, forkhead box C2 (FOXC2), TGFβ, Oct4, and Wnt-1 (Applied Biosystems). PCR and data collection were performed on a Mastercycler RealPlex 4 (Eppendorf, Hauppauge, NY). Gene expression data were normalized to β-actin.
Immunostaining
Immunohistochemistry
Immunohistochemical staining was performed as previously described (18) using primary antibodies for Ki67 (dilution=1:200; Catalog #M7249, DAKO Cytomation, Carpinteria, CA), CD31 (1:400; Clone MEC 13.3, BD Biosciences), phospho-histone H3 (pHH3, Ser10) (1:1000; Catalog #06-570, Upstate Biotechnology, Lake Placid, NY), estrogen receptor (ER)-α (1:500; Catalog #sc542, Santa Cruz Biotechnology, Santa Cruz, CA), and progesterone receptor (PR) (1:100; Catalog #ab2764, Abcam, Cambridge, MA). Secondary antibody was horseradish peroxidase-labeled anti-rabbit antibody (DAKO Cytomation).
Immunofluorescence
Frozen tumor sections embedded in Optimal Cutting Temperature media were cut (4 μm slices), washed with PBS, fixed in 4% paraformaldehyde, permeabilized (2 minutes) in 0.1% Triton X-100, and neutralized (5 minutes) in 100 mM glycine. Immunofluorescence staining was performed as previously described (19). Primary antibodies (1:300 dilution; BD Biosciences) included anti-E-cadherin (Catalog #610181), anti-N-cadherin (Catalog #610920), and anti-fibronectin (Catalog #610077). Secondary antibody was FITC-conjugated, donkey anti-mouse IgG (1:600; Catalog #715095150, Jackson ImmunoResearch Laboratories, West Grove, PA). Slides were counterstained with 4′,6-diamidino-2-phenylindole (DAPI; Invitrogen, Carlsbad, CA). Photomicrographs were taken with equal exposure on a Zeiss Axiovert 200M microscope (oil immersion objective; 60X or 100X magnification) with appropriate filters (Zeiss, Thornwood, NY).
Effects of energy balance in models of claudin-low and basal-like breast cancer
Upon arrival, 120 ovariectomized, 6- to-8-week-old female C57BL/6 mice (Charles River) were singly housed and randomized (n=40/diet group) to receive one of three dietary regimens for 14 weeks (pelleted diets from Research Diets, Inc.; Table S1): 1) control diet, fed ad libitum (modified AIN-76A diet; catalog #D12450B), providing 3.8 kcal/g; 2) 30% CR diet (catalog #D0302702); 3) DIO diet, fed ad libitum (catalog #D12492), providing 5.2 kcal/g with 60% kcal from fat. CR mice received a modified formulation of control diet providing 70% of the mean daily caloric consumption (and 100% of vitamins, minerals, fatty acids and amino acids) of control mice (Table S1). Mice were weighed weekly.
After 8 weeks on diet, mice were analyzed for percent body fat using quantitative magnetic resonance (Echo Medical Systems, Houston, TX). Mice were orthotopically injected in the ninth mammary fat pad with 5×10⁴ M-Wnt cells/mouse or 5×10⁶ E-Wnt cells/mouse (n=20 mice/diet for each cell line). The cell numbers used were based on their ability to generate comparably sized tumors in preliminary studies. Cross-sectional tumoral area was determined twice weekly (as described above).
Six weeks later, mice were fasted for 6 hours and then euthanized. Blood was collected by cardiac puncture, coagulated for 30 minutes (room temperature), and centrifuged at 10,000xg for 5 minutes; serum was removed and stored at −80°C for subsequent analyses. Tumors were excised, measured, and processed and stored (as above) for immunohistochemical and immunofluorescence analyses. Serum from 12-13 randomly selected mice/group was analyzed for glucose (by Ascencia Elite Glucometer, Bayer, Minnneapolis, MN); leptin, insulin, resistin, insulin-like growth factor (IGF)-1, interleukin (IL)-6, and adiponectin (by Luminex-based LINCOplex bead array assay, Millipore, Billerica, MA; read on multianalyte detection system, BioRad, Hercules, CA); and 17-β estradiol (by ELISA; Alphay Diagnostics, San Antonio, TX).
Statistical Analyses
Summarized data are reported as mean±SEM. Differences were assessed using the unpaired student’s t-test (mammosphere size, cellular populations by flow cytometry, relative gene expression), one-way ANOVA followed by Tukey’s post-hoc test (mammosphere counts, invasion capacity, body weight, percent body fat, serum analytes), one-way repeated measures ANOVA followed by Tukey’s post-hoc test (serial cross-sectional tumor areas), or the Mann-Whitney U test (final tumor area). Significance was declared at p<0.05.
Results
Development of M-Wnt and E-Wnt mammary tumor models
In vitro characterization of M-Wnt and E-Wnt cell lines
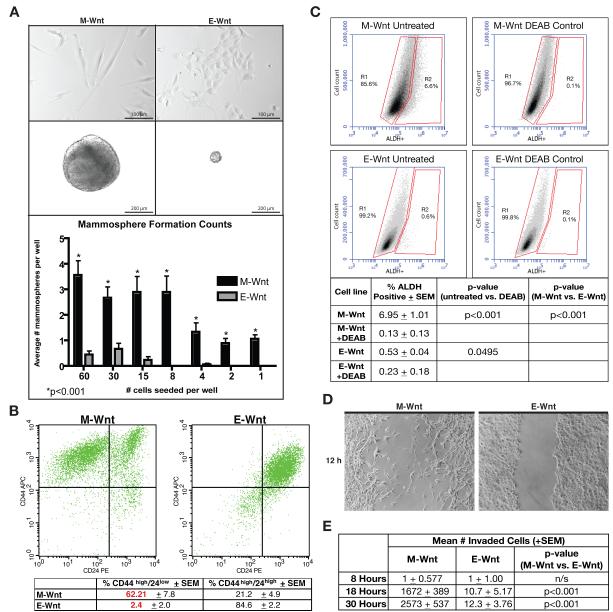
The M-Wnt and E-Wnt cell lines, each isolated from a MMTV-Wnt-1 mammary tumor, were characterized for morphology, mammosphere-forming capacity, cell surface expression of CD44 and CD24, ALDH activity, and migration and invasion capability (Figure 1).
Figure 1. In vitro characterization of M-Wnt and E-Wnt cell lines.
(A) Representative photomicrographs of M-Wnt and E-Wnt cells grown in adherent culture (upper panels, scale bar=100 μm) or suspension culture conditions (middle panels, scale bar=200 μm). Lower panel: mean (±SEM) number/well of mammospheres in relation to number of seeded cells. (B) Representative flow cytometric analysis for CD44 and CD24 of M-Wnt cells (left) and E-Wnt cells (right). Table summary: mean±SEM; n=4 biological replicates). (C) Representative FACS analysis of ALDH activity. Table summary: mean±SEM; n=7 biological replicates. (D) Representative photomicrograph (3 biological replicates) of scratch assays at 12 h timepoint. (E) The number of invading M-Wnt and E-Wnt cells across a 30-h period as assessed using invasion assays (3 separate experiments, each in triplicate).
When grown in adherent culture in complete media, M-Wnt cells displayed a mesenchymal appearance, including elongated spindle-like cytoplasm, consistent with human claudin-low breast tumor cells. In contrast, E-Wnt cells had a rounded appearance typical of epithelium and more consistent with most murine and human basal-like breast cancer cell lines (Figure 1A, upper panels).
Mammosphere-forming capacity, which typically identifies a more tumorigenic cell population that has undergone EMT (20), was more pronounced with M-Wnt than EWnt cells. When grown under nonadherent conditions for 14 days, M-Wnt cells, compared with E-Wnt cells, formed significantly larger mammospheres (mean±SEM diameter: 378+14.0 μm vs 75.5+10.4 μm, p<0.001; Figure 1A, middle panels). When plated in a limiting dilution (from 60 cells/well to 1 cell/well), M-Wnt cells, compared with E-Wnt cells, consistently formed significantly more mammospheres (p<0.001 for all dilutions; Figure 1A, lower panel).
By flow cytometric analysis of unsorted cells, the M-Wnt cell line (relative to the E-Wnt cell line) was enriched (62.2±7.8% vs 2.4±2.0%, p<0.001; Figure 1B) in CD44high/CD24low cells, associated with murine mammary TICs (15). .
Cells with increased ALDH activity exhibit stem cell properties (16). High ALDH activity, as assessed by flow cytometry using the ALDEFLUOR assay, occurred in a greater population of M-Wnt cells than E-Wnt cells (6.95±1.01% vs 0.53±0.04%, p<0.001; Figure 1C). Consistently for each cell line, DEAB inhibition of ALDH significantly decreased ALDEFLUOR-positivity (to 0.13+0.13% for M-Wnt, p<0.001; and to 0.23+0.18% for E-Wnt, p<0.05), and cell viability in assays (n=7) was high (98.7±0.13% for M-Wnt and 98.7±0.09% for E-Wnt).
EMT is functionally characterized by a loss of cell-cell adhesion and an increase in migration and invasion (21). M-Wnt, but not E-Wnt, cells showed migratory capacity in a scratch assay for cell migration (Figure 1D). In an invasion chamber assay, M-Wnt cells were significantly more (up to 226-fold) invasive than E-Wnt cells (p<0.001 for assessments at both 18 hours and 30 hours; Figure 1E).
Tumorigenicity of M-Wnt and E-Wnt cells and biologic features of resultant tumors
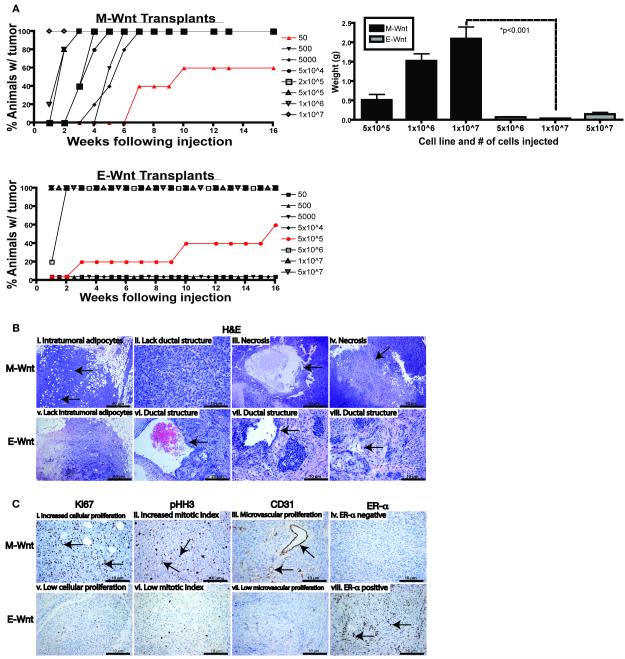
To compare the tumorigenicity of (unsorted) M-Wnt and E-Wnt cell lines, cells were orthotopically transplanted into the mammary fat pads of female C57BL/6 mice in a limiting dilution analysis (1×10⁷ to 50 cells for M-Wnt, and 5×10⁷ to 50 cells for E-Wnt, per animal). Tumors were generated with as few as 50 M-Wnt cells, while at least 5×10⁵ E-Wnt cells were required for tumor formation (p<0.001; Figure 2A, left panel). By 3 weeks after transplantation of 5×10⁵ or more cells, M-Wnt tumors were greater in weight (Figure 2A, right panel) and size (data not shown) than E-Wnt tumors, and tumors generated from the same number (1×10⁷) of cells weighed 2.09±0.30 g for M-Wnt and 0.03±0.01 g for E-Wnt (p<0.001). Gross necropsy examination found no evidence of metastatic disease in liver or lungs.
Figure 2. Characterization of tumorigenicity and biological features of orthotopically transplanted M-Wnt and E-Wnt tumors cells.
(A) Relative tumorigenicity of M-Wnt (left upper panel) and E-Wnt (left lower panel) cells transplanted in limiting dilution analysis into syngeneic mammary fat pads (cell numbers indicated; n=5-10 mice/group). Tumor weights (mean ± SEM) at 3 weeks post-transplantation in subgroups (n=5 mice/subgroup) injected with 5×10⁵, 1×10⁶, or 1×10⁷ M-Wnt cells, or 5×10⁶, 1×10⁷, or 5×10⁷ E-Wnt cells (right panel). (B) Representative micrographs of H&E staining of M-Wnt (i-iv) and E-Wnt (v-vii) tumors showing intratumoral adipocyte accumulation and morphology. Arrows indicate regions corresponding to the annotation above each image; scale bar=10-40 μm, as indicated. (C) Representative micrographs of immunohistochemical staining of M-Wnt and E-Wnt tumors for Ki67 (i, v), pHH3 (ii, vi), CD31 (iii, vii), and ERα expression (iv, viii). Arrows indicate regions corresponding to the annotation above each image; scale bar=10 μm.
The M-Wnt tumors were poorly differentiated with metaplastic morphology, lacked ductal structures, and had intratumoral adipocytes and large areas of central necrosis; by comparison, E-Wnt tumors, had clearly defined, albeit disorganized, ductal structures and basal-like morphology reminiscent of the spontaneous MMTV-Wnt-1 tumors from which the cell lines were derived (22), and lacked intratumoral adipocytes (Figure 2B). The M-Wnt tumors, relative to E-Wnt tumors, had increased cellular proliferation (Ki67 staining), mitotic index (pHH3 staining), and microvascular proliferation (CD31 staining) (Figure 2C). E-Wnt, but not M-Wnt, tumors expressed ERα (Figure 2C); neither expressed PR (data not shown).
Molecular characterization of M-Wnt and E-Wnt cells and tumors
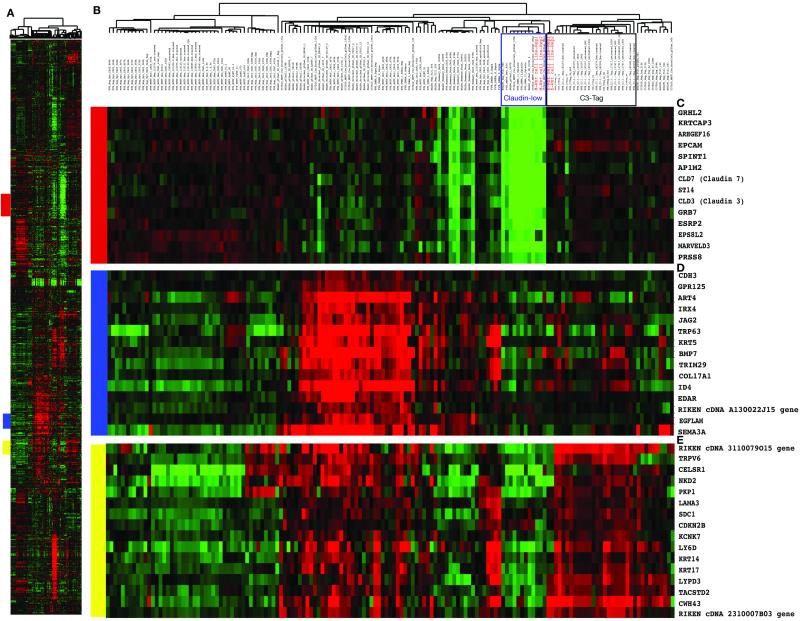
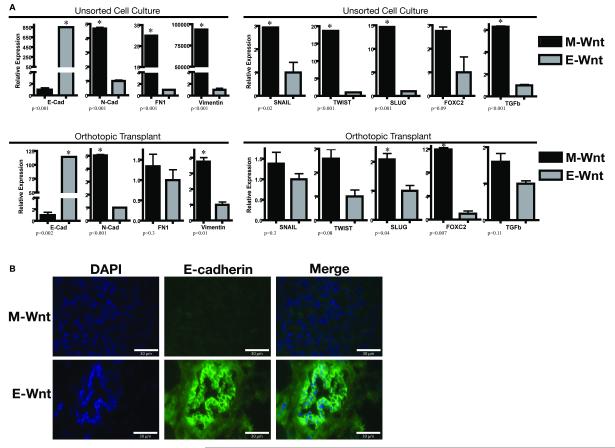
In microarray analyses (Figure 3), M-Wnt cells clustered tightly with previously identified claudin-low mouse and human tumors (4), which show inconsistent expression of basal keratins (keratins 5, 14 and 17) and low expression of claudin 3, claudin 7, HER2, and luminal markers such as ER, PR, GATA3, and keratins 18 and 19. In contrast, E-Wnt cells clustered tightly with mammary tumors from C3-Tag transgenic mice, an established model of basal-like breast cancer (5,23,24). M-Wnt cells, relative to E-Wnt cells, had significantly lower expression of E-cadherin and higher expression of N-cadherin, fibronectin, and vimentin (p<0.001, each gene) (Figure 4A, upper panel). MWnt cells, relative to E-Wnt cells, consistently overexpressed the EMT- and TIC-associated genes Snail (p=0.02), Twist (p<0.001), Slug (p<0.001), FOXC2 (p=0.09) and TGFβ (p<0.001). In the tumors, directional trends in gene expression mirrored those of the unsorted cells (Figure 4A, lower panel). No differences in Oct4 mRNA expression were detected between M-Wnt and E-Wnt cells or between their resultant tumors (data not shown). By immunofluorescent staining, E-cadherin was negligible in M-Wnt tumors, whereas E-Wnt tumors had E-cadherin-positive ductal structures (Figure 4B).
Figure 3. M-Wnt and E-Wnt cells cluster tightly with claudin-low and basal-like breast tumors, respectively, by microarray analysis.
(A) Overview of the complete hierarchical gene cluster diagram using 666 intrinsic genes. (B) Experimental sample-associated dendrogram showing the sample cluster relationships; M-Wnt and E-Wnt cell lines are indicated in red. M-Wnt cell lines cluster with claudin-low tumors, and E-Wnt cell lines cluster with basal-like tumors from C3-Tag transgenic mice (clustering indicated by boxes). (C) Expanded view of clustered genes having low expression levels in the claudin-low breast tumor subtype including Claudin 3 and 7. (D) Expanded view of a cluster of genes having high expression levels in the basal tumor subtype including Keratin 5. (E) Expanded view of a second set of genes having high expression levels in the basal tumor subtype encoding components of the basal lamina and including Keratin 14 and 17.
Figure 4. EMT gene expression patterns of M-Wnt and E-Wnt cells in vitro and in vivo.
(A) Relative gene expression of an EMT panel in M-Wnt and E-Wnt unsorted cells maintained in vitro (upper panel) or orthotopically transplanted into C57BL/6 mice (lower panel). Expression (mean ± SEM) of each gene in M-Wnt cells is shown relative to expression of that gene in E-Wnt cells (except for E-cadherin, which shows the E-Wnt expression relative to M-Wnt expression). Asterisk indicates p<0.05. Abbreviations: E-cadherin, E-cad; N-cadherin, N-cad; fibronectin, FN1. (B) Representative immunofluorescence images of M-Wnt and E-Wnt tumors stained using antibodies against E-cadherin and counterstained with DAPI. Scale bar=30 μm.
Dietary energy balance interventions in orthotopic transplant models of claudin-low (M-Wnt) and basal-like (E-Wnt) breast cancer
Generation of DIO, control, and CR phenotypes
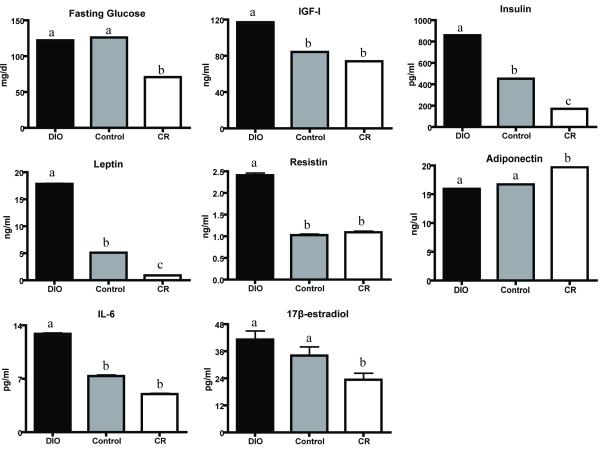
Ovariectomized female C57BL/6 mice administered DIO, control or CR diet regimens manifested 3 distinct phenotypes: obese, control and lean. At 8 weeks, body weights were 32.2±0.04 g in DIO mice (p<0.001 vs control), 25.6±0.03 g in control, and 17.3±0.03 g in CR mice (p<0.001 vs control). Similarly, percent body fat decreased from 42.0±0.05% in DIO mice (p<0.001 vs control) to 26.1±0.05% in control, and to 19.1±0.05% in CR mice (p<0.001 vs control). Significant differences in serum levels of energy balance-related hormones and cytokines after 14 weeks of diet included increased leptin, insulin, resistin, IGF-1, and IL-6 in DIO mice, relative to control (p<0.05 for all); and decreased leptin, insulin, and 17-β estradiol, and increased adiponectin in CR mice, relative to control (p<0.05, each; Figure 5). Fasting serum glucose was reduced in CR mice, relative to control mice (p<0.05).
Figure 5. Effects of dietary energy balance interventions on fasting glucose and metabolic hormones.
Serum levels (mean±SEM) of glucose, metabolic hormones and interleukin (IL)-6 at study termination (n=12-13 mice/group). Different letters represent significant between-group differences (p<0.05).
Effects of DIO and CR, relative to control, on tumor progression
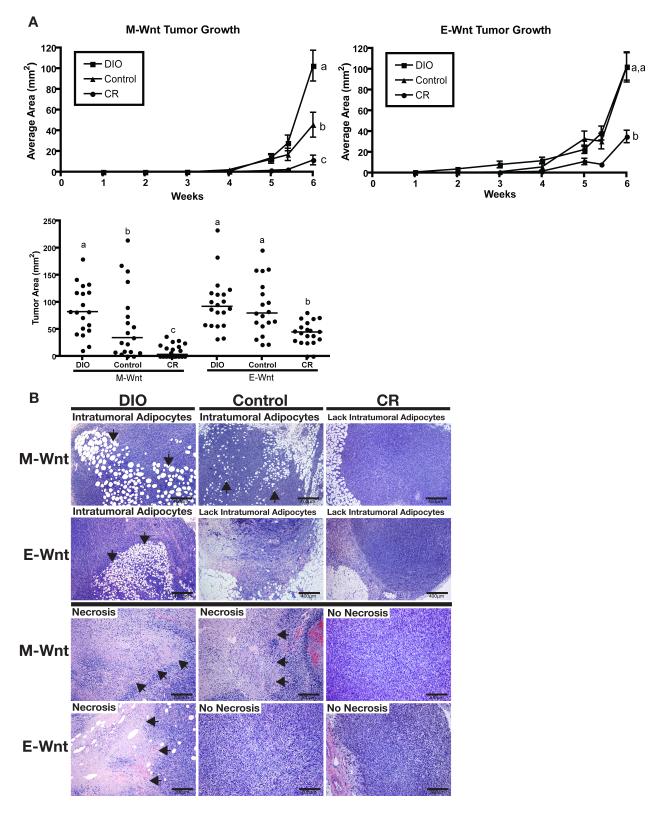
The DIO, control, and CR mice were orthotopically transplanted at 8 weeks with M-Wnt and E-Wnt cells to model claudin-low and basal-like breast tumors, respectively. The effect of dietary energy balance interventions on tumor growth over a 6-week period differed by tumor type: DIO, relative to control, significantly enhanced progression of MWnt tumors (p=0.011), but not E-Wnt tumors; and CR, relative to control, significantly diminished progression of both M-Wnt (p=0.012) and E-Wnt (p=0.001) tumors (Figure 6A, upper panel). The relative between-group differences in tumor area, as assessed in situ or ex vivo, mirrored each other (Figure 6A, lower panel). Relative to control diet, DIO increased, while CR decreased, necrosis and intratumoral adipocytes in both M-Wnt and E-Wnt tumors (Figure 6B). Gross necropsy examination found no evidence in any diet group of metastatic disease in liver or lungs.
Figure 6. Effect of dietary energy balance intervention on M-Wnt and E-Wnt tumor progression, intratumoral adipocyte accumulation, and necrosis.
(A) Tumor growth after M-Wnt and E-Wnt cells were transplanted (5×10⁴ M-Wnt cells/mouse or 5×10⁶ EWnt cells/mouse) into mammary fat pads of syngeneic mice pretreated with DIO, control, or CR diets (n=20 mice/group). Different letters represent significance at p<0.05. Data are mean ± SEM, except in scatter plot (line denotes median). (B) Representative photomicrographs of H&E-stained sections of M-Wnt and E-Wnt tumors from DIO, control, and CR mice. Arrows indicate regions of intratumoral adipocytes (scale bar=400 μm) or necrosis (scale bar=200 μm).
Effects of DIO and CR, relative to control, on EMT
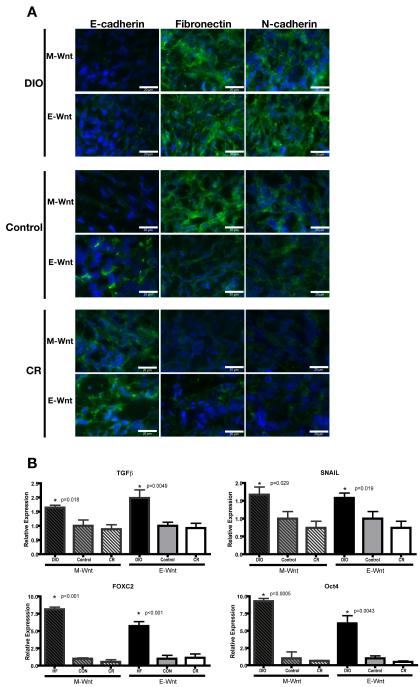
Consistently for both claudin-low (M-Wnt) and basal-like (E-Wnt) tumors, DIO (relative to control) promoted EMT, as evidenced by decreased E-cadherin, and increased fibronectin and N-cadherin protein expression; while CR (relative to control) promoted a shift toward an epithelial phenotype, as evidenced by increased E-cadherin, and decreased fibronectin and N-cadherin protein expression (Figure 7A). Specifically, tumors from DIO mice had negligible E-cadherin, while tumors from CR mice had negligible fibronectin and N-cadherin. Furthermore, consistently for both M-Wnt and EWnt tumors, DIO (relative to control) promoted expression of various EMT- and TIC-associated genes, including TGFβ (p<0.02 for both), SNAIL (p<0.03 for both), FOXC2 (p<0.001 for both), and Oct4 (p<0.005 for both), while CR had no detectable effect on their expression (Figure 7B). An effect of DIO or CR on TWIST or SLUG gene expression was not detected (data not shown). Diet had no significant effect on the level of Wnt-1 expression (data not shown).
Figure 7. Effect of dietary energy balance modulation on EMT- and TIC-related protein and gene expression.
(A) Representative immunofluorescence images of E-cadherin, fibronectin and N-cadherin staining (with DAPI counterstaining) in M-Wnt and E-Wnt tumors from DIO, control, and CR mice (scale bar=20 μm). (B) Relative expression of the EMT- and TIC-associated mRNAs encoding TGFβ, SNAIL, FOXC2, and Oct4 in M-Wnt and E-Wnt tumors from DIO, control and CR mice. Gene expression relative to control within each cell type is shown (mean ± SEM).
Discussion
In our novel murine syngeneic transplant models of claudin-low and basal-like breast cancers, dietary energy balance interventions (DIO or CR) differentially modulate EMT and tumor progression. The models involve two cell lines, M-Wnt and E-Wnt (each derived from a spontaneous MMTV-Wnt-1 mouse mammary tumor), orthotopically transplanted into ovariectomized C57BL/6 mice to emulate claudin-low and basal-like breast cancer, respectively. We found that: a) DIO increases, while CR inhibits, claudinlow (M-Wnt) tumor progression; b) CR inhibits, while DIO does not affect, basal-like (EWnt) tumor progression; and c) DIO promotes, while CR suppresses, EMT as evidenced by altered protein expression of epithelial (eg, E-cadherin) and mesenchymal (eg, fibronectin, N-cadherin) markers in M-Wnt and E-Wnt tumors.
Mouse model studies of claudin-low mammary cancer and/or TICs typically involve xenotransplantation of sorted cell lines or ex vivo cells into immunodeficient mice (25). Xenograft models are limited for studying links between energy balance, TICs and breast cancer because immunodeficient mice have aberrant mammary gland development, lack normal immune/inflammatory responses, and resist developing DIO and CR phenotypes. Syngeneic transplant models of claudin-low breast cancer derived from p53-null or IGF-1 receptor-overexpressing mouse mammary tumors (23,26) appear poorly suited for modeling energy balance/breast cancer links given the established roles of p53 and IGF-1 pathways in the anticancer effects of many interventions (27-29). Our M-Wnt transplant model of claudin-low mammary cancer overcomes many existing limitations by using a) cells derived from a spontaneous MMTV-Wnt-1 mouse mammary tumor that, like basal-like breast cancers in women, are responsive to CR and obesity (17,30), and b) a wild-type, syngeneic host with normal immune function, mammary gland development and metabolic responses to energy balance modulation. Additionally, a matched transplant model of basal-like mammary cancer, also using a MMTV-Wnt-1 mammary tumor-derived cell line (E-Wnt), complements the claudin-low model to facilitate direct comparisons between these understudied intrinsic subtypes.
The M-Wnt cell line is among the few reported murine mammary cancer cell lines to closely mimic the pathology and molecular profile of human claudin-low breast tumors (4,23,26). M-Wnt cells have mesenchymal morphology, are stably enriched in putative TICs (>60% CD44high/CD24low, with high ALDH activity), display molecular signatures of EMT resembling human claudin-low breast tumors, readily form mammospheres in suspension culture, are highly invasive and migratory, and generate ER-negative, PR-negative claudin-low mammary tumors when as few as 50 cells are injected orthotopically. In contrast, E-Wnt cells have epithelial morphology, display molecular profiles similar to human and mouse basal-like breast tumors, and (versus M-Wnt cells) are TIC-sparse (<5% CD44high/CD24low, with low ALDH activity), poorly form mammospheres, have minimal invasion and migration capacity, and form basal-like mammary tumors (PR-negative, weakly ER-positive) when 5×10⁵ cells are injected orthotopically. Transplanted MMTV-Wnt-1 tumor brei grows well in ovariectomized C57BL/6 female mice (17), and MMTV-Wnt-1 mice form spontaneous mammary tumors when crossed with ER-alpha knockout mice or treated with tamoxifen, suggesting Wnt-driven mammary tumorigenesis is not estrogen-dependent (28,31). With M-Wnt or EWnt cell lines, no presorting of cells is required before transplantation, and the morphologic and molecular features of the transplanted cells are recapitulated in resultant tumors.
Our findings of dietary effects on M-Wnt and E-Wnt tumors indicate a mechanistic link between energy balance, EMT and TICs in breast cancer progression. We speculate that DIO prepares fertile soil (tumor microenvironment), including changes in EMT, intratumoral adipocytes, and local and systemic hormones, growth factors, and cytokines, for enhanced tumor progression, and that determinants of growth in this fertile soil include the plant variety (intrinsic breast cancer subtype) and/or the seed density (extent of TIC enrichment). In contrast, CR may discourage tumor progression by acting on the soil antithetically to DIO, including promoting epithelial differentiation, discouraging EMT, preventing intratumoral adipocytes, and decreasing systemic hormones, growth factors and cytokines. Future studies are warranted to determine whether the mammary tumor-enhancing effects of DIO depend on the extent of TIC-enrichment in different subtypes of breast cancer, and whether CR targets different (and perhaps TIC-independent) pathways than DIO to impact breast cancer progression.
The present findings extend our previous reports (30, 32) and are the first (to our knowledge) to establish an effect of dietary energy balance interventions on EMT in mammary cancer. We report that in both M-Wnt and E-Wnt tumors DIO deceases E-cadherin, and increases N-cadherin and fibronectin protein expression, while CR increases E-cadherin expression. DIO in both tumor types also increases expression of several EMT- and TIC-associated genes, including TGFβ, SNAIL, FOXC2, and Oct4, each of which is modulated by obesity-related growth factors (9,10,11,33,34). Components of EMT may thus represent novel targets for preventing and/or controlling breast cancer and novel biomarkers of response to energy balance modulation or other interventions, particularly in obese women. In contrast, CR did not impact TIC-associated gene expression, which suggests DIO and CR exert their effects on mammary tumor progression via some shared and some distinct pathways. .
Although obesity, inflammation and breast cancer are individually associated with upregulation of TGFβ and other EMT pathway components (9,10), their combined interactions are poorly characterized. In our study, DIO increased EMT marker expression (including TGFβ) and intratumoral adipocyte accumulation, whereas CR decreased EMT and prevented intratumoral adipocyte accumulation, in M-Wnt and EWnt tumors. Furthermore, intratumoral adipocytes were present in M-Wnt, but not EWnt, tumors from control diet-fed mice. Thus, connections between EMT, TIC enrichment and the presence of intratumoral adipocytes are plausible and potentially important in mammary tumor development and progression (39,40).
Study limitations include inadequate assessments of 1) the impact of energy balance on metastases, and 2) the direct effect of high-fat intake independent of obesity. Our previous studies showing that Wnt-1 tumors grow faster in genetically obese db/db mice (that overconsume control diet) than wild-type control mice strongly support an obesity (independent of dietary fat) effect (30). We did not elucidate the relative roles of individual obesity-related growth factors/cytokines in EMT and breast cancer, although additional studies on leptin and IGF-1 effects in obesity-driven EMT and metastases are underway.
In summary, in novel murine models of two highly aggressive forms of breast cancer, dietary energy balance interventions impact progression of claudin-low tumors (affected by both DIO and CR) and basal-like tumors (affected by CR only), and also modulate EMT in both mammary tumor subtypes (each affected by both DIO and CR). To our knowledge, this is the first study to demonstrate that dietary energy balance interventions differentially affect tumor progression and EMT in these breast cancer subtypes. Taken together, our findings suggest that components of the EMT and TIC pathways represent possible targets for breaking the obesity-breast cancer link, particularly for preventing and/or controlling TIC-enriched subtypes that confer poor prognosis and are often therapy-resistant, such as claudin-low breast cancer.
Supplementary Material
Acknowledgments
We thank Crystal Salcido and Mollie Wright for their technical contributions.
Grant Support: Breast Cancer Research Foundation (UTA09-001068; Hursting), NIEHS ( P30ES007784; Hursting), USAMRMC BCRP Fellowship (W81XWH-09-1-0720; Dunlap) and the intramural program at the National Cancer Institute, NIH (Varticovski).
Footnotes
The authors have no conflicts of interest to report.
References
- 1.Reeves GK, Pirie K, Beral V, Green J, Spencer E, Bull D. Cancer incidence and mortality in relation to body mass index in the Million Women Study: cohort study. BMJ. 2007;335:1134. doi: 10.1136/bmj.39367.495995.AE. [DOI] [PMC free article] [PubMed] [Google Scholar]
- 2.Sjostrom L, Gummesson A, Sjostrom CD, Narbro K, Peltonen M, Wedel H, et al. Effects of bariatric surgery on cancer incidence in obese patients in Sweden (Swedish Obese Subjects Study): a prospective, controlled intervention trial. Lancet Oncol. 2009;10:653–62. doi: 10.1016/S1470-2045(09)70159-7. [DOI] [PubMed] [Google Scholar]
- 3.Michels KB, Ekbom A. Caloric restriction and incidence of breast cancer. JAMA. 2004;291:1226–30. doi: 10.1001/jama.291.10.1226. [DOI] [PubMed] [Google Scholar]
- 4.Prat A, Parker JS, Karginova O, Fan C, Livasy C, Herschkowitz JI, et al. Phenotypic and molecular characterization of the claudin-low intrinsic subtype of breast cancer. Breast Cancer Res. 2010;12:R68. doi: 10.1186/bcr2635. [DOI] [PMC free article] [PubMed] [Google Scholar]
- 5.Herschkowitz JI, Simin K, Weigman VJ, Mikaelian I, Usary J, Hu Z, et al. Identification of conserved gene expression features between murine mammary carcinoma models and human breast tumors. Genome Biol. 2007;8:R76. doi: 10.1186/gb-2007-8-5-r76. [DOI] [PMC free article] [PubMed] [Google Scholar]
- 6.Yang XR, Chang-Claude J, Goode EL, Couch FJ, Nevanlinna H, Milne RL, et al. Associations of breast cancer risk factors with tumor subtypes: a pooled analysis from the Breast Cancer Association Consortium studies. J Natl Cancer Inst. 2011;103:250–63. doi: 10.1093/jnci/djq526. [DOI] [PMC free article] [PubMed] [Google Scholar]
- 7.Stark A, Schultz D, Kapke A, Nadkarni P, Burke M, Linden M, et al. Obesity and risk of the less commonly diagnosed subtypes of breast cancer. Eur J Surg Oncol. 2009;35:928–35. doi: 10.1016/j.ejso.2008.11.009. [DOI] [PubMed] [Google Scholar]
- 8.Khramtsov AI, Khramtsova GF, Tretiakova M, Huo D, Olopade OI, Goss KH. Wnt/beta-catenin pathway activation is enriched in basal-like breast cancers and predicts poor outcome. Am J Pathol. 2010;176:2911–20. doi: 10.2353/ajpath.2010.091125. [DOI] [PMC free article] [PubMed] [Google Scholar]
- 9.Alessi MC, Bastelica D, Morange P, Berthet B, Leduc I, Verdier M, et al. Plasminogen activator inhibitor 1, transforming growth factor-beta1, and BMI are closely associated in human adipose tissue during morbid obesity. Diabetes. 2000;49:1374–80. doi: 10.2337/diabetes.49.8.1374. [DOI] [PubMed] [Google Scholar]
- 10.Samad F, Yamamoto K, Pandey M, Loskutoff DJ. Elevated expression of transforming growth factor-beta in adipose tissue from obese mice. Mol Med. 1997;3:37–48. [PMC free article] [PubMed] [Google Scholar]
- 11.Kushiro K, Nunez NP. Ob/ob serum promotes a mesenchymal cell phenotype in B16BL6 melanoma cells. Clin Exp Metastasis. 2011;28:877–86. doi: 10.1007/s10585-011-9418-4. [DOI] [PubMed] [Google Scholar]
- 12.Creighton CJ, Chang JC, Rosen JM. Epithelial-mesenchymal transition (EMT) in tumor-initiating cells and its clinical implications in breast cancer. J Mammary Gland Biol Neoplasia. 2010;15:253–60. doi: 10.1007/s10911-010-9173-1. [DOI] [PubMed] [Google Scholar]
- 13.Svirshchevskaya EV, Mariotti J, Wright MH, Viskova NY, Telford W, Fowler DH, et al. Rapamycin delays growth of Wnt-1 tumors in spite of suppression of host immunity. BMC Cancer. 2008;8:176. doi: 10.1186/1471-2407-8-176. [DOI] [PMC free article] [PubMed] [Google Scholar]
- 14.Dontu G, Abdallah WM, Foley JM, Jackson KW, Clarke MF, Kawamura MJ, et al. In vitro propagation and transcriptional profiling of human mammary stem/progenitor cells. Genes Dev. 2003;17:1253–70. doi: 10.1101/gad.1061803. [DOI] [PMC free article] [PubMed] [Google Scholar]
- 15.Wright MH, Calcagno AM, Salcido CD, Carlson MD, Ambudkar SV, Varticovski L. Brca1 breast tumors contain distinct CD44+/CD24− and CD133+ cells with cancer stem cell characteristics. Breast Cancer Res. 2008;10:R10. doi: 10.1186/bcr1855. [DOI] [PMC free article] [PubMed] [Google Scholar]
- 16.Charafe-Jauffret E, Ginestier C, Iovino F, Tarpin C, Diebel M, Esterni B, et al. Aldehyde dehydrogenase 1-positive cancer stem cells mediate metastasis and poor clinical outcome in inflammatory breast cancer. Clin Cancer Res. 2010;16:45–55. doi: 10.1158/1078-0432.CCR-09-1630. [DOI] [PMC free article] [PubMed] [Google Scholar]
- 17.Nunez NP, Perkins SN, Smith NC, Berrigan D, Berendes DM, Varticovski L, et al. Obesity accelerates mouse mammary tumor growth in the absence of ovarian hormones. Nutr Cancer. 2008;60:534–41. doi: 10.1080/01635580801966195. [DOI] [PubMed] [Google Scholar]
- 18.Lashinger LM, Malone LM, McArthur MJ, Goldberg JA, Daniels EA, Pavone A, et al. Genetic reduction of insulin-like growth factor-1 mimics the anticancer effects of calorie restriction on cyclooxygenase-2-driven pancreatic neoplasia. Cancer Prev Res (Phila) 2011;4:1030–40. doi: 10.1158/1940-6207.CAPR-11-0027. [DOI] [PMC free article] [PubMed] [Google Scholar]
- 19.Herzig M, Savarese F, Novatchkova M, Semb H, Christofori G. Tumor progression induced by the loss of E-cadherin independent of beta-catenin/Tcf-mediated Wnt signaling. Oncogene. 2007;26:2290–8. doi: 10.1038/sj.onc.1210029. [DOI] [PubMed] [Google Scholar]
- 20.Mani SA, Guo W, Liao MJ, Eaton EN, Ayyanan A, Zhou AY, et al. The epithelial-mesenchymal transition generates cells with properties of stem cells. Cell. 2008;133:704–15. doi: 10.1016/j.cell.2008.03.027. [DOI] [PMC free article] [PubMed] [Google Scholar]
- 21.Kalluri R, Weinberg RA. The basics of epithelial-mesenchymal transition. J Clin Invest. 2009;119:1420–8. doi: 10.1172/JCI39104. [DOI] [PMC free article] [PubMed] [Google Scholar]
- 22.Li Y, Hively WP, Varmus HE. Use of MMTV-Wnt-1 transgenic mice for studying the genetic basis of breast cancer. Oncogene. 2000;19:1002–9. doi: 10.1038/sj.onc.1203273. [DOI] [PubMed] [Google Scholar]
- 23.Campbell CI, Thompson DE, Siwicky MD, Moorehead RA. Murine mammary tumor cells with a claudin-low genotype. Cancer Cell Int. 2011;11:28. doi: 10.1186/1475-2867-11-28. [DOI] [PMC free article] [PubMed] [Google Scholar]
- 24.Zhu M, Yi M, Kim CH, Deng C, Li Y, Medina D, et al. Integrated miRNA and mRNA expression profiling of mouse mammary tumor models identifies miRNA signatures associated with mammary tumor lineage. Genome Biol. 2011;12:R77. doi: 10.1186/gb-2011-12-8-r77. [DOI] [PMC free article] [PubMed] [Google Scholar]
- 25.Marotta LL, Almendro V, Marusyk A, Shipitsin M, Schemme J, Walker SR, et al. The JAK2/STAT3 signaling pathway is required for growth of CD44CD24 stem cell-like breast cancer cells in human tumors. J Clin Invest. 2011;121:2723–35. doi: 10.1172/JCI44745. [DOI] [PMC free article] [PubMed] [Google Scholar]
- 26.Herschkowitz JI, Zhao W, Zhang M, Usary J, Murrow G, Edwards D, et al. Comparative oncogenomics identifies breast tumors enriched in functional tumor-initiating cells. Proc Natl Acad Sci U S A. 2011 doi: 10.1073/pnas.1018862108. Epub ahead of print. [DOI] [PMC free article] [PubMed] [Google Scholar]
- 27.Colbert LH, Westerlind KC, Perkins SN, Haines DC, Berrigan D, Donehower LA, et al. Exercise effects on tumorigenesis in a p53-deficient mouse model of breast cancer. Med Sci Sports Exerc. 2009;41:1597–605. doi: 10.1249/MSS.0b013e31819f1f05. [DOI] [PMC free article] [PubMed] [Google Scholar]
- 28.Fuchs-Young R, Shirley SH, Lambertz I, Colby JK, Tian J, Johnston D, et al. P53 genotype as a determinant of ER expression and tamoxifen response in the MMTV-Wnt-1 model of mammary carcinogenesis. Breast Cancer Res Treat. 2011;130:399–408. doi: 10.1007/s10549-010-1308-y. [DOI] [PMC free article] [PubMed] [Google Scholar]
- 29.Hursting SD, Smith SM, Lashinger LM, Harvey AE, Perkins SN. Calories and carcinogenesis: lessons learned from 30 years of calorie restriction research. Carcinogenesis. 2010;31:83–9. doi: 10.1093/carcin/bgp280. [DOI] [PubMed] [Google Scholar]
- 30.Zheng Q, Dunlap SM, Zhu J, Downs-Kelly E, Rich J, Hursting SD, et al. Leptin deficiency suppresses MMTV-Wnt-1 mammary tumor growth in obese mice and abrogates tumor initiating cell survival. Endocr Relat Cancer. 2011;18:491–503. doi: 10.1530/ERC-11-0102. [DOI] [PMC free article] [PubMed] [Google Scholar]
- 31.Bocchinfuso WP, Hively WP, Couse JF, Varmus HE, Korach KS. A mouse mammary tumor virus-Wnt-1 transgene induces mammary gland hyperplasia and tumorigenesis in mice lacking estrogen receptor-alpha. Cancer Res. 1999;59:1869–76. [PubMed] [Google Scholar]
- 32.Padovani M, Lavigne JA, Chandramouli GV, Perkins SN, Barrett JC, Hursting SD, et al. Distinct effects of calorie restriction and exercise on mammary gland gene expression in C57BL/6 mice. Cancer Prev Res (Phila) 2009;2:1076–87. doi: 10.1158/1940-6207.CAPR-09-0034. [DOI] [PMC free article] [PubMed] [Google Scholar]
- 33.Yang Z, Norwood KA, Smith JE, Kerl JG, Wood JR. Genes involved in the immediate early response and epithelial-mesenchymal transition are regulated by adipocytokines in the female reproductive tract. Mol Reprod Dev. 2012;79:128–37. doi: 10.1002/mrd.22006. [DOI] [PubMed] [Google Scholar]
- 34.Lindley LE, Briegel KJ. Molecular characterization of TGFbeta-induced epithelial-mesenchymal transition in normal finite lifespan human mammary epithelial cells. Biochem Biophys Res Commun. 2010;399:659–64. doi: 10.1016/j.bbrc.2010.07.138. [DOI] [PubMed] [Google Scholar]
- 35.Dhasarathy A, Kajita M, Wade PA. The transcription factor snail mediates epithelial to mesenchymal transitions by repression of estrogen receptor-alpha. Mol Endocrinol. 2007;21:2907–18. doi: 10.1210/me.2007-0293. [DOI] [PMC free article] [PubMed] [Google Scholar]
- 36.Yu J, Vodyanik MA, Smuga-Otto K, Antosiewicz-Bourget J, Frane JL, Tian S, et al. Induced pluripotent stem cell lines derived from human somatic cells. Science. 2007;318:1917–20. doi: 10.1126/science.1151526. [DOI] [PubMed] [Google Scholar]
- 37.Yuan F, Zhou W, Zou C, Zhang Z, Hu H, Dai Z, et al. Expression of Oct4 in HCC and modulation to wnt/beta-catenin and TGF-beta signal pathways. Mol Cell Biochem. 2010;343:155–62. doi: 10.1007/s11010-010-0509-3. [DOI] [PubMed] [Google Scholar]
- 38.Pilie PG, Ibarra-Drendall C, Troch MM, Broadwater G, Barry WT, Petricoin EF, 3rd, et al. Protein microarray analysis of mammary epithelial cells from obese and nonobese women at high risk for breast cancer: feasibility data. Cancer Epidemiol Biomarkers Prev. 2011;20:476–82. doi: 10.1158/1055-9965.EPI-10-0847. [DOI] [PMC free article] [PubMed] [Google Scholar]
- 39.Dirat B, Bochet L, Dabek M, Daviaud D, Dauvillier S, Majed B, et al. Cancer-associated adipocytes exhibit an activated phenotype and contribute to breast cancer invasion. Cancer Res. 2011;71:2455–65. doi: 10.1158/0008-5472.CAN-10-3323. [DOI] [PubMed] [Google Scholar]
- 40.Subbaramaiah K, Howe LR, Bhardwaj P, Du B, Gravaghi C, Yantiss RK, et al. Obesity is associated with inflammation and elevated aromatase expression in the mouse mammary gland. Cancer Prev Res (Phila) 2011;4:329–46. doi: 10.1158/1940-6207.CAPR-10-0381. [DOI] [PMC free article] [PubMed] [Google Scholar] [Retracted]
Associated Data
This section collects any data citations, data availability statements, or supplementary materials included in this article.


