

Abstract
Recent evidence suggests that metabolic changes play a pivotal role in the biology of cancer and in particular renal cell carcinoma (RCC). Here, a global metabolite profiling approach was applied to characterize the metabolite pool of RCC and normal renal tissue. Advanced decision tree models were applied to characterize the metabolic signature of RCC and to explore features of metastasized tumours. The findings were validated in a second independent dataset. Vitamin E derivates and metabolites of glucose, fatty acid, and inositol phosphate metabolism determined the metabolic profile of RCC. α-tocopherol, hippuric acid, myoinositol, fructose-1-phosphate and glucose-1-phosphate contributed most to the tumour/normal discrimination and all showed pronounced concentration changes in RCC. The identified metabolic profile was characterized by a low recognition error of only 5% for tumour versus normal samples. Data on metastasized tumours suggested a key role for metabolic pathways involving arachidonic acid, free fatty acids, proline, uracil and the tricarboxylic acid cycle. These results illustrate the potential of mass spectroscopy based metabolomics in conjunction with sophisticated data analysis methods to uncover the metabolic phenotype of cancer. Differentially regulated metabolites, such as vitamin E compounds, hippuric acid and myoinositol, provide leads for the characterization of novel pathways in RCC.
Keywords: kidney cancer, metabolism, metabolomics, metastasis
Introduction
The metabolite pool of cells and tissues represents the end result of metabolism determined by genetic, environmental and nutritional factors. The metabolic profile of biological systems is closely related to the individual phenotype and reflects the biological end-point of a multitude of pathways and their interaction with any confounding stimuli. Cancer cells exhibit activation of specific metabolic pathways to compensate for their extremely high energy demands. Indeed increased glucose uptake and lactate production and decreased respiration are key phenomena of tumour cell metabolism. In particular, the generation of an acidic microenvironment through increased lactate production, even under aerobic conditions, may confer extracellular matrix degeneration and exert toxic effects on surrounding cell populations, while being harmless for the cancer cell itself [1]. Thus, the metabolic adaptations may indeed be critical for the development of accelerated proliferation and the invasive growth of tumour cell populations [1, 2]. The molecular mechanisms underlying the metabolic hallmarks of cancer are still poorly understood, although genetic, epigenetic and environmental factors driving cancer development and progression will interact to determine the metabolic phenotype of tumour cells. Recent studies suggest that metabolic changes play a pivotal role in the biology of renal cell carcinoma (RCC) – a tumour entity that is largely resistant to conventional chemo- and radiotherapy. The metabolic profile of renal tumours may thus serve as a reliable biomarker of malignant transformation and biological behaviour.
Recent advances in metabolic profiling technologies by providing quantitative measures of metabolite profiles from gas chromatography time-of-flight mass spectrometry (GC-TOF-MS) based technology present the opportunity to apply this technique in human specimens [3–5]. Global metabolic profiling has emerged as a promising approach to characterize the metabolite pool within a cell, tissue or bodily fluid under certain conditions, such as health or disease status [4, 6, 7]. Metabolic profiling is applied to monitor the health to disease continuum and has the potential of increasing our understanding of the mechanisms of disease [8]. Thus the characterization of the metabolic features in tumours is expected to provide a better understanding of the mechanisms of malignant transformation and progression and may lead to the identification of metabolic biomarkers for cancer detection and prognostication. However, comparative profiling of low molecular weight compounds, such as sugars, lipids and amino acids, in cancer as compared to the corresponding normal tissue is a rather unexplored area. The objective of this study was to characterize the key metabolic features of RCC using GC-TOF-MS and mutual information as well as decision tree-based data analysis.
Material and methods
Study population and sample collection
Tumour tissue and specimens of normal renal cortex tissue were collected from patients undergoing surgical treatment for primary RCC at the Department of Urology, Charité-University Medicine Berlin between November 1995 and November 2005. They included 29 female and 67 male patients with a mean age of 62 years (range 36–87). Their use was approved by the Ethics Committee of the Free University of Berlin, and all patients gave their informed consent prior to surgery. Tissue samples were obtained during radical nephrectomy following a standard operating procedure. All RCC specimens were derived from primary tumours. Tissue specimens were dissected in the operating room immediately after removal of the kidney, snap-frozen in liquid nitrogen and stored at −80°C until use. RCC samples were serially sectioned before further processing. Additional sections were stained with haematoxylin–eosin for histopathological evaluation. The histopathological classification and staging was based on the 1997 World Health Organization and TNM classification guidelines (International Union Against Cancer, 1997): pT1 (n= 53), pT2 (n= 13), pT3 (n= 30); M0 (n= 87), M1 (n= 9). Primary tumour tissue samples and normal tissue samples from 57 patients (39 male; 18 female) were chosen for the first round of metabolic analyses. Tumour characteristics for these RCC patients were: pT1 (n= 30), pT2 (n= 12), pT3 (n= 15), G1 or 2 (n= 36) and G3 (n= 21). Of these, 36 patients had localized tumours and 21 had or developed metastasized RCC. Later, a second set of samples was put together from 39 patients (29 male; 10 female; RCC: n= 39; normal tissue: n= 27) for validation purposes. Tumour characteristics were: pT1 (n= 16), pT2 (n= 8), pT3 (n= 15), G1 or 2 (n= 22), G3 (n= 17), localized RCC (n= 32) and metastasized RCC (n= 7). Most of the tumour samples analysed belonged to the clear cell subtype of RCC (n= 54 in the first set; n= 34 in the second set).
Sample preparation and GC-TOF-MS analysis
Frozen biopsy tissue was processed under standard operating procedures. Samples were serially sectioned in a cryostat microtome to prevent thawing. A defined amount (30 mg) of sectioned tissue was then transferred to a 2 ml centrifuge tube and homogenized. Samples were centrifuged at 14,000 rpm for 2 min. and the supernatant taken and dried to complete dryness in a rotary evaporator in the glass vials used for GC-MS analysis.
GC-TOF-MS metabolite profiling was performed on a Leco Pegasus 3 time-of-flight mass spectrometer (Leco, St. Joseph, MI, USA) equipped with a Direct Thermal Desorption injector (ATAS GL International, The Netherlands) coupled to an HP 5890 gas chromatograph and a dual-arm autosampler with automatic derivatization and liner exchange. This eliminates both the impact of potential degradation/synthesis artefacts and sample carry-over and means that no phase separation of samples is necessary, thereby broadening the coverage of the profiling technique to non-polar compounds. The method allows relative quantification of metabolites which cover a large part of primary metabolism such as sugars, organic acids, amino acids and alcohols in addition to sterols and free lipids. Samples were derivatized in 10 μl methoxyamine hydrochloride in N, N-dimethylformamide diethyl acetal (40 mg/ml) at 42°C for 180 min. followed by 90 μl N-methyl-N-trimethylsilyltrifluoroacetamide at 37°C for 30 min.
A total of 1.5 μl samples were injected in splitless mode at 85°C, ramping to 290°C at 4°C/sec. The GC used a constant flow of 2 ml/min. helium as carrier gas and a 30 m 320 μm ID MDN35 column. The column temperature gradient was held at 85°C for 210 sec., followed by a linear gradient of 15°C/min. reaching a target temperature of 360°C. A 230-sec. acquisition delay was used and spectra subsequently acquired at the rate of 20/sec.
Chromatograms were processed using Leco ChromaTOF software (version 3.25) and peaks with a signal to noise ratio >10 were exported before using an algorithm developed in-house for dealing with the output.txt files [9]. Mass spectra were compared to an in-house mass spectral library for metabolite identification and peak heights expressed relative to an internal standard (13C sorbitol-D).
Statistical analysis
In a univariate approach the non-parametric Mann-Whitney U-test was applied to search for significant differences in relative concentrations of metabolites between RCC and normal tissue samples, and between localized and metastasized primary tumours. For key metabolites associations of relative concentrations with tumour stage or grade were explored.
Metabolite profile data were normalized to an internal standard, log transformed and scaled according to [9]. Metabolites with more than 20% missing values were excluded and remaining missing values were estimated via BPCA using the R package pcaMethods [10]. Differences were expressed as median fold change and P-values Bonferroni corrected to address the problem of multiple testing. These pairwise comparisons were restricted to all metabolites that could be identified based on comparison to the mass spectral library.
For multivariate supervised classification, all metabolites, irrespective of their identified/non-identified status, were initially included. Data were normalized to the internal standard and any variables containing missing values were excluded. As an initial step the first dataset was used to determine metabolic signature differences in a two-group scenario between tumour present/absent groups. Subsequently this was expanded to a three-group scenario, in which tumour presence was further sub-divided into metastasized/non-metastasized.
A number of different mainly decision tree classification algorithms, available in the WEKA platform [11], was used (random forest, random tree, alternating decision tree (ADTree), sequential minimal optimization, simple logistic and C4.5).
Data were segregated into learning (50%) and testing (50%) subsets and models were validated using 10-fold cross-validation. As a second step, the most promising model was then further validated using the fully independent second dataset. In a further exploratory analysis, metabolites that contributed most to the classification of localized versus metastasized were tested as predictors of recurrence-free survival in Cox regression analyses. For further information the maximal information gains for a decision in the classification of tumour presence/absence and metastasized/non-metastasized were calculated for each single metabolite using mutual information. As decision tree methods generate minimal classification models metabolites with a high informational gain are not necessarily all contained in the decision tree models.
Results
Comparative metabolic profiling of RCC and normal renal tissue
In the first round of analyses, RCC tissue samples and control cortex specimens from 57 patients with RCC were investigated. The cohort consisted of 36 patients with localized disease and 21 patients with metastatic tumours either at time of diagnosis or who developed metastasis during follow-up. The mean follow-up was 41 months (range 2–113 months). Data matrices consisted of 188 metabolites, of which 74 could be identified, 25 putatively identified, 37 which could be assigned a possible metabolite class and 52 whose chemical structure remained unassigned.
All generated classification models describing tumour presence/absence performed satisfactorily on the first dataset. Alternating decision trees (ADTree) are preferred due to the fewer variables being necessary to yield the high prediction power of 95% correct assignment (Table 1, Fig. 1). Thus this model was selected for validation using the second dataset, where it resulted in 77% correct classification. This is less than the 95% observed for the first dataset, but is however, very similar to the classification reached within the second dataset itself (75% with the ADTree with 10-fold cross-validation).
Table 1.
Performance of the decision tree models for the discrimination between normal and RCC tumour samples
| All metabolites First dataset | Validation dataset | Identified metabolites only First dataset | Validation dataset | |||||||||||||||||||||
|---|---|---|---|---|---|---|---|---|---|---|---|---|---|---|---|---|---|---|---|---|---|---|---|---|
| Method* | 50% | crossfold10 | 50% | crossfold10 | 50% | crossfold10 | 50% | crossfold10 | ||||||||||||||||
| Random Forest | 86% | 94% | 74% | 71% | 91% | 91% | 50% | 78% | ||||||||||||||||
| Random Tree | 52% | 71% | 82% | 65% | 71% | 70% | 56% | 66% | ||||||||||||||||
| ADTree | 95% | 95% | 68% | 75% | 89% | 92% | 47% | 73% | ||||||||||||||||
| SMO | 92% | 97% | 85% | 88% | 95% | 92% | 59% | 81% | ||||||||||||||||
| Simple Logistic | 95% | 95% | 91% | 84% | 94% | 85% | 56% | 85% | ||||||||||||||||
| lower border** | ||||||||||||||||||||||||
| most frequent class/total | 66/132 | 40/68 | 65/130 | 39/67 | ||||||||||||||||||||
| float of lower border | 50% | 59% | 50% | 58% | ||||||||||||||||||||
The correct classification returned by each of the five different classification methods used (random forest, random tree, ADTree, SMO and simple logistic) upon treating the two-class problem (tumour yes/no) is shown as percentage. Results are shown having divided the dataset into 50% training and 50% testing sub-groups and having used 10-fold cross-validation.
*The lower border is the percentage of the total sample number represented by the most numerous class. This percentage correct classification could therefore be achieved simply by always classifying unknown samples as belonging to this class. Therefore the success rate of the models should exceed the lower border in order to be considered better than this overly simplistic selection method.
Fig 1.
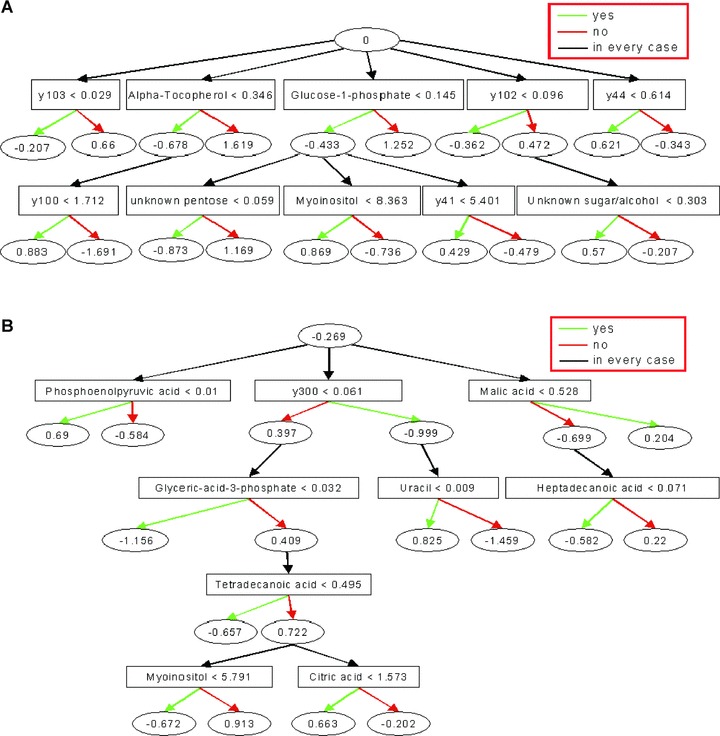
Decision Tree Model (ADTree) generated for the two-class problem of discriminating RCC and normal renal tissue samples (A), and localized RCC and metastatic disease (B). Key metabolites are shown with the corresponding normalized relative peak intensity cut-offs. Each metabolite resembles a decision node that is linked to two prediction nodes with the corresponding prediction values. Classification of a hypothetical sample would be based on the sum of final attained prediction node values that are determined by applying the peak intensity cut-offs for all metabolites of the decision tree on the sample-specific data record. Any result> 0 means a class prediction of 0 (A: normal tissue; B: localized tumour), any result < 0 a class prediction of 1 (A: RCC, B: metastatic tumour). The model was trained with the first dataset and used all metabolites irrespective of identified status.
Tree-based learning algorithms in particular, are designed to the selection of the single best classifier at each decision step and therefore occasionally prone to the exclusion of others which could themselves carry potentially meaningful information (Fig. 2). We therefore tested for differences between normal und RCC specimens by pairwise comparison of the relative concentration of all identifiable metabolites. These analyses were confined to all metabolites detected in .80% of samples. Metabolites with differences in relative concentrations are shown in Table 2. These include metabolites which may not have been detected in all samples and thus may not be contained in the decision tree models, which are intolerant of missing values. These compounds were subsequently assigned to common pathways according to the Kyoto Encyclopedia of Genes and Genomes. The data indicate that the metabolic signature of RCC tends to be characterized by metabolites associated with glucose metabolism, such as glucose-1-phosphate, markers of fatty acid and phospholipids metabolism, such as palmitate, arachidonic acid and glycerol, and myoinositol belonging to the inositol polyphosphate family of cell signalling molecules. Interestingly, and consistent with the decision tree models, the metabolites revealing the largest relative RCC versus control differences were a-tocopherol and hippuric acid. Elevated levels of a-tocopherol were detected in RCC thereby pointing to a potential activation of vitamin E metabolism in tumour cells. When a-tocopherol was considered alone in a ROC analysis, correct classification of 84.8% of RCC samples and 92.4% of normal tissue samples was achieved (data not shown). Although similar accuracy could be achieved using hippuric acid as a marker, the relevance of the greatly decreased concentration of this metabolite in RCC is unknown. The descriptive statistics for selected metabolites are shown in Fig. 3. In further data exploration we tried to see whether or not metastasizing tumours could be differentiated from localized ones. Applying an ADTree model did not yield satisfactory results, largely due to the restrictive sample number, however a direct pairwise comparison of the relative metabolite concentrations in both tumour phenotypes suggested a number of differences (Table 3).
Fig 2.
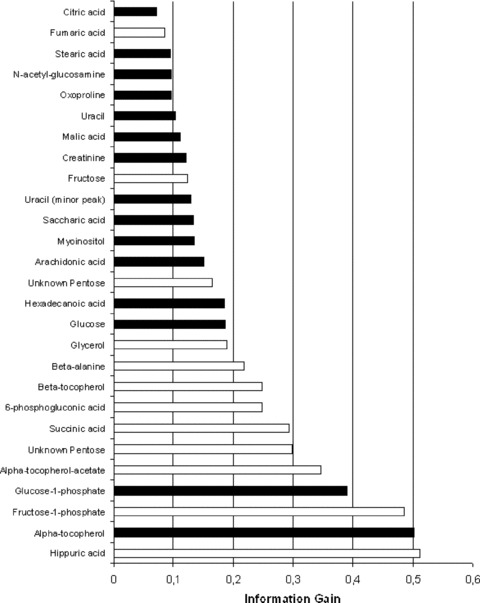
The information gain for the two class discrimination between RCC and normal tissue by key metabolites. Metabolites with the highest gain contribute most to the correct discrimination. The theoretical maximum gain = 1. The black bars indicate metabolites that were not detectable in all samples and were therefore unable to be incorporated into the ADTree model, but all of these metabolites were detected in over 90% of samples, except for 6-phosphogluconic acid (88%).
Table 2.
Metabolites displaying relative concentration differences in RCC and control renal tissue samples
| Compound | Median fold change* | Training set | P-value** Validation set | Combined set | Pathway |
|---|---|---|---|---|---|
| α-tocopherol | 5.2 | <0.0007 | <0.0007 | <0.0007 | Vitamin E metabolism |
| α-tocopherol acetate | 4.0 | <0.0007 | n.s. | <0.0007 | |
| β-tocopherol | 3.1 | <0.0007 | 0.004 | <0.0007 | |
| Arachidonic acid | –2.6 | <0.0007 | <0.0007 | <0.0007 | Arachidonic acid metabolism (involved in VEGF signalling pathway and angiogenesis) |
| Palmitate | –1.5 | <0.0007 | 0.02 | <0.0007 | Fatty acid metabolism |
| Tridecanoic acid | –1.4 | <0.0007 | n.s. | 0.0032 | |
| Glycerol | –2.2 | <0.0007 | 0.0008 | <0.0007 | Glycerolipid metabolism |
| Citric acid | 1.6 | 0.001 | n.s. | <0.0007 | TCA cycle |
| Fumaric acid | –1.9 | 0.01 | <0.0007 | <0.0007 | |
| Succinic acid | –3.4 | <0.0007 | 0.003 | <0.0007 | |
| Malic acid | –1.7 | <0.0007 | 0.01 | <0.0007 | |
| Glucose | 5.0 | <0.0007 | n.s. | 0.0008 | Glycolysis, Pentose phosphate pathway |
| Glucose (minor peak) | 4.8 | <0.0007 | n.s. | <0.0007 | |
| Glucose-1-phosphate | 3.0 | <0.0007 | n.s. | <0.0007 | Glycolysis, Pentose phosphate pathway, Nucleotide sugars metabolism, |
| 6-phosphogluconic acid | 6.3 | <0.0007 | n.s. | <0.0007 | Glycolysis, Pentose phosphate pathway, byproduct of tyrosine kinase acticity |
| Fructose | 2.0 | <0.0007 | n.s. | <0.0007 | Fructose and mannose metabolism |
| Fructose-1-phosphate | 8.3 | <0.0007 | n.s. | <0.0007 | |
| myo-Inositol | –1.5 | <0.0007 | <0.0007 | <0.0007 | Phosphatidylinositol signalling system, Inositol phosphate metabolism |
| Saccharic acid | –2.6 | <0.0007 | n.s. | <0.0007 | Ascorbate and aldarate metabolism (linked to glycolysis) |
| N-Acetyl-D-glucosamine | –1.7 | 0.034 | <0.0007 | <0.0007 | Glutamate metabolism, Aminosugars metabolism |
| β-alanine | 2.5 | <0.0007 | n.s. | <0.0007 | Pyrimidine metabolism |
| Uracil | –2.0 | <0.0007 | 0.004 | <0.0007 | |
| Uracil (second peak) | –3.7 | <0.0007 | 0.002 | <0.0007 | |
| Hippuric acid | –35.2 | <0.0007 | <0.0007 | <0.0007 | Phenylalanine metabolism |
| Oxoproline | 1.4 | <0.0007 | n.s. | 0.0037 | Gluthathion metabolism (radical detoxification) |
Fig 3.
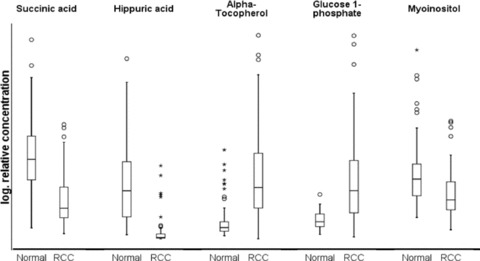
Descriptive statistics of relative metabolite concentrations in tumour versus normal tissue. Select key metabolites are chosen based on their high informational gain for the tumour/normal discrimination and/or their identification in the decision tree analysis. Boxplots show median, 25th and 75th percentiles, range, and extreme values. For better illustration a logarithmic scale was chosen for the relative concentration; absolute concentrations cannot be calculated and therefore no precise scale is given.
Table 3.
Metabolites with relative concentration differences in localized and metastasized RCC samples
| Compound | Median fold change | P-value | Pathway |
|---|---|---|---|
| Uracil | 1.9 | <0.0007 | Pyrimidine metabolism |
| Arachidonic acid | 1.9 | 0.007 | Arachidonic acid metabolism (involved in VEGF signalling pathway and angiogenesis) |
| Erythritol | 1.7 | 0.002 | Glycerolipid metabolism |
| 3-Phospho-glycerate | 1.9 | 0.005 | |
| Heptadecanoic acid | 1.5 | 0.001 | Fatty acid metabolism |
| Hexadecanoic acid | 1.3 | 0.008 | |
| Tetradecanoic acid | 1.4 | 0.01 | |
| Isoleucine | 2.9 | 0.008 | Valine, leucine and isoleucine meatbolism |
| Phenylalanine | 2.4 | 0.003 | Phenylalanine metabolism |
| Proline | 2.5 | 0.006 | Arginine and Proline metabolism |
A P-value of <0.0007 indicates a significant difference upon Bonferroni correction for multiple testing.
Independent validation of the RCC metabolic signature
Despite the reduced statistical power in this smaller second dataset, we repeated pairwise comparisons of relative concentrations of known and interpretable metabolites to validate the findings of the first dataset (Table 2). As expected due to the smaller sample size, significant differences were seen in fewer metabolites in the second dataset. However, all differences observed in the first dataset were confirmed when the tests were repeated in the combined first and second dataset (Table 2). Key metabolites in both datasets were a-tocopherol, hippuric acid and myoinositol thus underlining the notion that these are of importance for the metabolic signature of RCC. The comparatively low number of metastasized samples (n= 7) in the second dataset hampered the validation of metabolic differences between these and non-metastasized tumours. Pairwise comparisons in the combined dataset however, confirmed uracil as a key metabolite in distinguishing metastasized and localized tumours. This metabolite is of relevance for the synthesis of nucleic acids and may indicate a metabolic adaptation to the increased transcriptional activity in aggressive, potentially lethal tumours. The increased fatty acid content adds weight to the theory that fatty acid degradation is reduced in tumour cells, but this may be particularly pronounced in aggressive metastasized tumours. The exploratory analysis revealed some other putative metabolites which characterize metastasized disease, such as myoinositol, arachidonic acid and several amino acids (isoleucine, phenylalanine and proline), but these findings require confirmation in independent datasets as false positive test results cannot be fully excluded. When differences in relative concentrations for key metabolites, i.e. a-tocopherol, hippuric acid, glucose-1-phosphate, myoinositol and succinic acid, by tumour stage (pT1–2 versus pT3) were explored α-tocopherol was increased in pT3 tumours (P< 0.05). No differences were observed by tumour grade (G1–2 versus G3). The ADTree models performed insufficiently when tumour stage and grade were studied as classifiers. The results were indicative of α-tocopherol, free fatty acids and uracil contributing to the metabolic signature of advanced (pT3) as compared to smaller tumours (pT1–2).
In addition we tested whether metabolites of the ADTree classifying metastasized tumours were associated with the outcome of RCC patients using univariate and multivariate Cox models. Only citric acid was independently related to recurrence-free survival (data not shown). Decreased citric acid concentrations could conceivably indicate a deteriorating prognosis and although this finding is in line with a switch towards increased glycolysis even under aerobic conditions and therefore seems plausible, the data are purely exploratory and, in view of the multiple testing problem, require confirmation.
Discussion
This study characterizes the metabolite pool of RCC as compared to control renal cortex tissue using non-targeted metabolic profiling and permitted the assignment of a specific metabolic signature to RCC. This signature was not only validated with common test procedures, but was also confirmed in an independent, subsequently compiled validation dataset. Thus a set of key metabolites representing relevant metabolic pathways of RCC was established. Our data together with a previous study [12] substantially extend the knowledge on the small molecule component of RCC tissue. These findings complement earlier studies on biomarker discovery in RCC using ‘omics’ platforms [13–15].
As the metabolomics methodology used in this study captures a large part of primary metabolism, our study for the first time gives a comprehensive overview of the metabolic phenotype of RCC tissue. This phenotype confirms presumed metabolic features of cancer cells in general and RCC in particular. The marked differential concentration of glucose 1-phosphate and metabolites of the tricarboxylic acid (TCA) cycle, such as succinate and malate, points to a pivotal role of altered glucose and energy metabolism in RCC. Remarkably, most substrates of the TCA cycle seemed to be notably down-regulated in RCC compared to control tissue. Since the TCA pathway is a catabolic pathway of aerobic respiration our findings may reflect the shift towards an anaerobic energy metabolism and reduced respiration even in the presence of oxygen, also referred to as aerobic glycolysis or as the Warburg effect [16]. Indeed, recent studies suggest that the up-regulation of hypoxia-inducible factors (HIF) mediates the reprogramming of glucose and energy metabolism including increased glycolysis and lactate production in renal cancer cells [17, 18]. Using a combination of transcriptomics and proteomics it has been recently confirmed that genes and proteins involved in cellular metabolism play a crucial part in the development and progression of RCC making them promising candidates for biomarker identification [15].
To compensate for their high energy demands, cancer cells are likely to exploit a multitude of energy sources including fatty acid oxidation and other non-glycolytic pathways [19, 20]. According to our findings, metabolites of fatty acid metabolism seem to play a key part in RCC metabolism. A number of fatty acids were found to be differentially concentrated, but uniformly down-regulated in RCC. This finding may be the consequence of increased fatty acid oxidation, which has also been described in other cancer types, in particular prostate cancer [21, 22]. Studies identifying fatty acid binding proteins (FABP) [23, 24] and fatty acid synthase [25] as tumour markers of RCC underline the importance of fatty acid metabolism in the biology of RCC. Interestingly, in our study up-regulation of fatty acid concentration seemed to be specifically associated with metastatic disease. This fact may indicate that an increase in de-novo fatty acid synthesis or increased fatty acid uptake and reduced mitochondrial β-oxidation of fatty acids may be rather late events in the progression of RCC to an invasive and metastasized phenotype. Indeed, the lipogenic phenotype has been linked to advanced and metastatic cancers [26], and the full pattern of metabolic reprogramming may be associated with advanced tumour progression. Our findings in metastasizing RCC, in particular the accumulation of fatty acids, glycerolipid compounds and TCA cycle intermediates such as succinate, are in line with the hypothesis that mitochondrial dysfunction has a role in tumour cell metastasis [27, 28].
Another remarkable finding was the profound up-regulation of α-tocopherol concentration in RCC and despite previous allusions to such an elevated vitamin E concentration [29, 30] this finding has as yet not received particular attention. Among all metabolites investigated in our study, α-tocopherol emerged as the most important classifier of normal versus tumorous tissue and therefore underlines the putative importance of vitamin E in RCC biology. The elevated concentration of vitamin E in RCC cells may just be an epiphenomenon und indicate an increased uptake of lipids and fatty acids through the up-regulation of rather unspecific transfer proteins, lipases or lipoprotein receptors [31]. The increased concentration of α-tocopherol has previously been observed in ovarian carcinomas by using similar metabolomics methodology and interpreted as an unspecific stress response [4]. As a potential alternative explanation, elevated vitamin E may indeed play a functional role and render the tumour cell resistant to increased oxidative stress toxic to surrounding normal cell populations. Vitamin E and α-tocopherol in particular, is a potent, lipid-soluble, chain-breaking antioxidant and additional vitamin E has been shown to prevent mitochondrial dysfunction in the presence of severe oxidative stress [32]. However, the specific role of vitamin E is likely not limited to its antioxidant function, but can rather be extended to α-tocopherol serving as a transcriptional regulator of gene expression [33]. Results which point to the importance of α-tocopherol would seem to indicate that further studies are justified to clarify the phenomenon of tocopherol elevation in RCC, which may ultimately be exploited for establishing novel therapeutic targeting strategies [19]. Differentially regulated metabolites may also include intracellular signalling molecules, as indicated by the fact that myoinositol was one of the key metabolites identified in our study. This compound belongs to the inositol polyphosphate family of small cytosolic molecules involved in the control of a wide range of cellular processes [34]. Its down-regulation has also been described in prostate cancer [35].
In our exploratory analysis of the metabolic signature of metastatic tumours, intermediates of glucose metabolism, such as succinate and glucose, proved to be key classifiers. These findings are in line with the recent observation that the metastatic progression of RCC is associated with a shift toward non-oxidative glucose metabolism through the pentose phosphate pathway [36]. In our study, the metabolic profile of metastasized tumours could not be thoroughly validated as the number of metastasized tumours was restrictive in the test dataset. Nonetheless, it is worth mentioning that the concentration of arachidonic acid was elevated in metastasized tumours, whereas the concentration in RCC in general was lower than in normal renal tissue. The increase of arachidonic acid in aggressive metastasized tumours seems plausible, as this pro-inflammatory fatty acid has been linked to the VEGF-signalling pathway and tumour angiogenesis. Further, the activation of the inflammatory cascade may indeed increase the metastatic potential of RCC through dysregulation of the immune response in the tumour microenvironment. In this context, the observed elevation of proline levels in tumour tissue can be explained by the degradation of collagen in the microenvironmental extracellular matrix promoting invasive tumour growth [37]. The reduced proline oxidase expression, as described in RCC cell lines [38], would be an alternative explanation. Altogether, the findings in metastatic RCC merit further studies.
References
- 1.Gillies RJ, Gatenby RA. Hypoxia and adaptive landscapes in the evolution of carcinogenesis. Cancer Metastasis Rev. 2007;26:311–7. doi: 10.1007/s10555-007-9065-z. [DOI] [PubMed] [Google Scholar]
- 2.Pelicano H, Martin DS, Xu RH, et al. Glycolysis inhibition for anticancer treatment. Oncogene. 2006;25:4633–46. doi: 10.1038/sj.onc.1209597. [DOI] [PubMed] [Google Scholar]
- 3.Barba I, Fernandez-Montesinos R, Garcia-Dorado D, et al. Alzheimer’s disease beyond the genomic era: nuclear magnetic resonance (NMR) spectroscopy-based metabolomics. J Cell Mol Med. 2008;12:1477–85. doi: 10.1111/j.1582-4934.2008.00385.x. [DOI] [PMC free article] [PubMed] [Google Scholar]
- 4.Denkert C, Budczies J, Kind T, et al. Mass spectrometry-based metabolic profiling reveals different metabolite patterns in invasive ovarian carcinomas and ovarian borderline tumors. Cancer Res. 2006;66:10795–804. doi: 10.1158/0008-5472.CAN-06-0755. [DOI] [PubMed] [Google Scholar]
- 5.Fiehn O, Kind T. Metabolite profiling in blood plasma. Methods Mol Biol. 2007;358:3–17. doi: 10.1007/978-1-59745-244-1_1. [DOI] [PubMed] [Google Scholar]
- 6.Schlotterbeck G, Ross A, Dieterle F, et al. Metabolic profiling technologies for biomarker discovery in biomedicine and drug development. Pharmacogenomics. 2006;7:1055–75. doi: 10.2217/14622416.7.7.1055. [DOI] [PubMed] [Google Scholar]
- 7.Wikoff WR, Pendyala G, Siuzdak G, et al. Metabolomic analysis of the cerebrospinal fluid reveals changes in phospholipase expression in the CNS of SIV-infected macaques. J Clin Invest. 2008;118:2661–9. doi: 10.1172/JCI34138. [DOI] [PMC free article] [PubMed] [Google Scholar]
- 8.Schnackenberg LK, Beger RD. Monitoring the health to disease continuum with global metabolic profiling and systems biology. Pharmacogenomics. 2006;7:1077–86. doi: 10.2217/14622416.7.7.1077. [DOI] [PubMed] [Google Scholar]
- 9.Lisec J, Schauer N, Kopka J, et al. Gas chromatography mass spectrometry-based metabolite profiling in plants. Nat Protoc. 2006;1:387–96. doi: 10.1038/nprot.2006.59. [DOI] [PubMed] [Google Scholar]
- 10.Stacklies W, Redestig H, Scholz M, et al. pcaMethods–a bioconductor package providing PCA methods for incomplete data. Bioinformatics. 2007;23:1164–7. doi: 10.1093/bioinformatics/btm069. [DOI] [PubMed] [Google Scholar]
- 11.Witten IH, Eibe F. Data mining: practical machine learning tools and techniques. 2nd ed. San Francisco: Morgan Kaufmann; 2005. [Google Scholar]
- 12.Jung M, Mollenkopf HJ, Grimm C, et al. MicroRNA profiling of clear cell renal cell cancer identifies a robust signature to define renal malignancy. J Cell Mol Med. 2009 doi: 10.1111/j.1582-4934.2009.00705.x. [DOI] [PMC free article] [PubMed] [Google Scholar]
- 13.Gao H, Dong B, Liu X, et al. Metabonomic profiling of renal cell carcinoma: high-resolution proton nuclear magnetic resonance spectroscopy of human serum with multivariate data analysis. Anal Chim Acta. 2008;624:269–77. doi: 10.1016/j.aca.2008.06.051. [DOI] [PubMed] [Google Scholar]
- 14.Kim K, Aronov P, Zakharkin SO, et al. Urine metabolomics analysis for kidney cancer detection and biomarker discovery. Mol Cell Proteomics. 2009;8:558–70. doi: 10.1074/mcp.M800165-MCP200. [DOI] [PMC free article] [PubMed] [Google Scholar]
- 15.Seliger B, Dressler SP, Wang E, et al. Combined analysis of transcriptome and proteome data as a tool for the identification of candidate biomarkers in renal cell carcinoma. Proteomics. 2009;9:1567–81. doi: 10.1002/pmic.200700288. [DOI] [PMC free article] [PubMed] [Google Scholar]
- 16.Kim JW, Dang CV. Cancer’s molecular sweet tooth and the Warburg effect. Cancer Res. 2006;66:8927–30. doi: 10.1158/0008-5472.CAN-06-1501. [DOI] [PubMed] [Google Scholar]
- 17.Semenza GL. HIF-1 mediates the Warburg effect in clear cell renal carcinoma. J Bioenerg Biomembr. 2007;39:231–4. doi: 10.1007/s10863-007-9081-2. [DOI] [PubMed] [Google Scholar]
- 18.Zhang H, Gao P, Fukuda R, et al. HIF-1 inhibits mitochondrial biogenesis and cellular respiration in VHL-deficient renal cell carcinoma by repression of C-MYC activity. Cancer Cell. 2007;11:407–20. doi: 10.1016/j.ccr.2007.04.001. [DOI] [PubMed] [Google Scholar]
- 19.Pan JG, Mak TW. Metabolic targeting as an anticancer strategy: dawn of a new era? Sci STKE. 2007;2007:pe14. doi: 10.1126/stke.3812007pe14. [DOI] [PubMed] [Google Scholar]
- 20.Buzzai M, Bauer DE, Jones RG, et al. The glucose dependence of Akt-transformed cells can be reversed by pharmacologic activation of fatty acid beta-oxidation. Oncogene. 2005;24:4165–73. doi: 10.1038/sj.onc.1208622. [DOI] [PubMed] [Google Scholar]
- 21.Liu Y. Fatty acid oxidation is a dominant bioenergetic pathway in prostate cancer. Prostate Cancer Prostatic Dis. 2006;9:230–4. doi: 10.1038/sj.pcan.4500879. [DOI] [PubMed] [Google Scholar]
- 22.Zha S, Ferdinandusse S, Hicks JL, et al. Peroxisomal branched chain fatty acid beta-oxidation pathway is upregulated in prostate cancer. Prostate. 2005;63:316–23. doi: 10.1002/pros.20177. [DOI] [PubMed] [Google Scholar]
- 23.Seliger B, Lichtenfels R, Atkins D, et al. Identification of fatty acid binding proteins as markers associated with the initiation and/or progression of renal cell carcinoma. Proteomics. 2005;5:2631–40. doi: 10.1002/pmic.200401264. [DOI] [PubMed] [Google Scholar]
- 24.Teratani T, Domoto T, Kuriki K, et al. Detection of transcript for brain-type fatty Acid-binding protein in tumor and urine of patients with renal cell carcinoma. Urology. 2007;69:236–40. doi: 10.1016/j.urology.2006.09.060. [DOI] [PubMed] [Google Scholar]
- 25.Horiguchi A, Asano T, Ito K, et al. Fatty acid synthase over expression is an indicator of tumor aggressiveness and poor prognosis in renal cell carcinoma. J Urol. 2008;180:1137–40. doi: 10.1016/j.juro.2008.04.135. [DOI] [PubMed] [Google Scholar]
- 26.Menendez JA, Lupu R. Fatty acid synthase and the lipogenic phenotype in cancer pathogenesis. Nat Rev Cancer. 2007;7:763–77. doi: 10.1038/nrc2222. [DOI] [PubMed] [Google Scholar]
- 27.Ishikawa K, Takenaga K, Akimoto M, et al. ROS-generating mitochondrial DNA mutations can regulate tumor cell metastasis. Science. 2008;320:661–4. doi: 10.1126/science.1156906. [DOI] [PubMed] [Google Scholar]
- 28.Lopez-Rios F, Sanchez-Arago M, Garcia-Garcia E, et al. Loss of the mitochondrial bioenergetic capacity underlies the glucose avidity of carcinomas. Cancer Res. 2007;67:9013–7. doi: 10.1158/0008-5472.CAN-07-1678. [DOI] [PubMed] [Google Scholar]
- 29.Tosi MR, Rodriguez-Estrada MT, Lercker G, et al. Magnetic resonance spectroscopy and chromatographic methods identify altered lipid composition in human renal neoplasms. Int J Mol Med. 2004;14:93–100. doi: 10.3892/ijmm.14.1.93. [DOI] [PubMed] [Google Scholar]
- 30.Nikiforova NV, Kirpatovsky VI, Darenkov AF, et al. Liposoluble vitamins E and A in human renal cortex and renal cell carcinomas. Nephron. 1995;69:449–53. doi: 10.1159/000188518. [DOI] [PubMed] [Google Scholar]
- 31.Mardones P, Rigotti A. Cellular mechanisms of vitamin E uptake: relevance in alpha-tocopherol metabolism and potential implications for disease. J Nutr Biochem. 2004;15:252–60. doi: 10.1016/j.jnutbio.2004.02.006. [DOI] [PubMed] [Google Scholar]
- 32.Ham AJ, Liebler DC. Antioxidant reactions of vitamin E in the perfused rat liver: product distribution and effect of dietary vitamin E supplementation. Arch Biochem Biophys. 1997;339:157–64. doi: 10.1006/abbi.1996.9856. [DOI] [PubMed] [Google Scholar]
- 33.Azzi A, Gysin R, Kempna P, et al. Regulation of gene expression by alpha-tocopherol. Biol Chem. 2004;385:585–91. doi: 10.1515/BC.2004.072. [DOI] [PubMed] [Google Scholar]
- 34.Burton A, Hu X, Saiardi A. Are inositol pyrophosphates signalling molecules? J Cell Physiol. 2009;220:8–15. doi: 10.1002/jcp.21763. [DOI] [PubMed] [Google Scholar]
- 35.Serkova NJ, Gamito EJ, Jones RH, et al. The metabolites citrate, myo-inositol, and spermine are potential age-independent markers of prostate cancer in human expressed prostatic secretions. Prostate. 2008;68:620–8. doi: 10.1002/pros.20727. [DOI] [PubMed] [Google Scholar]
- 36.Langbein S, Frederiks WM, zur Hausen A, et al. Metastasis is promoted by a bioenergetic switch: new targets for progressive renal cell cancer. Int J Cancer. 2008;122:2422–8. doi: 10.1002/ijc.23403. [DOI] [PubMed] [Google Scholar]
- 37.Phang JM, Donald SP, Pandhare J, et al. The metabolism of proline, a stress substrate, modulates carcinogenic pathways. Amino Acids. 2008;35:681–90. doi: 10.1007/s00726-008-0063-4. [DOI] [PubMed] [Google Scholar]
- 38.Maxwell SA, Rivera A. Proline oxidase induces apoptosis in tumor cells, and its expression is frequently absent or reduced in renal carcinomas. J Biol Chem. 2003;278:9784–9. doi: 10.1074/jbc.M210012200. [DOI] [PubMed] [Google Scholar]