

Abstract
The potential use of human mesenchymal stem cells for therapeutic applications implies large scale in vitro culture, increasing the probability of genetic instability and transformation. We examine here the incidence of unbalanced and balanced chromosome rearrangements in polyclonal and single cell-derived cultures of human adipose stem cells to senescence. G-banding karyotyping of the polyclonal cultures shows a normal karyotype. In addition, high-resolution microarray-based comparative genomic hybridization analyses relative to uncultured adipose stem cells from the same donors reveal overall genomic stability in long-term (∼6 months) polyclonal and clonal culture. One adipose stem cell clone displayed minor deletions in gene-rich telomeric and sub-telomeric regions on three chromosomes in early passage. This however, was detected only in a sub-population of cells that was subsequently spontaneously eliminated from the culture. Apparent pericentromeric instabilities are also occasionally detected in specific chromosomes. Our results indicate that clonal chromosomal aberrations may arise transiently in early passage adipose stem cells (ASC) cultures. Nonetheless, incidence of these aberrations seems to be negligible in the majority of long-term ASC cultures, at least under the culture conditions used here.
Keywords: adipose stem cell, cell culture, comparative genomic hybridization, mesenchymal stem cell, senescence
Introduction
Mesenchymal stem cells (MSCs) have in past years received much attention owing to their apparent usefulness as multi-potent replacement cells for regenerative medicine. MSCs undergo self-renewing divisions and may give rise to one or more differentiated cell types. Bone marrow (BM)-derived MSCs can differentiate into primarily mesodermal lineages [1] although a small sub-population may exhibit more extensive differentiation capacity [2]. Stem cells of stromal origin can also be obtained from liposuction material [3]. These cells display multi-lineage differentiation potential in culture [3, 4] and in vivo have been claimed to improve osteogenic [5], hepatic [6], endothelial [7], neuronal [8] and immune [9] functions (reviewed in [10]).
We have reported the purification and characterization of adipose stem cells (ASCs) with a CD45−CD31−CD34+CD105+ immunophenotype from the stromal vascular fraction of human adipose tissue [11]. These ASCs are quiescent but enter the cell cycle upon culture, with a doubling time of ∼60 hrs. They can be expanded clonally, and can differentiate into several mesodermal lineages [11]. As any primary cell types however, MSCs from adipose tissue reach a senescence phase in culture after ∼30 or more population doublings [3]. What determines the number of passages to senescence is unclear, but it presumably entails the exact characteristic of the cells isolated, variability between donors, and primarily culture conditions. Furthermore, when cultured as described here, in medium supplemented with foetal bovine serum (FBS), human ASCs maintain at lineage specific promoters a DNA methylation profile similar to that of freshly isolated cells, reflecting the epigenetic stability of these cells in culture, at least at these loci [12].
Because they can be collected in large numbers (up to 5 × 10⁶ ASCs per 100 ml of liposuction material), ASCs constitute an attractive source of multi-potent cells for therapeutic use. Nevertheless, obtaining compatible MSC numbers is likely to require large-scale in vitro expansion, increasing the probability of genetic instability and spontaneous transformation. Spontaneous transformation in vitro appears to be a property of mouse MSCs. Both pre-senescence and post-senescence cultures of murine BM-MSCs spontaneously accumulate various chromosome abnormalities and transform into malignant cells when injected into immuno-compromised or lethally irradiated mice [13, 14]. Transformation of human MSCs, in contrast, is a rare event. One report to date shows that human adipose tissue-derived MSCs can spontaneously transform in vitro[15]. Transformation occurs only after cells escape senescence, in association with chromosome re-arrangements and changes in ploidy [15]. The majority of human MSC cultures, however, seem to remain stable. Pre-senescence culture of human adipose tissue-derived MSCs [15], BM-MSCs [13, 16], perion-dotal ligament stem cells and dental pulp stem cells [13] exhibit relatively slow growth rates and normal karyotypes, suggesting that human MSCs even at a late stage of their normal lifespan can maintain a normal cytogenetic profile. Nevertheless, none of these studies provide indications of unbalanced chromosome re-arrangements that would not be detected in karyotypes. To address this issue, we examine here the incidence of unbalanced (DNA gains or losses) and balanced (inversions, translocations) chromosome rearrangements in polyclonal and single cell-derived cultures of human ASCs to senescence, using G-banding karyotyping and microarray-based comparative genomic hybridization (array CGH) analyses.
Materials and methods
Isolation and culture of adipose stem cells
Adipose stem cells with a CD45−CD31−CD34+-CD105+ phenotype were isolated from the stromal vascular fraction recovered from liposuction material as described earlier [12]. Briefly, lipoaspirates from the hip/thigh regions of three women donors aged 24–40 were digested with colla-genase and DNase I and adipocytes separated from stromal vascular cells by floatation at 400 ×g. After lysis of erythrocytes, stromal cells were strained through 100-μm and 40-μm cell sieves. ASCs were isolated by double negative selection against CD45 followed by double negative selection against the endothelial marker CD31 using magnetic beads coupled to anti-CD45 and anti-CD31 antibodies. Flow cytometry analysis of the purified CD31− cells confirmed the high purity ≥98%) of the population [17]. Aliquots of CD31− cells were cultured or directly frozen in liquid nitrogen for DNA isolation. The CD31− cells isolated as described have been shown to be CD34+ and CD105+[11]. Cells were expanded in DMEM/F12 containing 20% FBS (Sigma-Aldrich), in 175 cm2 flasks (Nunc). For each passage, cells were sub-cultured when reaching 50% confluency after a 1:3–1:4 dilution every 4th day. Polyclonal ASC cultures used here (one from each donor) are referred to as polyclonal culture (Pc)1, Pc2 and Pc3.
Single cell-derived clones of ASCs were generated as described earlier [11]. Single freshly isolated CD31_ cells were cultured in each well of 48-well plates in DMEM/F12 medium containing 50% FBS and antibiotics. After ∼16 hrs, the medium was replaced by DMEM/F12 and 20% FBS. After 3 weeks, colonies containing over 100 cells were passaged by trypsinization and expanded. Typically, 5–10% of single plated cells give rise to cell lines capable of expansion. Cells were expanded first in 25 cm2 flasks, then as described for polyclones. Three clonal ASC lines were examined in this study. Each (designated B1, B2 and B3) has been characterized previously in terms of adipogenic and endothelial differentiation capacity in vitro, in relation to promoter DNA methylation [12, 17].
DNA isolation and amplification
DNA was purified by double phenol-chloroform-isoamylalcohol extraction and one chloroform-isoamylalcohol extraction after cell lysis for 10 min in lysis buffer (10 mM Tris-HCl, pH 8, 100 mM ethylenediaminetetraacetic acid [EDTA], 0.5% SDS) and digestion with 0.1 mg/ml Proteinase K overnight. DNA was diluted to 250 ng/μl in nuclease-free H2O, and assessed for quality and integrity by 1% agarose gel electrophoresis. DNA concentration was measured using Picogreen fluorometric measurement (Invitrogen). Genomic DNA was amplified using the Qiagen REPLI-g Mini kit as described by the manufacturer. In brief, ∼20 ng of genomic DNA was denatured and subjected to isothermal amplification for 16 hrs at 30 °C. DNA amplification was confirmed by 1% agarose gel electrophoresis. Amplified DNA was cleaned up using the QIAmp DNA micro kit from Qiagen. Final DNA concentration was determined by Picogreen fluorometric measurement.
Comparative genomic hybridization and analysis
Samples were hybridized onto NimbleGen high-density long oligonucleotide microarrays containing 385,000 isothermal probes spanning non-repetitive genic and intergenic regions of the human genome at a median probe spacing of 6000 bp (<url>www.nimblegen.com</url>; HG18_WG_CGH array). Samples were labeled with Cy5. For each hybridization, DNA isolated from freshly isolated, uncultured ASCs purified from the same donors from whom cultures were established was labelled with Cy3 and used as reference sample, ruling out any putative copy number variation between donors. Test and reference samples were co-hybridized onto arrays and scanned using the NimblenGen hybridization service.
After combining signal intensity information with genomic coordinates, Cy3 and Cy5 signal intensities were normalized using qspline normalization [18]. After normalization, data were prepared for segmentation using an averaging step, where probes falling into a defined base pair window size are averaged using a Tukey biweight mean [19]. Window sizes of 60, 120 and 300 kb were used. Data segmentation was performed using a binary segmentation algorithm [20]. This algorithm attempts to break DNA segments into sub-segments by determining the t statistics the means. We have used 1000 permutations and a P-value of 0.01 to call breakpoints. DNA copy number changes were scored as aberrant when they contained a segmentation value of at least 0.25 in log2 scale for gains and below −0.25 for losses. In addition, to qualify as aberrant, DNA copy number segments must contain at least 10 consecutive oligonucleotides using raw normalized data, and aberrations must be seen in at least two segmentation windows.
Karyotyping
Polyclonal ASC cultures from each donor at passages 11–13 were subjected to cytogenetic analysis using standard chromosome G-banding techniques. Subsequent cytogenetic analysis and karyotype description of at least 25 metaphases were done according to recommendations from the International System for Human Cytogenetic Nomenclature [21].
Results
Polyclonal and clonal culture of adipose stem cells to senescence
We have established polyclonal cultures (termed Pc1, Pc2 and Pc3) of CD45−CD31−CD34+CD105+ ASCs isolated from three female donors. Cells were harvested at early passage (passage 5; P5) and at senescence, which was reached at P15 (Pc1), P20 (Pc2) and P23 (Pc3), respectively. Three clonal lines of ASCs, clones B1, B2 and B3, were also established from single, freshly isolated cells. Senescence in these clones occurred at P18 (clone B1), P16 (clone B2) and P17 (clone B3). Both in polyclonal and clonal cultures, senescence was manifested by cell cycle arrest and by typical enlarged flattened cell morphology (Fig. 1A). After they reached senescence, cells were cultured for another 2 weeks (clonal cultures) and for 3–7 weeks (polyclones), during which cell death gradually occurred. Thus, in both polyclonal and clonal ASC cultures, no sign of cells bypassing senescence-associated crisis [15] was detected.
1.
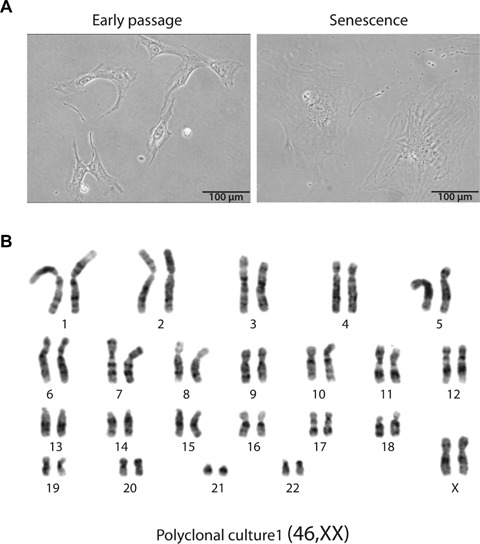
Karyotyping analysis of adipose stem cells. (A) Morphology of polyclonal ASCs in early passage (P1) and at senescence. Bars, 100 μm. (B) G-banding karyotyping of cells from polyclonal culture 1 (Pc1). The karyotype is normal. Karyotypes of ASCs in Pc2 and Pc3 cultures are shown in Supplementary Fig. S1A and S1B.
Genetic analysis of polyclonal adipose stem cell cultures
We have analyzed by G-banding the karyotype of each polyclonal ASC culture at passages 11–13. Figure 1B illustrates the karyotype of Pc1, which exhibits normal chromosome number and structure at passage 12 (46, XX). Karyotypes of ASCs in Pc2 and Pc3 were also normal (46, XX;Supplementary Fig. S1).
To investigate at higher resolution possible gains or losses of DNA, ASCs from all three polyclonal cultures in early passage (P5) and at senescence (P15–P23) were analyzed by array CGH using a 385,000 oligonucleotide NimbleGen microarray. All, but two samples showed normal DNA copy number genome-wide in early and senescent cultures (Fig. 2A and B; see Supplementary Table S1 for a reference to the DNA profile of all chromosomes at P5 and P20, ID 94334 and 94138, respectively). Two poly-clones (Pc1 and Pc3) showed minor apparent gains in the pericentromeric region of several chromosomes at P5 (chromosomes 7 and 19 for Pc1, and 7, 8, 10, 11, 12, 19 and X for Pc3, Fig. 3A; Supplementary Table S1, ID 86298 and ID 94179, respectively). These pericentromeric segments contained no or very few annotated genes (Table 1). In both of these cultures these gains were no longer detected at senescence (Supplementary Table S1, ID 94336 [Pc1] and ID 94884 [Pc3]). The list of scored alterations (expressed as log2 ratios), location, size and number of genes included in the gained chromosome segments is reported in Table 1. These observations indicate that two out of three polyclonal ASC cultures showed, in early passage, minor apparent pericentromeric DNA gains in a subset of chromosomes, in particular chromosomes 7 and 19. However, all cultures exhibited a normal DNA content when they reached senescence. It should be noted that such signals may arise from incomplete blocking of low copy number repeats in the pericen-tromeric regions of specific chromosomes.
2.
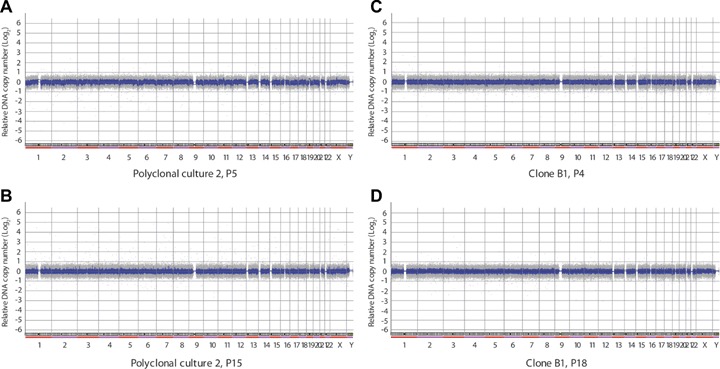
Array CGH profile of polyclonal and clonal cultures of adipose stem cells. (A, B) Polyclonal culture Pc2 at P5 (A) and P20 (B). (C, D) ASC clone B1 at (C) P4 and (D) P18. For a chromosome by chromosome analysis, see Supplementary Table 1, ID 94334, 94138, 94131 and 100285, respectively. Normalized log2 ratio for each oligonu-cleotide is plotted in grey and a moving average of 9 clones in blue.
3.

Array CGH profile by chromosome. (A) Polyclonal ASC culture Pc3 at P5. See Supplementary Table S1, ID 94179, for a profiling of all chromosomes. (B) ASC clone B2 at P16.(See Supplementary Table S1, ID 104792, for a profiling of all chromosomes).Arrowheads point to genomic duplications. Normalized log2 ratio using a window size of 60 Kb is plotted in black and its segmentation drawn in red.
1.
Summary of array CGH analysis of polyclonal and clonal adipose stem cell cultures to senescence
| Sample | NimbleGen ID No.a | Chromosome affected | Position start of gain or loss (kb) | Position end of gain or loss (kb) | Fragment size (kb) | log2 ratiob | No. genes | |||||||||||||||||||||||||
|---|---|---|---|---|---|---|---|---|---|---|---|---|---|---|---|---|---|---|---|---|---|---|---|---|---|---|---|---|---|---|---|---|
| Polyclonal cultures | ||||||||||||||||||||||||||||||||
| Pc1, P5 | 86298 | 7 | 57990 | 62010 | 4020 | 0.362 | 1c | |||||||||||||||||||||||||
| 19 | 24210 | 32790 | 8580 | 0.367 | 0 | |||||||||||||||||||||||||||
| Pc1, P15 | 94336 | - | - | - | - | - | - | |||||||||||||||||||||||||
| Pc2, P5 | 94334 | - | - | - | - | - | - | |||||||||||||||||||||||||
| Pc2, P20 | 94138 | - | - | - | - | - | - | |||||||||||||||||||||||||
| Pc3, P5 | 94179 | 7 | 61110 | 62070 | 960 | 0.787 | 0 | |||||||||||||||||||||||||
| 8 | 43590 | 47010 | 3420 | 0.699 | 0 | |||||||||||||||||||||||||||
| 10 | 38790 | 41850 | 9060 | 0.652 | 5d | |||||||||||||||||||||||||||
| 11 | 50310 | 54750 | 4440 | 0.556 | 4e | |||||||||||||||||||||||||||
| 12 | 36330 | 36750 | 420 | 0.534 | 0 | |||||||||||||||||||||||||||
| 19 | 24210 | 32790 | 8580 | 0.595 | 0 | |||||||||||||||||||||||||||
| X | 58350 | 61950 | 3600 | 0.633 | 0 | |||||||||||||||||||||||||||
| Pc3, P23 | 94884 | - | - | - | - | - | - | |||||||||||||||||||||||||
| Clonal cultures | ||||||||||||||||||||||||||||||||
| Clone B1, P4 | 94131 | - | - | - | - | - | - | |||||||||||||||||||||||||
| Clone B1, P18 | 100285 | - | - | - | - | - | - | |||||||||||||||||||||||||
| Clone B2, P5 | 94578 | - | - | - | - | - | - | |||||||||||||||||||||||||
| Clone B2, P16 | 104792 | 5 | 45990 | 49530 | 3540 | 0.467 | 0 | |||||||||||||||||||||||||
| 7 | 61290 | 62010 | 720 | 0.623 | 0 | |||||||||||||||||||||||||||
| 8 | 43590 | 43890 | 300 | 0.405 | 0 | |||||||||||||||||||||||||||
| 10 | 38850 | 42150 | 3300 | 0.351 | 0 | |||||||||||||||||||||||||||
| 11 | 50310 | 54750 | 4440 | 0.450 | 4e | |||||||||||||||||||||||||||
| 12 | 36330 | 36690 | 360 | 0.559 | 0 | |||||||||||||||||||||||||||
| 19 | 24210 | 32790 | 8580 | 0.552 | 0 | |||||||||||||||||||||||||||
| X | 58410 | 62070 | 3600 | 0.464 | 0 | |||||||||||||||||||||||||||
| Clone B3, P7 | 94181 | 1p36.33–36.32 | 660 | 3900 | 3240 | −0.325 | 95f | |||||||||||||||||||||||||
| 14q32.33 | 103620 | 105420 | 1800 | −0.291 | 41f | |||||||||||||||||||||||||||
| 20q13.33 | 59580 | 62333 | 2753 | −0.278 | 87f | |||||||||||||||||||||||||||
| Clone B3, P17 | 94576 | - | - | - | - | - | - | |||||||||||||||||||||||||
ID No.may be used to locate the data for all chromosomes in Supplementary Table S1.
A positive log2 value indicates a DNA gain, a negative log2 value indicates a loss.
One novel predicted gene.
Five novel predicted genes.
OR4A5, OR4A4, OR4C46 and one novel predicted gene.
Annotated genes (89 on 1p36.33–36.32, 35 14q32.33 on and 84 20q13.33) are listed in Table 2. Novel predicted genes are not included in the list.
Genetic analysis of clonal adipose stem cell cultures
Similarly to polyclonal cultures, high-resolution DNA copy number analysis was performed on three clonal ASC cultures at early passage and upon senescence (P16–18). Clone B1 showed normal DNA copy number genome-wide both in early passage (P4) and at senescence (Fig. 2C and D; Supplementary Table S1;ID 94131 and 100285). Interestingly, clone B2 displayed at senescence, but not in early passage (P5), a similar selection of apparent DNA gains as the polyclonal culture from donor 3, with in addition a pericentromeric gain on chromosome 5 (Table 1; Fig.3B; Supplementary Table S1, ID 94578 [P4] and ID 104792 [P16]). Again, the gained segments contained no or a low number of genes (Table 1).
Clone B3 was the only one showing a loss of DNA material in early passage (P7), on the basis of three deleted segments in regions 1p36.33–36.32, 14q32.33 and 20q13.33 (Fig. 4A; Table 1; Supplementary Table S1, ID 94181). All of these segments contained a larger number of annotated genes (89, 35 and 84, respectively;listed in Table 2), as well as a few novel genes (6, 6 and 3, respectively). The log2 ratio of the lost segments (Table 1) argues that only a small fraction of the cell population contained these alterations. Furthermore, none of the deletions were observed in the late culture (Table 1; Fig. 4B; Supplementary Table S1; ID 94576), arguing that they were deleterious and resulted in the loss of this sub-population of cells upon culture beyond P7. DNA copy number profiles of all polyclonal and clonal ASC cultures are shown in Supplementary Table S1 (see Table 1 and Supplementary Table S1 for clone ID). Collectively, these observations indicate that genic regions in clonal ASC cultures are also overall genetically stable. The deletions observed affected a minor proportion of cells which, in the cultures tested, were spontaneously eliminated beyond P7.
4.

Array CGH profile. (A) Genomic deletions observed in ASC clone B3 at P7.Arrowheads point to deleted regions (see Table 1 for chromosome positioning and Table 2 for a list of annotated genes included in the deleted regions). (B) CGH analysis of the same clone at P17.No deletions are observed, presumably as a result of elimination of the cells bearing aberrations from the culture beyond P7.
2.
Annotated genes included in deletions of chromosome regions 1p36.33–36.32, 14q32.33 and 20q13.33 in adipose stem cell clone B3 at passage 7a
| Chromosome region | |||||||
|---|---|---|---|---|---|---|---|
| 1p36.33–36.32 | 14q32.33 | 20q13.33 | |||||
| FAM87B | GNB1 | Q86U10_HUMAN | CDH4 | Q6ZS33_HUMAN | |||
| XR_017693.1 | CALML6 | Q96GK3_HUMAN | Q5VZ43_HUMAN | KCNQ2 | |||
| Q96BN7_HUMAN | TMEM52 | C14orf144 | TAF4 | EEF1A2 | |||
| Q8N8E4_HUMAN | NP_001003808.1 | Q6ZTZ3_HUMAN | LSM14B | C20orf149 | |||
| SAMD11 | Q8N1×1_HUMAN | NP_001008404.1 | PSMA7 | PTK6 | |||
| NOC2L | KIAA1751 | Q7Z4P9_HUMAN | SS18L1 | SRMS | |||
| KLHL17 | GABRD | TMEM179 | GTPBP5 | C20orf195 | |||
| PLEKHN1 | PRKCZ | C14orf151 | HRH3 | PR285_HUMAN | |||
| C1orf170 | Q4G173_HUMAN | C14orf173 | A2RUP6_HUMAN | GMEB2 | |||
| HES4 | Q9NW32_HUMAN | Q6ZNM3_HUMAN | OSBPL2 | STMN3 | |||
| ISG15 | C1orf86 | ADSSL1 | ADRM1 | TNFRSF6B | |||
| AGRN | Q8N9S5_HUMAN | SIVA1 | LAMA5 | ARFRP1 | |||
| C1orf159 | Q9H7Y2_HUMAN | AKT1 | Q6ZRS1_HUMAN | ZGPAT | |||
| Q6ZQQ1_HUMAN | SKI | Q8IW43_HUMAN | RPS21 | LIME1 | |||
| TTLL5 | MORN1 | KIAA0284 | CABLES2 | SLC2A4RG | |||
| TNFRSF18 | RER1 | PLD4 | C20orf151 | ZBTB46 | |||
| TNFRSF4 | PEX10 | C14orf78 | GATA5 | C20orf181 | |||
| SDF4 | PLCH2 | C14orf79 | NP_689970.1 | TPD52L2 | |||
| B3GALT6 | PANK4 | Q9HA39_HUMAN | C20orf166 | C20orf135 | |||
| C1QDC2 | HES5 | CDCA4 | Q6ZNY1_HUMAN | Q96F95_HUMAN | |||
| UBE2J2 | Q6ZP28_HUMAN | GPR132 | Q5JT57_HUMAN | DNAJC5 | |||
| SCNN1D | TNFRSF14 | JAG2 | SLCO4A1 | UCKL1 | |||
| CENTB5 | C1orf93 | NUDT14 | Q8TB00_HUMAN | Q6ZRP6_HUMAN | |||
| PUSL1 | MMEL1 | BRF1 | C20orf90 | Q6ZR49_HUMAN | |||
| CPSF3L | Q6ZV91_HUMAN | BTBD6 | NTSR1 | K1196_HUMAN | |||
| NP_001025056.1 | ACTRT2 | PACS2 | C20orf20 | SAMD10 | |||
| TAS1R3 | Q8N6L5_HUMAN | MTA1 | OGFR | PRPF6 | |||
| DVL1 | PRDM16 | CRIP2 | COL9A3 | PRR17 | |||
| MXRA8 | ARHGEF16 | CRIP1 | TCFL5 | SOX18 | |||
| AURKAIP1 | MEGF6 | C14orf80 | DPH3B | TCEA2 | |||
| CCNL2 | FAM79A | TMEM121 | DIDO1 | RGS19 | |||
| MRPL20 | WDR8 | LOC649910 | C20orf11 | OPRL1 | |||
| LOC643965 | TP73 | C14orf81 | C20orf59 | NP_001007126.1 | |||
| VWA1 | NP_997189.1 | O00509_HUMAN | Q6ZQP1_HUMAN | NPBWR2 | |||
| ATAD3A | CCDC27 | hsa-mir-203 | BHLHB4 | MYT1_HUMAN | |||
| ATAD3B | LOC388588 | Q6ZRC6_HUMAN | hsa-mir-133a-2 | ||||
| C1orf70 | LRRC47 | C20orf51 | hsa.mir-1–1 | ||||
| SSU72 | KIAA0562 | YTHDF1 | hsa-mir-124a-3 | ||||
| Q9P0E8_HUMAN | DFFB | BIRC7 | hsa-mir-647 | ||||
| MIB2 | C1orf174 | C20orf58 | |||||
| MMP23A | hsa-mir-429 | Q6ZMP7_HUMAN | |||||
| P21127–10 | hsa-mir-200a | ARFGAP1 | |||||
| SLC35E2 | hsa-mir-200b | COL20A1 | |||||
| CDC2L1 | hsa-mir-551a | CHRNA4 | |||||
| NADK | Q6ZSD3_HUMAN | ||||||
Genes are listed in their 5′–3′ order within each region.
Discussion
We report here a high-resolution analysis of genetic stability of human ASCs cultured to senescence as polyclones or single cell-derived clones. We found that karyotypes are normal (46, XX) in three out of three polyclonal cultures, with no evidence of inversion or translocation events, suggesting a low incidence of double-stranded DNA breaks and intermingling between chromosomes [22]. However, array CGH analysis reveals abnormalities whose significance remains uncertain. Apparent occasional but minor copy number changes (duplications) occur in polyclonal and clonal ASC cultures, preferably in early passage populations. These signals seem to be non-random and primarily affect specific chromosomes (7, 8, 10, 12, 19 and X; Pc3 at P5 and clone B2 at P16) or a subset of these (chromosomes 7, 19; Pc1 at P5). The length of the affected regions varies from 360–420 kb to ∼9 Mb with most peaks averaging 3–4 Mb and spanning the centromere (Table 1). Notably though, although these shifts meet our criteria of copy number aberration (see Materials and methods), it is possible that they are the result of hybridization artifacts mainly caused by their proximity to areas with satellite repeats and inefficient suppression of these by Cot-1 DNA. This view is also supported by the observation that the position of the DNA gain identified is strikingly similar on all chromosomes concerned (Table 1). Nonetheless, we cannot formally discard the possibility that these pericen-tromeric aberrations reflect instability of microsatel-lite repeats in culture. Additionally, one out of six ASC cultures (clone B3), displays at P7 deletions in telomeric or sub-telomeric gene-rich regions of chromosomes 1, 14 and 20, in a sub-population of cells that did not persist in the late culture. Collectively, our results show therefore that clonal chromosome aberrations may occur in human ASC cultures, in pericentromeric or genic regions. Instabilities are more frequent in early passage and except for one out of six cultures, they are undetectable in senescent cells. In most cultures, late passage cells show no signs of balanced or unbalanced chromosome alterations, reflecting a genomic stability during extended culture. Our data may suggest that for re-population experiments cells should be cultured serially for several passages to ensure a most stable genotype. Culture may also open for the possibility of testing cell populations for DNA copy number aberrations before transplantation.
Spontaneous transformation of MSCs derived from human adipose tissue was recently reported [15], but was detected only upon culture beyond senescence. In our hands, ASCs do not bypass senescence even after two months of post-senescence culture. These cells show no evidence of transformation in vitro on the basis of re-entry into the cell cycle, mitotic index, acquisition of a rounded phenotype and loss of anchorage-dependence. Culture conditions, however, may be a critical factor promoting transformation of human MSCs. For example, adipose-derived MSCs have been passaged by Rubio and colleagues [15] at 85% confluency and shown to senesce after only ∼2 months of culture; unfortunately, no indication is provided on cell density upon replating and on the number of passages reached at senescence. Remarkably in that study [15], all cultures bypass the crisis phase within 1–8 weeks. This timing is similar to that reported previously for normal human epithelial cells that escape senescence [23]. ASCs used in our study were passaged at 50% confluency and replated at 1500 cells/cm2, and all cultures examined here reached senescence between P15 and P23, that is, after 30–45 population doublings. Because higher cell density upon passaging promotes cell division, passage frequency is enhanced and accelerates progression to replicative senescence. Speculatively, it may be that cells reaching senescence early, that is, after relatively few population doublings, may retain an ‘intrinsic’ability to divide and thereby to transform post-senescence, which cells senescing after a high number of population doublings no long have.
Our results support the current view that human MSCs in general do not undergo transformation upon careful long-term culture [13, 16, 24–26]. Nonetheless, our observations do not necessarily imply that ASCs would not transform after inoculation in vivo or maintain a physiological phenotype. In contrast to human MSCs however, mouse MSCs frequently spontaneously transform in vitro, a condition which often leads to tumour progression in vivo[13, 14]. Interestingly, experimental transformation of human cells requires overexpression of more factors than transformation of mouse cells [27, 28]. Perturbation of two pathways, involving Raf and p53, is sufficient for tumourigenic transformation of murine cells, whereas six pathways (implicating the retinoblas-toma protein, p53, protein phosphatase 2A, telomerase, Raf and Raf-guanine exchange factors) are involved in human fibroblast transformation [29]. The requirement for activation of these pathways can also substantially vary between human cell types [29], adding complexity to the molecular mechanisms behind cellular transformation in human cells. On the basis of these observations, it is likely that activation of signalling pathways beyond those required for mouse cells is necessary for spontaneous transformation of human MSCs in vitro. This conceivably reflects the evolutionary establishment of additional safeguard mechanisms preventing tumourigenesis in humans. It should be noted, however, that genetic transformation of human kidney epithelial cells can occur in the absence of extensive aneuploidy, chromosomal translocations and microsatellite instability [30]. Thus, in vitro transformation of human cells can occur without widespread genomic instability.
We have searched our array CGH data for oncogenes and tumour suppressor genes frequently targeted for alteration by cell culture, including TERT, c-MYC, MYCN, RB1, PTEN, P53, KRAS, HRAS, P16, P27, P57, CCND1, CCND2 and CCND3, among others. All loci exhibited normal copy number in polyclonal and clonal ASC cultures. Interestingly, recent evidence suggests that chromosomal instabilities and tumours may be promoted by DNA hypomethylation [31]. In ASCs, genes involved in adipogenesis (such as LEP, PPARG2, LPL, FABP4) [12], as well as housekeeping gene promoters, are largely unmethylated or undergo moderate stochastic methylation changes upon culture to senescence [32]. All these genes display a normal DNA copy number (data not shown). Similar conclusions were drawn from genes with a strongly methylated promoter [17] (data not shown). Therefore, culture of human ASCs maintains not only DNA copy number and structure but also epigenetic stability, at least at the promoter DNA methylation level.
Acknowledegments
We thank Dr. A. C. Boquest and C.T. Freberg for initiating ASC cultures. This work was supported by the Research Council of Norway (FUGE, YFF, STORFORSK and STAM-CELLE programs), the Norwegian Cancer Society, and by infrastructural resources for the Norwegian Microarray Consortium, the National Microarray platform of the FUGE program of the Research Council of Norway.
Supporting Information
Sample NimbleGen ID No. linking ASC culture and passage number to PDF file providing array CGH profiles for eachchromosome.
G-banding karyotyping analysis of polyclonal cultures of ASCs. (A) Pc2 at P11. (B) Pc3 at P13. Both karyotypes are normal.
Please note: Blackwell Publishing are not responsible for the content or functionality of any supplementary materials supplied by the authors. Any queries (other than missing material) should be directed to the corresponding author for the article.
References
- 1.Pittenger MF, Mackay AM, Beck SC, Jaiswal RK, Douglas R, Mosca JD, Moorman MA, Simonetti DW, Craig S, Marshak DR. Multilineage potential of adult human mesenchymal stem cells. Science. 1999;284:143–7. doi: 10.1126/science.284.5411.143. [DOI] [PubMed] [Google Scholar]
- 2.Jiang Y, Vaessen B, Lenvik T, Blackstad M, Reyes M, Verfaillie CM. Multipotent progenitor cells can be isolated from postnatal murine bone marrow, muscle, and brain. Exp Hematol. 2002;30:896–904. doi: 10.1016/s0301-472x(02)00869-x. [DOI] [PubMed] [Google Scholar]
- 3.Zuk PA, Zhu M, Mizuno H, Huang J, Futrell JW, Katz AJ, Benhaim P, Lorenz HP, Hedrick MH. Multilineage cells from human adipose tissue: implications for cell-based therapies. Tissue Eng. 2001;7:211–28. doi: 10.1089/107632701300062859. [DOI] [PubMed] [Google Scholar]
- 4.Katz AJ, Tholpady A, Tholpady SS, Shang H, Ogle RC. Cell surface and transcriptional characterization of human adipose-derived adherent stromal (hADAS) cells. Stem Cells. 2005;23:412–23. doi: 10.1634/stemcells.2004-0021. [DOI] [PubMed] [Google Scholar]
- 5.Cowan CM, Shi YY, Aalami OO, Chou YF, Mari C, Thomas R, Quarto N, Contag CH, Wu B, Longaker MT. Adipose-derived adult stromal cells heal critical-size mouse calvarial defects. Nat Biotechnol. 2004;22:560–7. doi: 10.1038/nbt958. [DOI] [PubMed] [Google Scholar]
- 6.Kim DH, Je CM, Sin JY, Jung JS. Effect of partial hepatectomy on in vivo engraftment after intravenous administration of human adipose tissue stromal cells in mouse. Microsurgery. 2003;23:424–31. doi: 10.1002/micr.10178. [DOI] [PubMed] [Google Scholar]
- 7.Heil M, Ziegelhoeffer T, Mees B, Schaper W. A different outlook on the role of bone marrow stem cells in vascular growth: bone marrow delivers software not hardware. Circ Res. 2004;94:573–4. doi: 10.1161/01.RES.0000124603.46777.EB. [DOI] [PubMed] [Google Scholar]
- 8.Kang SK, Lee DH, Bae YC, Kim HK, Baik SY, Jung JS. Improvement of neurological deficits by intracere-bral transplantation of human adipose tissue-derived stromal cells after cerebral ischemia in rats. Exp Neurol. 2003;183:355–66. doi: 10.1016/s0014-4886(03)00089-x. [DOI] [PubMed] [Google Scholar]
- 9.Cousin B, Andre M, Arnaud E, Penicaud L, Casteilla L. Reconstitution of lethally irradiated mice by cells isolated from adipose tissue. Biochem Biophys Res Commun. 2003;301:1016–22. doi: 10.1016/s0006-291x(03)00061-5. [DOI] [PubMed] [Google Scholar]
- 10.Fraser JK, Wulur I, Alfonso Z, Hedrick MH. Fat tissue: an underappreciated source of stem cells for biotechnology. Trends Biotechnol. 2006;24:150–4. doi: 10.1016/j.tibtech.2006.01.010. [DOI] [PubMed] [Google Scholar]
- 11.Boquest AC, Shahdadfar A, Fronsdal K, Sigurjonsson O, Tunheim SH, Collas P, Brinchmann JE. Isolation and transcription profiling of purified uncultured human stromal stem cells:alteration of gene expression after in vitro cell culture. Mol BiolCell. 2005;16:1131–41. doi: 10.1091/mbc.E04-10-0949. [DOI] [PMC free article] [PubMed] [Google Scholar]
- 12.Noer A, Sørensen AL, Boquest AC, Collas P. Stable CpG hypomethylation of adipogenic promoters in freshly isolated, cultured and differentiated mesenchymal stem cells from adipose tissue. Mol Biol Cell. 2006;17:3543–56. doi: 10.1091/mbc.E06-04-0322. [DOI] [PMC free article] [PubMed] [Google Scholar]
- 13.Miura Y, Gao Z, Miura M, Seo BM, Sonoyama W, Chen W, Gronthos S, Zhang L, Shi S. Mesenchymal stem cell-organized bone marrow elements: an alternative hematopoietic progenitor resource. Stem Cells. 2006;24:2428–36. doi: 10.1634/stemcells.2006-0089. [DOI] [PubMed] [Google Scholar]
- 14.Tolar J, Nauta AJ, Osborn MJ, Panoskaltsis MA, McElmurry RT, Bell S, Xia L, Zhou N, Riddle M, Schroeder TM, Westendorf JJ, McIvor RS, Hogendoorn PC, Szuhai K, Oseth L, Hirsch B, Yant SR, Kay MA, Peister A, Prockop DJ, Fibbe WE, Blazar BR. Sarcoma derived from cultured mesenchymal stem cells. Stem Cells. 2007;25:371–9. doi: 10.1634/stemcells.2005-0620. [DOI] [PubMed] [Google Scholar]
- 15.Rubio D, Garcia-Castro J, Martin MC, De La FR, Cigudosa JC, Lloyd AC, Bernad A. Spontaneous human adult stem cell transformation. Cancer Res. 2005;65:3035–9. doi: 10.1158/0008-5472.CAN-04-4194. [DOI] [PubMed] [Google Scholar]
- 16.Zhang ZX, Guan LX, Zhang K, Wang S, Cao PC, Wang YH, Wang Z, Dai LJ. Cytogenetic analysis of human bone marrow-derived mesenchymal stem cells passaged in vitro. Cell Biol Int. 2007;31:645–8. doi: 10.1016/j.cellbi.2006.11.025. [DOI] [PubMed] [Google Scholar]
- 17.Boquest AC, Noer A, Sorensen AL, Vekterud K, Collas P. CpG methylation profiles of endothelial cell-specific gene promoter regions in adipose tissue stem cells suggest limited differentiation potential toward the endothelial cell lineage. Stem Cells. 2007;25:852–61. doi: 10.1634/stemcells.2006-0428. [DOI] [PubMed] [Google Scholar]
- 18.Workman C, Jensen LJ, Jarmer H, Berka R, Gautier L, Nielser HB, Saxild HH, Nielsen C, Brunak S, Knudsen S. A new non-linear normalization method for reducing variability in DNA microarray experiments. Genome Biol. 2002;3:48–55. doi: 10.1186/gb-2002-3-9-research0048. [DOI] [PMC free article] [PubMed] [Google Scholar]
- 19.Lu C. Improving the scaling normalization for high-density oligonucleotide GeneChip expression microarrays. BMC Bioinformatics. 2004;5:103–7. doi: 10.1186/1471-2105-5-103. [DOI] [PMC free article] [PubMed] [Google Scholar]
- 20.Olshen AB, Venkatraman ES, Lucito R, Wigler M. Circular binary segmentation for the analysis of array-based DNA copy number data. Biostatistics. 2004;5:557–72. doi: 10.1093/biostatistics/kxh008. [DOI] [PubMed] [Google Scholar]
- 21.ISCN. “An International System for Human Cytogenetic Nomenclature” Kragel, Basel, 2005.
- 22.Branco MR, Pombo A. Intermingling of chromosome territories in interphase suggests role in translocations and transcription-dependent associations. PLoS Biol. 2006;4:e138. doi: 10.1371/journal.pbio.0040138. [DOI] [PMC free article] [PubMed] [Google Scholar]
- 23.Romanov SR, Kozakiewicz BK, Holst CR, Stampfer MR, Haupt LM, Tlsty TD. Normal human mammary epithelial cells spontaneously escape senescence and acquire genomic changes. Nature. 2001;409:633–7. doi: 10.1038/35054579. [DOI] [PubMed] [Google Scholar]
- 24.Stenderup K, Justesen J, Clausen C, Kassem M. Aging is associated with decreased maximal life span and accelerated senescence of bone marrow stromal cells. Bone. 2003;33:919–26. doi: 10.1016/j.bone.2003.07.005. [DOI] [PubMed] [Google Scholar]
- 25.Colter DC, Class R, DiGirolamo CM, Prockop DJ. Rapid expansion of recycling stem cells in cultures of plastic-adherent cells from human bone marrow. Proc Natl Acad Sci USA. 2000;97:3213–8. doi: 10.1073/pnas.070034097. [DOI] [PMC free article] [PubMed] [Google Scholar]
- 26.Bonab MM, Alimoghaddam K, Talebian F, Ghaffari SH, Ghavamzadeh A, Nikbin B. Aging of mesenchy-mal stem cell in vitro. BMC Cell Biol. 2006;7:14–21. doi: 10.1186/1471-2121-7-14. [DOI] [PMC free article] [PubMed] [Google Scholar]
- 27.Hahn WC, Weinberg RA. Rules for making human tumor cells. N Engl J Med. 2002;347:1593–603. doi: 10.1056/NEJMra021902. [DOI] [PubMed] [Google Scholar]
- 28.Hahn WC, Counter CM, Lundberg AS, Beijersbergen RL, Brooks MW, Weinberg RA. Creation of human tumour cells with defined genetic elements. Nature. 1999;400:464–8. doi: 10.1038/22780. [DOI] [PubMed] [Google Scholar]
- 29.Rangarajan A, Hong SJ, Gifford A, Weinberg RA. Species- and cell type-specific requirements for cellular transformation. Cancer Cell. 2004;6:171–83. doi: 10.1016/j.ccr.2004.07.009. [DOI] [PubMed] [Google Scholar]
- 30.Zimonjic D, Brooks MW, Popescu N, Weinberg RA, Hahn WC. Derivation of human tumor cells in vitro without widespread genomic instability. Cancer Res. 2001;61:8838–44. [PubMed] [Google Scholar]
- 31.Eden A, Gaudet F, Waghmare A, Jaenisch R. Chromosomal instability and tumors promoted by DNA hypomethylation. Science. 2003;300:455. doi: 10.1126/science.1083557. [DOI] [PubMed] [Google Scholar]
- 32.Noer A, Boquest AC, Collas P. Dynamics of adipogenic promoter DNA methylation during clonal culture of human adipose stem cells to senescence. BMC Cell Biol. 2007;8:18–29. doi: 10.1186/1471-2121-8-18. [DOI] [PMC free article] [PubMed] [Google Scholar]
Associated Data
This section collects any data citations, data availability statements, or supplementary materials included in this article.
Supplementary Materials
Sample NimbleGen ID No. linking ASC culture and passage number to PDF file providing array CGH profiles for eachchromosome.
G-banding karyotyping analysis of polyclonal cultures of ASCs. (A) Pc2 at P11. (B) Pc3 at P13. Both karyotypes are normal.