

Abstract
Objectives
In this report, we seek to (i) identify a potential neuroimaging endophenotype for bipolar disorder (BD) in emotion regulatory and autonomic circuitry in young first-degree relatives of persons with BD; and (ii) replicate our previous work identifying the functional neuroanatomy of working memory (WM) in an older sample of relatives of persons with BD.
Methods
Ten adolescent and young adult (age 13–24) unmedicated, non-ill, first-degree relatives of persons with BD (RELS) and 10 demographically comparable healthy controls performed a 2-back WM task and a 0-back control task during functional magnetic resonance imaging (fMRI). fMRI data were collected on a 1.5 Tesla scanner and analyzed using SPM-2. Mood was assessed on the day of scanning.
Results
The groups did not differ on any demographic, neuropsychological, or in-scanner task performance variables. In contrast to controls, RELS showed (i) weak task-dependent modulation activity in the cerebellar vermis (CV), insula, and amygdala/parahippocampal region, and (ii) exaggerated modulation of activity in the frontopolar cortex and brainstem, even after controlling for potential confounders. Many of the group differences were driven by differences in activity in the low-level (0-back) baseline task.
Conclusions
Young, unmedicated RELS exhibited altered task-dependent modulation of frontopolar, CV, and insula activity during WM, especially during the low-level (0-back) baseline task. Results are largely consistent with our initial study of older adult RELS, suggesting these alterations may represent biomarkers of genetic risk for BD.
Keywords: autonomic nervous system, bipolar disorder, functional MRI, genetics, working memory
Deficits in executive function and verbal learning are present in bipolar disorder (BD) (1, 2), and to a lesser extent in their first-degree relatives (RELS) (3–7), suggesting that these deficits may be potential endophenotypes for BD. While cognitive measures are often used to probe brain activity in BD, a growing literature documents that BD patients and their RELS exhibit altered activity in insular, frontopolar, and orbitofrontal cortices [independent of the cognitive or emotional task used or clinical state, e.g., (8)], suggesting a trait-like, task-independent pattern of brain activity. This pattern of brain activity is remarkably similar to the activity seen in results of imaging studies of negative emotion and autonomic hyperarousal in healthy subjects (9–11), and is observed while subjects perform cognitive tasks not designed to probe emotion in BD or RELS (12–14). This suggests an important dysfunction in neural circuits underlying emotion and autonomic arousal, and is consistent with recent evidence of exaggerated frontal cortical and subcortical responses to emotional faces in RELS (15).
We previously suggested that this pattern of altered brain activity may be a biomarker of BD, reflecting expression of susceptibility genes for BD (13). We hypothesized that frontopolar and orbitofrontal (OFC) alterations in BD reflect reduced cognitive and emotional control during task performance (10, 16–21). Consistent with this hypothesis, we previously showed that negative emotion scores in adult RELS were positively correlated with frontopolar activity and reduced working memory (WM) accuracy (13). Behavioral studies also confirm that negative mood disrupts cognitive task performance in control and mood disordered samples (22, 23).
Indeed, the strongest evidence of a BD endophenotype from studies of BD or RELS implicates the frontal lobe in disease vulnerability (12, 24–28); in particular, the ventral prefrontal (29) and frontopolar regions (12, 13, 30). However, it is also noteworthy that two of the brain regions that most reliably emerge as altered in our and other imaging studies of BD (OFC, insula) are observed in imaging studies of autonomic arousal and pain [insula/prefrontal cortex (31, 32); OFC /insula (10)]. The autonomic nervous system (ANS) plays an important role in maintaining vigilance for task performance (33, 34), and there is preliminary evidence of altered ANS regulation in euthymic BD and RELS [including abnormalities in pain sensitivity (35, 36), cardiovascular and vagal function (37–40), the sleep/wake cycle (41–45), attention (46), and motivation (47)]. Based on these preliminary data, we speculated that altered regulation of ANS, by the OFC, insula, and other structures, may play a role in disrupting control of both cognition and emotion during task performance in BD and RELS (13).
Here, we used functional magnetic resonance imaging (fMRI) and the identical N-back WM task used in our previous work in older RELS (13) to examine brain activity in adolescent and young adult (non-psychotic and non-ill) RELS and controls, who are proximate to the peak age of risk for illness-onset and within the period in which critical illness-related neurodevelopmental changes are presumed to occur. Characterizing the phenotype in this developmental period may eventually help to clarify pathophysiological processes in BD and inform future targets for prevention (48).
Based on our previous work (13), we predicted that RELS would exhibit greater activity than controls during WM in frontopolar, insular, and orbitofrontal cortices, as well as a core region associated with emotion, the amygdala. We also predicted, based on our previous findings in adult RELS (13), that (i) negative emotion (specifically depression, confusion, and tension/anxiety) in RELS would be associated with reduced 2-back accuracy and slower reaction times; (ii) frontopolar activity during WM would be associated with greater negative emotion and reduced 2-back accuracy; (iii) insula activity would be associated with greater negative emotion; and (iv) RELS would show an absence of the negative emotion-OFC activity relationship seen in controls. Finally, on an exploratory basis, we predicted that altered activity in additional regions involved in the regulation of the ANS in RELS would correlate with negative emotion and reduced WM performance. This exploratory hypothesis was based on our previous work showing alterations in multiple regions involved in regulation of the ANS (insula, OFC), and is further suggested by the role of the ANS in task-vigilance and observations of autonomic disturbances in clinical BD.
Materials and methods
Subjects
Subjects were 10 non-psychotic, non-BD, and unmedicated first-degree RELS of persons with a DSM-IV diagnosis of BD (with psychotic features), and 10 healthy, unmedicated control subjects selected to be comparable (p > 0.05) on age (range 13-24), gender, education, socioeconomic status (SES), ethnicity, handedness, and reading achievement. Subjects were excluded if they had: any lifetime diagnosis of psychotic illness, substance dependence, neurological disease, history of head injury or medical illness with documented cognitive sequelae, sensory impairments, general intellectual ability (IQ) < 70, contraindications for magnetic resonance imaging, or current psychotropic medication use. RELS also were excluded if they had any personal history of bipolar illness, and controls were excluded if they had any lifetime psychiatric diagnosis or a family history of psychotic illness. None of the 10 RELS had a lifetime or current diagnosis of any mood disorder. Control families with children in the same age range were recruited from the same geographic area (metropolitan Boston, MA, USA), with similar SES and ethnicity as the patient families. Controls were administered the same clinical procedures as RELS. The study was approved by the human research committees of the Massachusetts Mental Health Center, Massachusetts General Hospital, Harvard University, and other recruitment sites. Subjects aged 18 years and older gave informed consent. Parents of children < 18 years of age gave informed consent and the youth gave assent.
Psychiatric assessment
Bipolar-I disorder patients with psychotic features and control probands (clinically-ill BD or healthy persons respectively, with unaffected relatives < age 25) were assessed using the Diagnostic Interview for Genetic Studies (49) and the Family Interview for Genetic Studies (50). Relatives of BD and control probands were screened for presence of other Axis-I disorders, psychosis, and substance use with the Washington University in St. Louis Kiddie Schedule for Affective Disorders and Schizophrenia (51). We administered the psychosis, mood disorders, and substance abuse modules of the K-SADS and our Neurodevelopmental Questionnaire (52) to establish other inclusion and exclusion criteria. Subjects’ mood during the past week was assessed with the Profile of Mood States (POMS) (53) approximately 30 min before scanning.
Neuropsychological testing
IQ was calculated by prorating scaled scores of eight subtests (four Verbal and Performance scales each) from the Weschler Intelligence Scale for Children–third edition (54) (for subjects < age 17) or the Weschler Adult Intelligence Scale–third edition (55) (for subjects 17 years and older) including: Vocabulary, Comprehension, Digit Span, Arithmetic, Block Design, Picture Arrangement, Digit Symbol/Coding, and Symbol Search. The Wide Range Achievement Test–third edition Reading subtest (56) was used to estimate general intellectual function (57). Handedness was assessed with the Annett Scale (58).
fMRI: working memory and control vigilance tasks
Subjects performed two runs of a sequential letter, block-designed visual N-back WM task with blocks of rest, of 0-back trials, and of 2-back trials, as previously described (59). Briefly, in each run, three 32-sec blocks of the 0-back task alternated with three 32-sec blocks of the 2-back task (16 200-msec trials per block, with a 1800-msec inter-stimulus interval), and each task block was preceded by a 20-sec block of fixation. Hit rate and reaction time were dependent variables.
Neuroimaging
Imaging was conducted on a Siemens Sonata 1.5 Tesla full-body magnetic resonance scanner at the Massachusetts General Hospital Martinos Center. A sagittal localizer scan was performed for placement of slices, followed by a coronal T2-weighted sequence to rule out unexpected neuropathology. Two sagittal 3D MP-RAGE (T1-weighted, nonselective inversion-prepared spoiled gradient echo pulse) sequences were collected (TR/TE/T1/flip = 2.73 sec/3.39 msec/1.0 sec/7, bandwidth = 190 Hz/pixel, sampling matrix = 256 × 192 pixels, FOV = 256 × 256 mm, effective slice thickness = 1.33 mm on a 170 mm slab of 128 partitions). Whole-brain gradient-echo echo planar imaging was acquired (21 contiguous axial slices parallel to the anterior commissure-posterior commissure line; 5 mm, 1 mm skip, TR/TE/flip = 2000/40/90; voxel size 3.1 × 3.1 × 5 mm; FOV = 200 mm) while subjects performed two N-back task runs.
Statistical analysis
Demographic, neuropsychological, and clinical variables were compared using independent sample t-tests performed in the Statistical Package for the Social Sciences (SPSS) software (Standard Version 11.0.1, 2002, SPSS Inc., Chicago, IL, USA). fMRI data were analyzed using Statistical Parametric Mapping (SPM)-2 software (Wellcome Department of Cognitive Neurology, London, UK) and in-house software running under the MATLAB environment (Mathworks, Inc., Sherborn, MA, USA).
First-level analyses
For each participant, functional images were realigned, normalized to the Montreal Neurological Institute (MNI) template supplied with SPM-2, and smoothed with an 8-mm Gaussian kernel. Within-subject analyses employed a block-based general linear model. Each block (2-back and 0-back) was modeled using a boxcar function convolved with a canonical hemodynamic response function. Estimated motion correction parameters were included as additional covariates. A contrast was created for each subject for the 2-back > 0-back condition. Contrasts were then submitted to second level random-effects analyses.
Second-level analyses
Within-group effects for the 2-back > 0-back contrast were tested using one-sample t-tests on contrast images for the entire sample (n = 20) and each group separately. Between-group differences for the 2-back > 0-back contrast were tested using a two-sample t-test. Statistical maps were initially thresholded at p < 0.005 (uncorrected).
Whole-brain analysis
For unpredicted regions, cluster-wise inferences were family-wise error (FWE) corrected for multiple comparisons at p < 0.05.
Region-of-interest (ROI) analysis
For a priori defined ROIs based on our previous work studying activity in emotion-regulatory regions during WM in adult RELS (13), the cluster-wise [FWE-corrected (p < 0.05)] were reported using the small volume correction method with (i) anatomical masks created using the Wake Forest University PickAtlas Tool (bilateral insula and amygdala) (http://www.fmri.wfubmc.edu) (60), and (ii) 10 mm spherical masks of the left frontopolar cortex and left OFC (defined around a peak coordinate taken from the literature (13, 30), as we defined previously (13). Effect sizes corresponding to group differences were calculated using Cohen’s d.
Group differences observed in the 2-back > 0-back contrast can be driven by group differences in the 2-back condition, the 0-back condition, or both. In order to further characterize differences in the 2-back > 0-back contrast, parameter estimates for the 2-back and the 0-back conditions (levels of task-related activation or suppression calculated relative to fixation baseline, i.e., 2-back > fixation, 0-back > fixation contrasts) were extracted from the significant functional clusters that differentiated the groups in the 2-back > 0-back contrast. These parameter estimates were subjected to with-in-group and between-groups post-hoc t-tests, and are depicted in graphs (Figs. 1–4). To address the possibility that group activation differences reflected group differences in potentially confounding variables, we performed ANCOVAs in which POMS vigor scores and IQ were included as covariates (group differences were marginal: vigor, p = 0.06; IQ, p = 0.12).
Fig. 1.

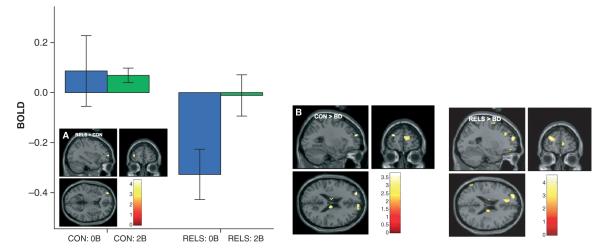
SPM(t) maps showing greater blood-oxygen-dependent (BOLD) signal change (activation) in (A) the cerebellar vermis IX (VIX) and hemispheric XIII (HXIII) regions and (B) less deactivation in the midbrain (MIDBR)/pons (PONS) region [including the reticular formation (RF), dorsal raphe (DR), and ventral tegmental area (VTA)] in controls (CON) compared to first-degree relatives of persons with bipolar disorder (RELS) during working memory (WM) [2-back WM > 0-back task contrast; color scale = t-value; MNI coordinates of peak voxel: (A) cerebellar vermis: x = 0, y = −48, z = −42; (B) MIDBR/PONS: x = 9, y = −27, z = −12]. Graph depicts parameter estimates (mean BOLD fMRI signal change, with standard error bars) extracted from the cerebellar vermis and MIDBR/PONS clusters for the 0-back (0B) and 2-back (2B) conditions relative to fixation (represented by the zero baseline) for each group.
Fig. 4.

(A) SPM(t) maps showing nonsuppression of the left orbitofrontal cortex (OFC) (BA 47) during working memory (WM) in first-degree relatives of persons with bipolar disorder (RELS) compared to controls (CON) after controlling for IQ scores, replicating (B) our previous work showing exaggerated signal in the same region in older adult RELS compared to CON (13). [2-back WM > 0-back task contrast; MNI coordinates of peak voxel: (A): x = −15, y = 27, z = −15; (B): x = −24, y = 12, z = −18]. Graph depicts parameter estimates [mean blood-oxygen-dependent (BOLD) fMRI signal change, with standard error bars] extracted from the OFC cluster for the 0-back (0B) and 2-back (2B) conditions relative to fixation (represented by the zero baseline) for each group.
To test a priori hypotheses about relationships between emotion, task performance, and brain activity based on our previous research in adult RELS (13), bivariate Pearson correlations of WM performance (accuracy and reaction time), natural log-transformed POMS scores and fMRI parameter estimates (extracted from the functional clusters that differentiated the groups) were calculated using SPSS. An exploratory correlational analysis was also conducted in the cerebellar vermis (CV) and brainstem clusters that differentiated the groups. To control for false positives in bivariate correlations, correlations with false discovery rate (FDR)-corrected p-values < 0.05 were reported.
Results
Demographic, neuropsychological, and other characteristics
The groups were similar in age, gender, ethnicity, handedness, education, SES, reading achievement and IQ scores, history of substance use, and all but one of the POMS scores [POMS vigor scores marginally differed between groups (p = 0.06)] (Table 1). During fMRI scanning, RELS and controls had similar accuracy and reaction times on the 0-back and 2-back WM tasks.
Table 1.
Demographic, neuropsychological, and clinical characteristics of controls (CON) and first-degree relatives of persons with bipolar disorder (RELS)
| Variable | CON (n = 10) | RELS (n = 10) | CON versus RELS t (p) or χ2 (p) |
|---|---|---|---|
| Matching variables | |||
| Age at MRI, mean (SD)a | 17.1 (1.4) | 18.4 (4.2) | 0.92 (0.37) |
| Gender (% male) | 50 | 50 | 0.00 (1.0) |
| Ethnicity (% Caucasian) | 70 | 100 | 5.00 (0.17) |
| Handedness (% right) | 80 | 100 | 0.56 (0.46) |
| Socioeconomic status, mean (SD)a,b | 41.8 (10.3) | 46.8 (16.4) | 0.78 (0.44) |
| WRAT-3 Reading, mean (SD) | 100.9 (12.9) | 106.8 (9.2) | 1.18 (0.25) |
| Education and IQ, mean (SD) | |||
| Education, years | 10.0 (1.5) | 11.6 (3.8) | 1.23 (0.24) |
| IQ estimatec | 95.4 (16.5) | 107.7 (16.9) | 1.65 (0.12) |
| In scanner tasks, mean (SD) | |||
| 0-back % correct | 98.4 (1.0) | 93.3 (9.8) | 1.55 (0.17) |
| 0-back reaction time (msec) | 530.0 (74.0) | 511.0 (61.0) | 0.58 (0.57) |
| 2-back % correct | 88.5 (5.9) | 87.3 (9.0) | 0.34 (0.74) |
| 2-back reaction time (msec) | 783.0 (180.0) | 684.0 (153.0) | 1.21 (0.24) |
| POMS scores, mean (SD) | |||
| Tension/anxiety | 34.4 (5.3) | 35.2 (5.6) | 0.53 (0.74) |
| Depression | 37.1 (5.1) | 39.6 (5.6) | 0.99 (0.32) |
| Anger/hostility | 43.7 (7.4) | 45.0 (4.8) | 0.64 (0.65) |
| Vigor | 61.5 (8.9) | 54.2 (6.9) | 2.02 (0.06) |
| Fatigue | 41.7 (5.5) | 44.0 (6.4) | 0.99 (0.42) |
| Confusion | 35.3 (5.3) | 37.7 (3.7) | 1.34 (0.25) |
MRI = magnetic resonance imaging; WRAT-3 = Wide Range Achievement Test–third edition (56); POMS = Profile of Mood States.
Levene’s Test for Equality of Variances was significant, therefore equality of variances was not assumed.
Parental socioeconomic status measured using the Hollingshead Four Factor Index (103).
Full-scale intelligence quotient (IQ) assessed using the Wechsler Intelligence Scale for Children–III (54) or Wechsler Adult Intelligence Scale-III (55) prorated from eight subtests.
Neuroimaging
In the total sample of 20 participants, there was greater activation during the 2-back (versus 0-back) task in cortical regions typically associated with WM, including the bilateral dorsolateral prefrontal cortex (BA 9 /46) and inferior frontal cortex (BA 45), left superior parietal lobule and inferior frontal cortex (BA 39/40), left frontopolar cortex (BA 10) and bilateral cerebellum (all p < 0.05, cluster-level corrected). Regions of significant activation and deactivation for the 2-back > 0-back contrast in controls and RELS are described in Tables 2 and 3, respectively.
Table 2.
Regions of significant functional magnetic resonance imaging (fMRI) activation and deactivation in controls during working memory (WM)
| Coordinates (MNI) |
fMRI response |
|||||||
|---|---|---|---|---|---|---|---|---|
| Region | L/R | Cluster extent (voxels) | x | y | z | Comparison | t a | p-value |
| Activation | ||||||||
| Whole-brain analysis b | ||||||||
| Cerebellum/posterior lobe/brainstem | R | 2045 | 33 | −63 | −33 | 2-back > 0-back | 14.55 | 0.0001 |
| Ventral thalamus/globus pallidus | R | 583 | 18 | −12 | 0 | 2-back > 0-back | 13.00 | 0.0001 |
| Middle and inferior frontal gyrus (BA 6/45) |
R | 2071 | 30 | 3 | 51 | 2-back > 0-back | 4.81 | 0.0001 |
| Inferior frontal gyrus | R | 125 | 33 | 27 | −3 | 2-back > 0-back | 4.17 | 0.0001 |
| Superior parietal lobule (BA 7/40) | R | 1714 | 27 | −69 | 57 | 2-back > 0-back | 4.70 | 0.0001 |
| Frontopolar cortex/middle frontal gyrus (BA 10) |
L R |
80 200 |
−36 30 |
60 54 |
12 15 |
2-back > 0-back 2-back > 0-back |
4.24 4.05 |
0.0001 0.0001 |
| Region-of-interest analysis c | ||||||||
| Insula | L | 71 | −30 | 27 | 3 | 2-back > 0-back | 7.19 | 0.0001 |
| Cerebellar vermis | R | 79 | 3 | −57 | −15 | 2-back > 0-back | 9.50 | 0.0001 |
| L/R | 19 | 0 | −48 | −42 | 2-back > 0-back | 4.96 | 0.025 | |
| R | 363 | 6 | −30 | −12 | 2-back > 0-back | 4.72 | 0.0001 | |
| Deactivation | ||||||||
| Whole-brain analysis b | ||||||||
| Inferior parietal lobule (BA 40) | R | 644 | 57 | −30 | 36 | 0-back > 2-back | 14.44 | 0.0001 |
| Medial frontal gyrus (BA 10) / anterior cingulate (BA 32) |
L | 665 | −9 | 54 | 6 | 0-back > 2-back | 9.71 | 0.0001 |
| Paracentral lobule/anterior and posterior cingulate (BA 32/31) |
R | 221 | 3 | −12 | 48 | 0-back > 2-back | 7.68 | 0.0001 |
| Insula | L | 120 | −45 | −9 | 3 | 0-back > 2-back | 7.42 | 0.001 |
| Inferior parietal lobule (BA 40) | L | 187 | −66 | −33 | 33 | 0-back > 2-back | 6.54 | 0.0001 |
| Postcentral gyrus | R | 61 | 24 | −39 | 72 | 0-back > 2-back | 3.61 | 0.05 |
| Region-of-interest analysis c | ||||||||
| Orbitofrontal cortex (BA 11) | L | 21 | −3 | 33 | −21 | 0-back > 2-back | 4.70 | 0.024 |
| R | 29 | 3 | 36 | −21 | 0-back > 2-back | 6.43 | 0.010 | |
| Insula | R | 17 | 42 | 0 | 9 | 0-back > 2-back | 4.62 | 0.035 |
| Amygdala | L | 4 | −21 | −3 | −24 | 0-back > 2-back | 4.00 | 0.033 |
MNI = Montreal Neurological Institute Coordinate System.
Maximum voxel-wise t-value within the cluster of interest.
Whole-brain analysis: cluster-wise family-wise error (FWE)-corrected statistic (p < 0.05).
Region-of-interest analysis: for regions of interest defined a priori, the cluster-wise statistic was FWE-corrected for multiple comparisons within the a priori region, i.e., using anatomical masks created with the Wake Forest University PickAtlas Tool, or using a spherical mask defined around coordinates taken from the literature [i.e., the frontopolar cortex and orbitofrontal cortex as used in our previously published work in adult first-degree relatives of persons with bipolar disorder (13)].
Table 3.
Regions of significant functional magnetic resonance imaging (fMRI) activation and deactivation in first-degree relatives of persons with bipolar disorder during working memory (WM)
| Coordinates (MNI) |
fMRI response |
|||||||
|---|---|---|---|---|---|---|---|---|
| Region | L/R | Cluster extent (voxels) | x | y | z | Comparison | t a | p-value |
| Activation | ||||||||
| Whole-brain analysis b | ||||||||
| Cerebellum/posterior lobe | R | 782 | 3 | −75 | −27 | 2-back > 0-back | 4.56 | 0.0001 |
| Region-of-interest analysis c | ||||||||
| Frontopolar cortex/middle frontal gyrus (BA 10) |
L | 10 | −33 | 60 | 12 | 2-back > 0-back | 4.42 | 0.045 |
| Deactivation | ||||||||
| Whole-brain analysis b | ||||||||
| Inferior temporal gyrus (BA 20)/posterior insula |
L | 766 | −45 | −9 | −36 | 0-back > 2-back | 9.21 | 0.0001 |
| Inferior temporal gyrus (BA 20)/anterior and posterior insula |
R | 1332 | 42 | 3 | −39 | 0-back > 2-back | 6.84 | 0.0001 |
| Medial frontal gyrus (BA 10) / anterior cingulate (BA 32) |
R | 855 | 3 | 57 | 6 | 0-back > 2-back | 7.94 | 0.0001 |
| Precuneus | R | 231 | −9 | −48 | 30 | 0-back > 2-back | 5.96 | 0.003 |
| Region-of-interest analysis c | ||||||||
| Insula | L | 47 | 45 | 3 | −3 | 0-back > 2-back | 5.15 | 0.011 |
| Amygdala | L | 10 | −27 | −3 | −15 | 0-back > 2-back | 5.08 | 0.020 |
| R | 23 | 24 | −3 | −18 | 0-back > 2-back | 4.42 | 0.008 | |
MNI = Montreal Neurological Institute Coordinate System.
Maximum voxel-wise t-value within the cluster of interest.
Whole-brain analysis: cluster-wise family-wise error (FWE)-corrected statistic (p < 0.05).
Region-of-interest analysis: for regions of interest defined a priori, the cluster-wise statistic was FWE-corrected for multiple comparisons within the a priori region, i.e., using anatomical masks created with the Wake Forest University PickAtlas Tool, or using a spherical mask defined around coordinates taken from the literature [i.e., the frontopolar cortex and orbitofrontal cortex, as used in our previously published work in adult first-degree relatives of persons with bipolar disorder (13)].
Between-group comparisons: whole-brain analysis
When activation during 2-back and 0-back was compared between groups (2-back > 0-back contrast), controls exhibited greater activation than RELS during WM in the CV (lobule IX) and hemispheric XIII regions, extending to the pons level (p = 0.03, cluster-level corrected) (Table 4, Fig. 1A). Further exploration of the parameter estimates (for the 0-back > fixation and 2-back > fixation contrasts) extracted from the CV cluster revealed that controls exhibited significant within-group modulation (enhancement) of activity from the 0-back to the 2-back condition (p = 0.0001). Compared to controls, RELS exhibited significantly greater activity in the CV cluster during the 0-back condition (p = 0.05), and did not exhibit significant within-group modulation of activity from 0-back to 2-back, as seen in controls (p = 0.58) (Fig. 1A, see graph). Group differences were due to significant between-group differences in both the 0-back (p = 0.05) and 2-back conditions (p = 0.01). This finding remained significant when POMS vigor scores (p < 0.01, Table 4) and IQ (t = 5.32, d = 2.58, p = 0.022) were covaried.
Table 4.
Functional magnetic resonance imaging (fMRI) signal change differences in controls (CON) compared to first-degree relatives of persons with bipolar disorder (RELS) during working memory (WM)a
| Peak coordinate (MNI) |
Original difference in fMRI response between groups |
Difference after controlling for POMS vigor scores |
||||||||||
|---|---|---|---|---|---|---|---|---|---|---|---|---|
| Region | L/R | Cluster extent (voxels) |
x | y | z | Group difference |
t b | Effect size (d) |
p-value | t b | Effect size (d) |
p-value |
| Whole-brain analysis c | ||||||||||||
| Cerebellar vermis IX and hemispheric XIII regions |
L | 173 | 0 | −48 | −42 | CON > RELS | 5.20 | 2.45 | 0.03 | 5.21 | 2.61 | 0.01 |
| Brainstem/midbrain/pons/reticular formation/raphe nuclei/ventral tegmental area |
R | 129 | 9 | −27 | −12 | CON > RELS | 4.77 | 2.25 | 0.09 | 4.74 | 2.46 | 0.005 |
| Insula (BA 13, anterior and posterior regions) |
L | 130 | −36 | −18 | 6 | CON > RELS | – | – | – | 4.74 | 2.37 | 0.05 |
| Parahippocampal gyrus/amygdala / insula (BA 13) |
R | 629 | 36 | −15 | −24 | CON > RELS | – | – | – | 4.69 | 2.35 | 0.0001 |
| Region-of-interest analysis d | ||||||||||||
| Frontopolar cortex (middle frontal gyrus, BA 10) |
L | 4 | −33 | 60 | 9 | RELS > CON | 4.01 | 1.89 | 0.004 | 7.24 | 3.62 | 0.06 |
| Insula (BA 13, anterior and posterior regions) |
R | 81 | 42 | 0 | −3 | CON > RELS | – | – | – | 4.44 | 2.22 | 0.025 |
| Amygdala/parahippocampal gyrus | R | 6 | 27 | −6 | −21 | CON > RELS | – | – | – | 3.31 | 1.66 | 0.05 |
MNI = Montreal Neurological Institute Coordinate System; POMS = Profile of Mood States.
2-back WM > 0-back task contrast.
Maximum voxel-wise t-value within the cluster of interest.
Whole-brain analysis: cluster-wise family-wise error (FWE)-corrected statistic (p < 0.05).
Region-of-interest analysis: for regions of interest defined a priori, the cluster-wise statistic was FWE-corrected for multiple comparisons within the a priori region, i.e., using anatomical masks created with the Wake Forest University PickAtlas Tool, or using a spherical mask defined around coordinates taken from the literature [i.e., the frontopolar cortex and orbitofrontal cortex, as used in our previously published work in adult first-degree relatives of persons with bipolar disorder (13)].
Controls also showed greater activity (specifically, less deactivation) than RELS in the brainstem [2-back > 0-back contrast; in the midbrain in the right reticular formation, extending to the pons level with activation in the dorsal raphe nucleus and extending to the ventral tegmental area (VTA)], which was statistically significant when POMS vigor scores were used as a covariate in the analysis (p = 0.005, cluster-level corrected) (Table 4, Fig. 1B). Parameter estimates (for the 0-back > fixation and 2-back > fixation contrasts) extracted from the brainstem cluster revealed greater modulation (deactivation) during the 0-back in controls than RELS (p = 0.05), with both groups showing significant deactivation in response to the 2-back task (controls: p = 0.05, RELS: p = 0.02), (Fig. 1B, graph). Group differences were driven by differences in only the 0-back (p = 0.05) and not the 2-back condition (p = 0.48). This finding was not robust when IQ was covaried, however, the t-value and effect size were still large (t = 4.47, d = 2.17).
Between-group comparisons: region-of-interest analysis
RELS exhibited significantly greater activation compared to controls in the left frontopolar cortex (2-back > 0-back contrast) (Table 4, Fig. 2, graph), in the same region which differentiated older adult controls and RELS from BD patients in our previous WM study (13). This finding was marginally significant when vigor scores (p = 0.06, Table 4) and IQ scores (t = 3.42, d = 1.66, p = 0.09) were covaried. Parameter estimates (for the 0-back > fixation and 2-back > fixation contrasts) extracted from the frontopolar cluster revealed lower 0-back activity in the RELS compared to controls (p = 0.03) and significant modulation (enhancement) of activity from 0-back to 2-back only in the RELS (p = 0.02) but not controls (p = 0.90) (Fig. 2, bar graph). Group differences were driven by differences in only the 0-back condition (p = 0.03) but not the 2-back condition (p = 0.38).
Fig. 2.
(A) SPM(t) maps showing reduced activation during 0-back (relative to fixation) and greater modulation of activation during 2-back working memory (WM) (relative to 0-back) in the left frontopolar cortex (BA 10) in first-degree relatives of persons with bipolar disorder (RELS) compared to controls (CON), replicating (B) our previous work showing a similar pattern in the same region in older adult RELS and CON compared to persons with bipolar disorder (BD) (13). [2-back WM > 0-back task contrast; color scale = t-value; MNI coordinates of peak voxel: (A): x = −33, y = 60, z = 9; (B): x = −27, y = 57, z = 21]. Graph depicts parameter estimates [mean blood-oxygen-dependent (BOLD) fMRI signal change, with standard error bars] extracted from the frontopolar cluster for the 0-back (0B) and 2-back (2B) conditions relative to fixation (represented by the zero baseline) for each group.
Findings in three a priori ROIs (the insula, amygdala, and OFC) emerged only in covariate analyses. In ANCOVA using POMS vigor score as a covariate, controls showed significantly greater activation than RELS in the left and right insula (BA 13) and the right amygdala/parahippocampal gyrus region (2-back > 0-back contrast) (Table 4, Fig. 3). Parameter estimates (for the 0-back > fixation and 2-back > fixation contrasts) extracted from the left insula cluster and a cluster which included the right insula, amygdala, and parahippocampus revealed a pattern similar to that seen in the CV: while controls significantly enhanced activation from 0-back to 2-back (L: p = 0.0007; R: p = 0.00007), RELS exhibited significantly higher activity in these regions during the 0-back condition than controls (L: p = 0.003; R: p = 0.001), with weak within-group modulation from 0-back to 2-back task (L: p = 0.92; R: p = 0.84) (Fig. 3, see graphs). Group differences were due to significant differences in only the 0-back condition (L: p = 0.003; R: p = 0.001) but not the 2-back condition (L: p = 0.24; R: p = 0.22).
Fig. 3.

SPM(t) maps showing greater activation of left insula (INS) and right INS (BA 13), amygdala (AMYG), and parahippocampus (PHP) from 0-back to 2-back condition in controls (CON) compared to first-degree relatives of persons with bipolar disorder (RELS), after controlling for Profile of Mood States vigor scores (2-back working memory > 0-back task contrast; MNI coordinates of peak voxel: left INS: x = −36, y = −18, z = 6; right INS/AMYG/PHP: x = 36, y = −15, z = −24). Graph depicts parameter estimates [mean blood-oxygen-dependent (BOLD) fMRI signal change, with standard error bars] extracted from the left INS cluster (left graph) and a right cluster which included the INS, AMYG, and PHP (right graph) for the 0-back (0B) and 2-back (2B) conditions relative to fixation (represented by the zero baseline) for each group.
In ANCOVA using IQ as a covariate, RELS also showed greater activation (specifically, less deactivation) in the left OFC (2-back > 0-back contrast) (Fig. 4), as we predicted based our previous study of older adult RELS (13). However, this finding did not achieve significance at the FWE cluster-corrected level (BA 47; t = 3.40, d = 1.65, p = 0.045, using the voxel-wise FDR correction). Parameter estimates (for the 0-back > fixation and 2-back > fixation contrasts) extracted from the OFC cluster revealed that controls marginally suppressed OFC activation from 0-back to 2-back (p = 0.06) (Fig. 4, graph). RELS, by contrast, exhibited a trend toward greater deactivation than controls during 0-back (p = 0.10), and failed to modulate activity (with further deactivation) from 0-back to 2-back (p = 0.75).
Examination of parameter estimates suggested that patterns of weak or hyper-modulation of activity from 0-back during the 2-back in RELS may have been in part due to group differences in the low-level 0-back task. Indeed, a two-sample t-test reflecting the 0-back > fixation contrast revealed significantly greater activation in RELS (compared to controls) in the CV region, brainstem, insula (anterior and posterior regions, bilaterally), amygdala (bilaterally), and right inferior temporal gyrus (BA 20/21); and lower activity in the left frontopolar cortex. There were no statistically significant group differences in the OFC.
Predicted relationships of brain activity, task performance, and mood
In RELS, left frontopolar activity (p = 0.04) and insula activity (bilaterally; L: p = 0.01, R: p = 0.02) were related to depression. Suppression of OFC activity during 0-back was marginally related to confusion in both controls and RELS, and to tension/anxiety in controls (all p = 0.06). Also in RELS, tension/anxiety was negatively related to 2-back reaction time (p = 0.05), while frontopolar activity was marginally negatively related to 2-back reaction time (p = 0.10).
Exploratory relationships of brain activity, task performance, and mood
In RELS, CV activity was related to anger/hostility in RELS (p = 0.04), while brainstem activity was related to tension/anxiety and fatigue (p = 0.05). No other exploratory correlations between brain activity, mood, and task performance survived FDR-correction for multiple comparisons.
Relationships of brain activity, task performance, and mood across all subjects (RELS and controls)
Unexpectedly, in predicted regions, activity during the 0-back condition was primarily related to mood in the whole sample. Activity in the insula (bilaterally) during 0-back was significantly related to all six POMS scores [tension/anxiety, depression, anger/hostility, vigor, fatigue, and confusion (all FDR-corrected, p < 0.05)]. Frontopolar activity during 0-back was related to vigor and confusion, while OFC activity during 0-back was significantly related to tension/anxiety, vigor, fatigue, and confusion (p < 0.05). In exploratory correlations, CV activity during 0-back (p = 0.05) and 2-back (p = 0.001) was related to vigor. Brainstem activity was marginally related to tension/anxiety and fatigue (p = 0.06). No other correlations between brain activity, mood, and task performance survived FDR-correction for multiple comparisons.
Discussion
During performance of a WM task in which performance was comparable across groups, RELS showed (i) weak modulation (activation or deactivation from 0-back to 2-back condition) in the CV, insula, and amygdala/parahippocampal region, and (ii) exaggerated modulation in the frontopolar cortex and brainstem (from 0-back to 2-back) compared to that seen in controls. In the CV, group differences were due to significant differences in both the 0-back and 2-back conditions, while group differences in other regions were driven by exaggerated activity (brainstem, insula, and amygdala) or reduced activity (frontopolar cortex) in the 0-back condition in RELS (as indicated by our examination of parameter estimates for 0-back and 2-back conditions, and by 2-group t-tests comparing 0-back and fixation conditions). In addition, RELS showed a nonsignificant trend toward reduced deactivation in the left OFC, slightly weaker than the significant finding in our previous study in adult RELS (13). Results were observed despite the absence of statistical differences between groups on all demographic, neuropsychological, in-scanner performance, and most clinical variables; and many results were robust to ANCOVAs using vigor and IQ as covariates. However, all results should be viewed as preliminary due to the small sample size.
Our results suggest altered neural reactivity to a low-load cognitive-challenge in RELS which affects modulation in response to a higher-load cognitive challenge, consistent with reports of altered low-level task response in mood disorder populations (14, 61, 62). The frontopolar findings largely replicate those of two BD studies of adult RELS (12, 13) and two fMRI studies of WM in BD (24, 30). Contrary to our hypotheses based on previous work (12), there was minimal evidence of a link between negative-emotion related brain activity and task performance in RELS. For example, while tension/anxiety was related to faster 2-back reaction time in RELS (FDR-corrected p = 0.05), activity in the frontopolar cortex was only marginally related to WM performance (FDR-corrected p = 0.10). However, activity in many of the regions that differentiated the groups (frontopolar, insular, CV, and brainstem) was significantly related to negative mood in RELS, despite the fact that both groups exhibited mood scores in the normal range and did not differ on average (with the exception of vigor level, p = 0.06). Further, insular, frontopolar, and orbitofrontal activity during the 0-back condition was significantly related to mood scores in the whole sample.
Alterations in the CV are consistent with a study showing CV volume is associated with resilience to BD in RELS (63), decreased CV signal during WM in BD (24), and abnormal spectroscopic (64) and structural findings in the CV in BD (65, 66). Altered CV activity may reflect homeostatic or compensatory adaptation in RELS which confers resilience to cognitive and emotional deficits seen in BD, consistent with the relationship of cerebellar volume and resilience to mood disorder in RELS (63). Indeed, the CV participates in regulation of the midbrain/VTA–amygdala/parahippocampal components of the Papez circuit (67–73), and plays a strong role in regulation of emotion (74–79), long-term fear conditioning (80, 81), and Pavlovian conditioned cardiac responses (82, 83), even independent of the amygdala (81). Further, CV transcranial magnetic stimulation (a putative treatment for mood disorders) directly affects amygdala/hippocampal activity (73). Here, CV activity was related to vigor in the whole sample and to anger/hostility in RELS. While speculative, altered CV modulation in RELS may reflect preserved capacity for vigor and externalizing emotions (anger), which confer protection against depression and mood disorder.
In addition, CV activity in RELS may reflect a compensatory adaptation that preserves task performance in the context of altered task-related frontopolar modulation. Notably, lesions of the CV are associated with both executive function deficits (attention, WM) as well as cognitive, emotional, and locomotor changes seen in BD (76–79). Thus, it is possible that inability to compensate for other abnormalities with CV activity may be one correlate of BD illness. Interestingly, the CV is sensitive to stress, glucocorticoids, and drugs of abuse (67, 84–87), which can be triggers to the onset of BD.
Many of the regions differentiating the groups (CV, insula, amygdala, raphe and other brainstem nuclei, and the VTA) participate in an extended visceromotor network modulating reward, fear, stress and autonomic/neuroendocrine responses, and motivation (10, 47, 64, 67–69, 72, 73, 75, 76, 81–86, 88–94). While pathophysiological mechanisms are unclear, abnormal modulation of this network could explain some of the abnormal cognitive, motivational, neuroendocrine, autonomic, and emotional symptoms in mood disorders (89). The reticular formation, for example, plays pivotal roles in the regulation of several domains affected in mood disorders (arousal, attention, autonomic reflexes, motor functions, the wake/sleep cycle, and pain) (94). The VTA (origin of the mesocortical and mesolimbic dopamine systems innervating several structures showing group differences here, such as the prefrontal, orbitofrontal, insular cortices, and amygdala) plays roles in the regulation of locomotor inhibition, arousal, affect, and drive (95). The raphe nuclei are implicated in antidepressant action (96) and pain inhibition, and are potentially relevant given genetic evidence of serotonergic abnormalities in BD (97, 98).
Finally, the findings of this study are also consistent with other recent findings of autonomic dysregulation in BD and other mood disorders, including (i) cardiovascular and vagal abnormalities (which pre-exist psychopharmacologic treatment) (37–40, 99); (ii) a relationship of maladaptive emotion regulation responses to lower vagal recovery in relatives of depressed persons (100); and (iii) vagus nerve stimulation as a putative treatment for severe mood disorders (101, 102).
Limitations
The findings of this study should be viewed as preliminary, due to the small sample size and exploratory nature of some of the results. Replication of the results in larger samples is needed. The result in the OFC, for example, did not meet our criteria for statistical significance. Though the resolution of fMRI is not sufficient to separate activations in small structures (i.e., in the pons and midbrain), the regions activated span multiple small structures and preliminary findings suggest a coherent network associated with regulation of autonomic arousal. In follow-up studies with larger samples, we will use ROIs derived from individual structural anatomy to look more precisely at the location of activations.
Conclusions
While preliminary, findings suggest altered modulation of the CV, frontopolar cortex, and insula during WM in familial risk for BD. If replicated in larger samples, these findings may represent biomarkers of genetic risk for BD.
Acknowledgements
The authors acknowledge support from the Mental Illness and Neuroscience Discovery Institute (LJS), MH-43518 and MH-65562 (MTT, LJS), MH-63951 (LJS), the Massachusetts Department of Mental Health Commonwealth Research Center (LJS), National Alliance for Research on Schizophrenia and Depression (LJS, MTT), CIDAR P50 MH-080272 (PI: McCarley), and the Poitras Center for Affective Disorders Research at Massachusetts Institute of Technology (SW-G). This work was also supported in part by The National Center for Research Resources (P41RR14075).
We thank the patients with bipolar disorder, their family members, and the control family members. We also thank our colleagues and project staff for their insightful comments on the manuscript and generous contributions to the study: Elizabeth Apkin, Ben Brent, M.D., Lisa Gabel, Steve Glatt, Ph.D., Barbara Holland, Daphe Holt, M.D., Ph.D., Richard Juelich, Kristen Kelly, Jennifer Koch, Marc Korczykowski, Virna Merino, Elon Mesholam, Peter LaViolette, Snezana Milanovic, M.D., M.S., William S. Stone, Ph.D., Lynda Tucker, and Sharon White.
References
- 1.Arts B, Jabben N, Krabbendam L, van Os J. Meta-analyses of cognitive functioning in euthymic bipolar patients and their first-degree relatives. Psychol Med. 2008;38:771–785. doi: 10.1017/S0033291707001675. [DOI] [PubMed] [Google Scholar]
- 2.Robinson LJ, Thompson JM, Gallagher P, et al. A meta-analysis of cognitive deficits in euthymic patients with bipolar disorder. J Affective Disord. 2006;93:105–115. doi: 10.1016/j.jad.2006.02.016. [DOI] [PubMed] [Google Scholar]
- 3.Frangou S, Haldane M, Roddy D, Kumari V. Evidence for deficit in tasks of ventral, but not dorsal, prefrontal executive function as an endophenotypic marker for bipolar disorder. Biol Psychiatry. 2005;58:838–839. doi: 10.1016/j.biopsych.2005.05.020. [DOI] [PubMed] [Google Scholar]
- 4.Glahn DC, Almasy L, Barguil M, et al. Neurocognitive endophenotypes for bipolar disorder identified in multiplex multigenerational families. Arch Gen Psychiatry. 2010;67:168–177. doi: 10.1001/archgenpsychiatry.2009.184. [DOI] [PMC free article] [PubMed] [Google Scholar]
- 5.Brambilla P, Glahn DC, Balestrieri M, Soares JC. Magnetic resonance findings in bipolar disorder. Psychiatr Clin North Am. 2005;28:443–467. doi: 10.1016/j.psc.2005.01.006. [DOI] [PubMed] [Google Scholar]
- 6.Doyle AE, Wozniak J, Wilens TE, et al. Neurocognitive impairment in unaffected siblings of youth with bipolar disorder. Psychol Med. 2009;39:1253–1263. doi: 10.1017/S0033291708004832. [DOI] [PMC free article] [PubMed] [Google Scholar]
- 7.Bora E, Yucel M, Pantelis C. Cognitive endophenotypes of bipolar disorder: a meta-analysis of neuropsychological deficits in euthymic patients and their first-degree relatives. J Affect Disord. 2009;113:1–20. doi: 10.1016/j.jad.2008.06.009. [DOI] [PubMed] [Google Scholar]
- 8.Kim E, Jung YC, Ku J, et al. Reduced activation in the mirror neuron system during a virtual social cognition task in euthymic bipolar disorder. Prog Neuropsychopharmacol Biol Psychiatry. 2009;33:1409–1416. doi: 10.1016/j.pnpbp.2009.07.019. [DOI] [PubMed] [Google Scholar]
- 9.Phillips ML, Young AW, Senior C, et al. A specific neural substrate for perceiving facial expressions of disgust. Nature. 1997;389:495–498. doi: 10.1038/39051. [DOI] [PubMed] [Google Scholar]
- 10.Nagai Y, Critchley HD, Featherstone E, Trimble MR, Dolan RJ. Activity in ventromedial prefrontal cortex covaries with sympathetic skin conductance level: a physiological account of a “default mode” of brain function. Neuroimage. 2004;22:243–251. doi: 10.1016/j.neuroimage.2004.01.019. [DOI] [PubMed] [Google Scholar]
- 11.Reiman EM, Lane RD, Ahern GL, Schwartz GE. Neuro-anatomical correlates of externally and internally generated human emotion. Am J Psychiatry. 1997;154:918–925. doi: 10.1176/ajp.154.7.918. [DOI] [PubMed] [Google Scholar]
- 12.Drapier D, Surguladze S, Marshall N, et al. Genetic liability for bipolar disorder is characterized by excess frontal activation in response to a working memory task. Biol Psychiatry. 2008;64:513–520. doi: 10.1016/j.biopsych.2008.04.038. [DOI] [PubMed] [Google Scholar]
- 13.Thermenos HW, Goldstein JM, Milanovic SM, et al. An fMRI study of working memory in persons with bipolar disorder or at genetic risk for bipolar disorder. Am J Med Genet Part B: Neuropsychiatr Genet. 2010;153B:120–131. doi: 10.1002/ajmg.b.30964. [DOI] [PMC free article] [PubMed] [Google Scholar]
- 14.Pavuluri MN, Passarotti AM, Harral EM, Sweeney JA. An fMRI study of the neural correlates of incidental versus directed emotion processing in pediatric bipolar disorder. J Am Acad Child Adolesc Psychiatry. 2009;48:308–319. doi: 10.1097/CHI.0b013e3181948fc7. [DOI] [PMC free article] [PubMed] [Google Scholar]
- 15.Surguladze SA, Marshall N, Schulze K, et al. Exaggerated neural response to emotional faces in patients with bipolar disorder and their first-degree relatives. Neuroimage. 2010;53:58–64. doi: 10.1016/j.neuroimage.2010.05.069. [DOI] [PubMed] [Google Scholar]
- 16.Burgess PW, Gilbert SJ, Dumontheil I. Function and localization within rostral prefrontal cortex (area 10) Philos Trans R Soc Lond B: Biol Sci. 2007;362:887–899. doi: 10.1098/rstb.2007.2095. [DOI] [PMC free article] [PubMed] [Google Scholar]
- 17.Koechlin E, Basso G, Pietrini P, Panzer S, Grafman J. The role of the anterior prefrontal cortex in human cognition. Nature. 1999;399:148–151. doi: 10.1038/20178. [DOI] [PubMed] [Google Scholar]
- 18.Owen AM, McMillan KM, Laird AR, Bullmore E. N-back working memory paradigm: a meta-analysis of normative functional neuroimaging studies. Hum Brain Mapp. 2005;25:46–59. doi: 10.1002/hbm.20131. [DOI] [PMC free article] [PubMed] [Google Scholar]
- 19.Rolls ET. The Brain and Emotion. Oxford University Press; Oxford: 1999. [Google Scholar]
- 20.Strange BA, Henson RN, Friston KJ, Dolan RJ. Anterior prefrontal cortex mediates rule learning in humans. Cereb Cortex. 2001;11:1040–1046. doi: 10.1093/cercor/11.11.1040. [DOI] [PubMed] [Google Scholar]
- 21.Pochon JB, Levy R, Fossati P, et al. The neural system that bridges reward and cognition in humans: an fMRI study. Proc Natl Acad Sci USA. 2002;99:5669–5674. doi: 10.1073/pnas.082111099. [DOI] [PMC free article] [PubMed] [Google Scholar]
- 22.Hare TA, Tottenham N, Galvan A, Voss HU, Glover GH, Casey BJ. Biological substrates of emotional reactivity and regulation in adolescence during an emotional go-nogo task. Biol Psychiatry. 2008;63:927–934. doi: 10.1016/j.biopsych.2008.03.015015. [DOI] [PMC free article] [PubMed] [Google Scholar]
- 23.Ladouceur CD, Dahl RE, Williamson DE, et al. Processing emotional facial expressions influences performance on a Go/NoGo task in pediatric anxiety and depression. J Child Psychol Psychiatry. 2006;47:1107–1115. doi: 10.1111/j.1469-7610.2006.01640.x. [DOI] [PubMed] [Google Scholar]
- 24.Chang K, Adleman NE, Dienes K, Simeonova DI, Menon V, Reiss A. Anomalous prefrontal-subcortical activation in familial pediatric bipolar disorder: a functional magnetic resonance imaging investigation. Arch Gen Psychiatry. 2004;61:781–792. doi: 10.1001/archpsyc.61.8.781. [DOI] [PubMed] [Google Scholar]
- 25.Haldane M, Frangou S. New insights help define the pathophysiology of bipolar affective disorder: neuroim-aging and neuropathology findings. Prog Neuropsychopharmacol Biol Psychiatry. 2004;28:943–960. doi: 10.1016/j.pnpbp.2004.05.040. [DOI] [PubMed] [Google Scholar]
- 26.Lagopoulos J, Ivanovski B, Malhi GS. An event-related functional MRI study of working memory in euthymic bipolar disorder. J Psychiatry Neurosci. 2007;32:174–184. [PMC free article] [PubMed] [Google Scholar]
- 27.McDonald C, Bullmore E, Sham P, et al. Regional volume deviations of brain structure in schizophrenia and psychotic bipolar disorder: computational morphometry study. Br J Psychiatry. 2005;186:369–377. doi: 10.1192/bjp.186.5.369. [DOI] [PubMed] [Google Scholar]
- 28.Monks PJ, Thompson JM, Bullmore ET, et al. A functional MRI study of working memory task in euthymic bipolar disorder: evidence for task-specific dysfunction. Bipolar Disord. 2004;6:550–564. doi: 10.1111/j.1399-5618.2004.00147.x. [DOI] [PubMed] [Google Scholar]
- 29.Monkul ES, Malhi GS, Soares JC. Anatomical MRI abnormalities in bipolar disorder: do they exist and do they progress? Aust N Z J Psychiatry. 2005;39:222–226. doi: 10.1080/j.1440-1614.2005.01571.x. [DOI] [PubMed] [Google Scholar]
- 30.Adler CM, Holland SK, Schmithorst V, Tuchfarber MJ, Strakowski SM. Changes in neuronal activation in patients with bipolar disorder during performance of a working memory task. Bipolar Disord. 2004;6:540–549. doi: 10.1111/j.1399-5618.2004.00117.x. [DOI] [PubMed] [Google Scholar]
- 31.Peyron R, Laurent B, García-Larrea L. Functional imaging of brain responses to pain. A review and meta-analysis (2000) Neurophysiol Clin. 2000;30:263–288. doi: 10.1016/s0987-7053(00)00227-6. [DOI] [PubMed] [Google Scholar]
- 32.Apkarian AV, Bushnell MC, Treede RD, Zubieta JK. Human brain mechanisms of pain perception and regulation in health and disease. Eur J Pain. 2005;9:463–484. doi: 10.1016/j.ejpain.2004.11.001. [DOI] [PubMed] [Google Scholar]
- 33.Hansen AL, Johnsen BH, Thayer JF. Vagal influence on working memory and attention. Int J Psychophysiol. 2003;48:263–274. doi: 10.1016/s0167-8760(03)00073-4. [DOI] [PubMed] [Google Scholar]
- 34.O’Connell RG, Bellgrove MA, Dockree PM, Lau A, Fitzgerald M, Robertson IH. Self-alert training: volitional modulation of autonomic arousal improves sustained attention. Neuropsychologia. 2008;46:1379–1390. doi: 10.1016/j.neuropsychologia.2007.12.018. [DOI] [PubMed] [Google Scholar]
- 35.Arnold LM, Hudson JI, Keck PE, Auchenbach MB, Javaras KN, Hess EV. Comorbidity of fibromyalgia and psychiatric disorders. J Clin Psychiatry. 2006;67:1219–1225. doi: 10.4088/jcp.v67n0807. [DOI] [PubMed] [Google Scholar]
- 36.Cavanagh J, Schwannauer M, Power M, Goodwin GM. A novel scale for measuring mixed states in bipolar disorder. Clin Psychol Psychother. 2009;16:497–509. doi: 10.1002/cpp.633. [DOI] [PubMed] [Google Scholar]
- 37.Voss A, Baier V, Schulz S, Bar KJ. Linear and nonlinear methods for analyses of cardiovascular variability in bipolar disorders. Bipolar Disord. 2006;8:441–452. doi: 10.1111/j.1399-5618.2006.00364.x. [DOI] [PubMed] [Google Scholar]
- 38.Henry BL, Minassian A, Paulus MP, Geyer MA, Perry W. Heart rate variability in bipolar mania and schizophrenia. J Psychiatr Res. 2010;44:168–176. doi: 10.1016/j.jpsychires.2009.07.011. [DOI] [PMC free article] [PubMed] [Google Scholar]
- 39.Politi P, Brondino N, Emanuele E. Increased proapoptotic serum activity in patients with chronic mood disorders. Arch Med Res. 2008;39:242–245. doi: 10.1016/j.arcmed.2007.07.011. [DOI] [PubMed] [Google Scholar]
- 40.Taylor V, MacQueen G. Associations between bipolar disorder and metabolic syndrome: a review. J Clin Psychiatry. 2006;67:1034–1041. doi: 10.4088/jcp.v67n0704. [DOI] [PubMed] [Google Scholar]
- 41.Skjelstad DV, Malt UF, Holte A. Symptoms and signs of the initial prodrome of bipolar disorder: a systematic review. J Affect Disord. 2010;126:1–13. doi: 10.1016/j.jad.2009.10.003. [DOI] [PubMed] [Google Scholar]
- 42.Mendlewicz J. Disruption of the circadian timing systems: molecular mechanisms in mood disorders. CNS Drugs. 2009;23(Suppl. 2):15–26. doi: 10.2165/11318630-000000000-00000. [DOI] [PubMed] [Google Scholar]
- 43.Mendlewicz J. Sleep disturbances: core symptoms of major depressive disorder rather than associated or comorbid disorders. World J Biol Psychiatry. 2009;10:269–275. doi: 10.3109/15622970802503086. [DOI] [PubMed] [Google Scholar]
- 44.Duffy A. The early course of bipolar disorder in youth at familial risk. J Can Acad Child Adolesc Psychiatry. 2009;18:200–205. [PMC free article] [PubMed] [Google Scholar]
- 45.Duffy A, Alda M, Hajek T, Sherry SB, Grof P. Early stages in the development of bipolar disorder. J Affect Disord. 2010;121:127–135. doi: 10.1016/j.jad.2009.05.022. [DOI] [PubMed] [Google Scholar]
- 46.Balanzá-Martínez V, Selva G, Martinez-Aran A, et al. Neurocognition in bipolar disorders–a closer look at comorbidities and medications. Eur J Pharmacol. 2010;626:87–96. doi: 10.1016/j.ejphar.2009.10.018. [DOI] [PubMed] [Google Scholar]
- 47.Abler B, Greenhouse I, Ongur D, Walter H, Heckers S. Abnormal reward system activation in mania. Neuropsychopharmacology. 2008;33:2217–2227. doi: 10.1038/sj.npp.1301620. [DOI] [PMC free article] [PubMed] [Google Scholar]
- 48.Stone WS, Faraone SV, Tsuang MT. Early Clinical Intervention and Prevention in Schizophrenia. The Humana Press Inc.; Totowa: 2003. [Google Scholar]
- 49.Nurnberger JI, Jr, Blehar MC, Kaufmann CA, et al. Diagnostic interview for genetic studies. Rationale, unique features, and training. NIMH Genetics Initiative. Arch Gen Psychiatry. 1994;51:849–859. doi: 10.1001/archpsyc.1994.03950110009002. [DOI] [PubMed] [Google Scholar]
- 50.Maxwell ME. Family Interview for Genetic Studies. Clinical Neurogenetics Branch, Intramural Research Program, NIMH; Bethesda: 1996. [Google Scholar]
- 51.Geller B, Williams M, Zimerman B, Frazier J. Washington University in St. Louis Kiddie Schedule for Affective Disorders and Schizophrenia (WASH-U-KSADS) Washington University; St. Louis: 1996. [DOI] [PubMed] [Google Scholar]
- 52.Faraone SV, Seidman LJ, Kremen WS, Pepple JR, Lyons MJ, Tsuang MT. Neuropsychological functioning among the nonpsychotic relatives of schizophrenic patients: a diagnostic efficiency analysis. J Abnorm Psychology. 1995;104:286–304. doi: 10.1037//0021-843x.104.2.286. [DOI] [PubMed] [Google Scholar]
- 53.McNair D, Lorr M, Droppleman L. EdITS Manual for the Profile of Mood States. Educational and Industrial Testing Service; San Diego: 1992. [Google Scholar]
- 54.Wechsler D. Wechsler Intelligence Scale for Children. 3rd ed Psychological Corporation; San Antonio: 1991. [Google Scholar]
- 55.Wechsler D. Wechsler Adult Intelligence Scale. 3rd ed Psychological Corporation; San Antonio: 1997. [Google Scholar]
- 56.Wilkinson GS. The Wide Range Achivement Test, Administration Manual. 3rd ed Wide Range Inc.; Wilmington: 1993. [Google Scholar]
- 57.Kremen WS, Buka SL, Seidman LJ, Goldstein JM, Koren D, Tsuang MT. Childhood IQ decline and adult psychotic symptoms in a community sample: a 19-year longitudinal study. Am J Psychiatry. 1998;155:672–677. doi: 10.1176/ajp.155.5.672. [DOI] [PubMed] [Google Scholar]
- 58.Annett M. A classification of hand preferences by association analysis. Br J Psychiatry. 1970;61:303–321. doi: 10.1111/j.2044-8295.1970.tb01248.x. [DOI] [PubMed] [Google Scholar]
- 59.Thermenos HW, Goldstein JM, Buka SL, et al. The effect of working memory performance on functional MRI in schizophrenia. Schizophr Res. 2005;74:179–194. doi: 10.1016/j.schres.2004.07.021. [DOI] [PubMed] [Google Scholar]
- 60.Maldjian JA, Laurienti PJ, Burdette JB, Kraft RA. An automated method for neuroanatomic and cytoarchitec-tonic atlas-based interrogation of fMRI data sets. Neuroimage. 2003;19:1233–1239. doi: 10.1016/s1053-8119(03)00169-1. [DOI] [PubMed] [Google Scholar]
- 61.Gotlib IH, Sivers H, Gabrieli JD, et al. Subgenual anterior cingulate activation to valenced emotional stimuli in major depression. Neuroreport. 2005;16:1731–1734. doi: 10.1097/01.wnr.0000183901.70030.82. [DOI] [PubMed] [Google Scholar]
- 62.Canli T, Cooney RE, Goldin P, et al. Amygdala reactivity to emotional faces predicts improvement in major depression. Neuroreport. 2005;16:1267–1270. doi: 10.1097/01.wnr.0000174407.09515.cc. [DOI] [PubMed] [Google Scholar]
- 63.Kempton MJ, Haldane M, Jogia J, Grasby PM, Collier D, Frangou S. Dissociable brain structural changes associated with predisposition, resilience, and disease expression in bipolar disorder. J Neurosci. 2009;29:10863–10868. doi: 10.1523/JNEUROSCI.2204-09.2009. [DOI] [PMC free article] [PubMed] [Google Scholar]
- 64.Cecil KM, DelBello MP, Sellars MC, Strakowski SM. Proton magnetic resonance spectroscopy of the frontal lobe and cerebellar vermis in children with a mood disorder and a familial risk for bipolar disorders. J Child Adoles Psychopharmacol. 2003;13:545–555. doi: 10.1089/104454603322724931. [DOI] [PubMed] [Google Scholar]
- 65.Monkul ES, Hatch JP, Sassi RB, et al. MRI study of the cerebellum in young bipolar patients. Prog Neuropsychopharmacol Biol Psychiatry. 2008;32:613–619. doi: 10.1016/j.pnpbp.2007.09.016. [DOI] [PMC free article] [PubMed] [Google Scholar]
- 66.Womer FY, Wang F, Chepenik LG, et al. Sexually dimorphic features of vermis morphology in bipolar disorder. Bipolar Disord. 2009;11:753–758. doi: 10.1111/j.1399-5618.2009.00745.x. [DOI] [PMC free article] [PubMed] [Google Scholar]
- 67.Snider RS, Maiti A. Cerebellar contributions to the Papez circuit. J Neurosci Res. 1976;2:133–146. doi: 10.1002/jnr.490020204. [DOI] [PubMed] [Google Scholar]
- 68.Heath RG, Dempesy CW, Fontana CJ, Fitzjarrell AT. Feedback loop between cerebellum and septal-hippocampal sites: its role in emotion and epilepsy. Biol Psychiatry. 1980;15:541–556. [PubMed] [Google Scholar]
- 69.Supple WF, Jr, Leaton RN, Fanselow MS. Effects of cerebellar vermal lesions on species-specific fear responses, neophobia, and taste-aversion learning in rats. Physiol Behav. 1987;39:579–586. doi: 10.1016/0031-9384(87)90156-9. [DOI] [PubMed] [Google Scholar]
- 70.Supple WF, Jr, Cranney J, Leaton RN. Effects of lesions of the cerebellar vermis on VMH lesion-induced hyper-defensiveness, spontaneous mouse killing, and freezing in rats. Physiol Behav. 1988;42:145–153. doi: 10.1016/0031-9384(88)90290-9. [DOI] [PubMed] [Google Scholar]
- 71.Reiman EM, Raichle ME, Robins E, et al. Neuroanatomical correlates of a lactate-induced anxiety attack. Arch Gen Psychiatry. 1989;46:493–500. doi: 10.1001/archpsyc.1989.01810060013003. [DOI] [PubMed] [Google Scholar]
- 72.Sacchetti B, Scelfo B, Strata P. The cerebellum: synaptic changes and fear conditioning. Neuroscientist. 2005;11:217–227. doi: 10.1177/1073858405276428. [DOI] [PubMed] [Google Scholar]
- 73.Schutter DJ, van Honk J. An electrophysiological link between the cerebellum, cognition and emotion: frontal theta EEG activity to single-pulse cerebellar TMS. Neuroimage. 2006;33:1227–1231. doi: 10.1016/j.neuroimage.2006.06.055. [DOI] [PubMed] [Google Scholar]
- 74.Anderson CM, Lowen SB, Renshaw PF. Emotional task-dependent low-frequency fluctuations and methylpheni-date: Wavelet scaling analysis of 1/f-type fluctuations in fMRI of the cerebellar vermis. J Neurosci Methods. 2006;151:52–61. doi: 10.1016/j.jneumeth.2005.09.020. [DOI] [PubMed] [Google Scholar]
- 75.Gündel H, O’Connor MF, Littrell L, Fort C, Lane RD. Functional neuroanatomy of grief: an fMRI study. Am J Psychiatry. 2003;160:1946–1953. doi: 10.1176/appi.ajp.160.11.1946. [DOI] [PubMed] [Google Scholar]
- 76.Bobee S, Mariette E, Tremblay-Leveau H, Caston J. Effects of early midline cerebellar lesion on cognitive and emotional functions in the rat. Behav Brain Res. 2000;112:107–117. doi: 10.1016/s0166-4328(00)00166-2. [DOI] [PubMed] [Google Scholar]
- 77.Maryniak A, Roszkowski M. [Cognitive and affective disturbances in children after surgical treatment of cerebellar tumors.] Neurol Neurochir Pol. 2005;39:202–206. [PubMed] [Google Scholar]
- 78.Famularo G, Corsi FM, Minisola G, De Simone C, Nicotra GC. Cerebellar tumour presenting with pathological laughter and gelastic syncope. Eur J Neurol. 2007;14:940–943. doi: 10.1111/j.1468-1331.2007.01784.x. [DOI] [PubMed] [Google Scholar]
- 79.Schmahmann JD, Weilburg JB, Sherman JC. The neuro-psychiatry of the cerebellum–insights from the clinic. Cerebellum. 2007;6:254–267. doi: 10.1080/14734220701490995. [DOI] [PubMed] [Google Scholar]
- 80.Sacchetti B, Baldi E, Lorenzini CA, Bucherelli C. Differential contribution of some cortical sites to the formation of memory traces supporting fear conditioning. Exp Brain Res. 2002;146:223–232. doi: 10.1007/s00221-002-1165-y. [DOI] [PubMed] [Google Scholar]
- 81.Sacchetti B, Sacco T, Strata P. Reversible inactivation of amygdala and cerebellum but not perirhinal cortex impairs reactivated fear memories. Eur J Neurosci. 2007;25:2875–2884. doi: 10.1111/j.1460-9568.2007.05508.x. [DOI] [PubMed] [Google Scholar]
- 82.Supple WF, Jr, Kapp BS. The anterior cerebellar vermis: essential involvement in classically conditioned bradycardia in the rabbit. J Neurosci. 1993;13:3705–3711. doi: 10.1523/JNEUROSCI.13-09-03705.1993. [DOI] [PMC free article] [PubMed] [Google Scholar]
- 83.Ghelarducci B, Sebastiani L. Classical heart rate conditioning and affective behavior: the role of the cerebellar vermis. Arch Ital Biol. 1997;135:369–384. [PubMed] [Google Scholar]
- 84.Anderson CM, Maas LC, Frederick B, et al. Cerebellar vermis involvement in cocaine-related behaviors. Neuropsychopharmacology. 2006;31:1318–1326. doi: 10.1038/sj.npp.1300937. [DOI] [PubMed] [Google Scholar]
- 85.Anderson CM, Teicher MH, Polcari A, Renshaw PF. Abnormal T2 relaxation time in the cerebellar vermis of adults sexually abused in childhood: potential role of the vermis in stress-enhanced risk for drug abuse. Psycho-neuroendocrinology. 2002;27:231–244. doi: 10.1016/s0306-4530(01)00047-6. [DOI] [PubMed] [Google Scholar]
- 86.Teicher MH, Andersen SL, Polcari A, Anderson CM, Navalta CP. Developmental neurobiology of childhood stress and trauma. Psychiatr Clin North Am. 2002;25:397–426. doi: 10.1016/s0193-953x(01)00003-x. [DOI] [PubMed] [Google Scholar]
- 87.Teicher MH, Andersen SL, Polcari A, Anderson CM, Navalta CP, Kim DM. The neurobiological consequences of early stress and childhood maltreatment. Neurosci Biobehav Rev. 2003;27:33–44. doi: 10.1016/s0149-7634(03)00007-1. [DOI] [PubMed] [Google Scholar]
- 88.Süpple M, Müller G, Klingberg F. Reduced behavioural inhibition after lesions in the dorsomedial pontine reticular formation of rats. Biomed Biochim Acta. 1987;46:521–525. [PubMed] [Google Scholar]
- 89.Drevets WC, Savitz J, Trimble M. The subgenual anterior cingulate cortex in mood disorders. CNS Spectr. 2008;13:663–681. doi: 10.1017/s1092852900013754. [DOI] [PMC free article] [PubMed] [Google Scholar]
- 90.Frysztak RJ, Neafsey EJ. The effect of medial frontal cortex lesions on cardiovascular conditioned emotional responses in the rat. Brain Res. 1994;643:181–193. doi: 10.1016/0006-8993(94)90024-8. [DOI] [PubMed] [Google Scholar]
- 91.Phillips ML, Drevets WC, Rauch SL, Lane R. Neurobiology of emotion perception. I: The neural basis of normal emotion perception. Biol Psychiatry. 2003;54:504–514. doi: 10.1016/s0006-3223(03)00168-9. [DOI] [PubMed] [Google Scholar]
- 92.Heath RG. Modulation of emotion with a brain pacemamer. Treatment for intractable psychiatric illness. J Nerv Ment Dis. 1977;165:300–317. [PubMed] [Google Scholar]
- 93.Supple WF, Jr, Leaton RN. Lesions of the cerebellar vermis and cerebellar hemispheres: effects on heart rate conditioning in rats. Behav Neurosci. 1990;104:934–947. doi: 10.1037//0735-7044.104.6.934. [DOI] [PubMed] [Google Scholar]
- 94.Nolte J. The Human Brain: An Introduction to Its Functional Anatomy. Elsevier Health Sciences; Philadelphia: 2001. [Google Scholar]
- 95.Brischoux F, Chakraborty S, Brierley DI, Ungless MA. Phasic excitation of dopamine neurons in ventral VTA by noxious stimuli. Proc Natl Acad Sci USA. 2009;106:4894–4899. doi: 10.1073/pnas.0811507106. [DOI] [PMC free article] [PubMed] [Google Scholar]
- 96.Briley M, Moret C. Neurobiological mechanisms involved in antidepressant therapies. Clin Neuropharmacol. 1993;16:387–400. doi: 10.1097/00002826-199310000-00002. [DOI] [PubMed] [Google Scholar]
- 97.Luddington NS, Mandadapu A, Husk M, El-Mallakh RS. Clinical implications of genetic variation in the serotonin transporter promoter region: a review. Prim Care Companion J Clin Psychiatry. 2009;11:93–102. doi: 10.4088/pcc.08r00656. [DOI] [PMC free article] [PubMed] [Google Scholar]
- 98.Mundo E, Zai G, Lee L, Parikh SV, Kennedy JL. The 5-HT1Dbeta receptor gene in bipolar disorder: a family-based association study. Neuropsychopharmacology. 2001;25:608–613. doi: 10.1016/S0893-133X(01)00259-7. [DOI] [PubMed] [Google Scholar]
- 99.Carney RM, Freedland KE, Veith RC. Depression, the autonomic nervous system, and coronary heart disease. Psychosom Med. 2005;67(Suppl. 1):S29–S33. doi: 10.1097/01.psy.0000162254.61556.d5. [DOI] [PubMed] [Google Scholar]
- 100.Santucci AK, Silk JS, Shaw DS, Gentzler A, Fox NA, Kovacs M. Vagal tone and temperament as predictors of emotion regulation strategies in young children. Dev Psychobiol. 2008;50:205–216. doi: 10.1002/dev.20283. [DOI] [PubMed] [Google Scholar]
- 101.Daban C, Martinez-Aran A, Cruz N, Vieta E. Safety and efficacy of vagus nerve stimulation in treatment-resistant depression. A systematic review. J Affect Disord. 2008;110:1–15. doi: 10.1016/j.jad.2008.02.012. [DOI] [PubMed] [Google Scholar]
- 102.Nahas Z, Teneback C, Chae JH, et al. Serial vagus nerve stimulation functional MRI in treatment-resistant depression. Neuropsychopharmacology. 2007;32:1649–1660. doi: 10.1038/sj.npp.1301288. [DOI] [PubMed] [Google Scholar]
- 103.Hollingshead AB. Four Factor Index of Social Status. Yale University Department of Sociology; New Haven: 1975. [Google Scholar]