Abstract
Autophagy is the regulated process cells use to recycle non-essential, redundant, or inefficient components and is an adaptive response during times of stress. In addition to its role in enabling the cell to gain vital nutrients in times of stress, autophagy can also be involved in elimination of intracellular microorganisms, tumor suppression, and antigen presentation. Because of difficulty in diagnosing autophagy, few clinical studies have been performed. This study examined whether autophagy occurs in hepatocytes during sepsis. Electron microscopy (EM) was performed on liver samples obtained from both an observational clinical cohort of 6 septic patients and 4 control patients as well as liver specimens from mice with surgical sepsis (via cecal ligation and puncture (CLP)) or sham operation. EM demonstrated increased autophagic vacuoles in septic versus non-septic patients. Randomly selected fields (3,000 square microns) from control and septic patients contained 1.2 ± 1.5 versus 5.3 ± 3.3 (mean ± SD) complex lysosomal/autophagolysosomal structures per image respectively (P<0.001). In rare instances, hepatocytes with autophagic vacuoles appeared to be unequivocally committed to death. Membrane alterations (membrane vacuoles, invagination into adjacent organelles and myelin figure-like changes) occur in a subpopulation of mitochondria in sepsis, but other hepatocyte organelles showed no consistent ultrastructural injury. Findings in murine sepsis paralleled those of patients, with 7.2 ± 1.9 versus 38.7 ± 3.9 lysosomal/autophagolysosomal structures in sham and septic mice, respectively (P =0.002). Quantitative RT-PCR demonstrated that sepsis-induced the upregulation of select apoptosis and cytokine gene expression with minimal changes in the core autophagy genes in liver. In conclusion, hepatocyte autophagic vacuolization increases during sepsis and is associated with mitochondrial injury. However, it is not possible to determine whether the increase in autophagic vacuolization is an adaptive response or a harbinger of cell death.
Keywords: cell death, inflammation, cytokines, electron microscopy, gene expression
Introduction
Autophagy was first used to describe electron microscopic observations of novel single- or double-membrane vesicles that contained cytoplasmic components including organelles in various stages of disintegration (1, 2). Autophagy is now known to be a process by which a cell degrades and recycles its own non-essential, redundant, or inefficient components. The autophagic pathway is distinct from the ubiquitin-proteosome system which degrades individual proteins. In eukaryotic cells, autophagy starts with the formation of a double-membrane vesicle, an autophagosome, that encompasses part of the cell cytoplasm or organelle (3, 4). The autophagosome subsequently fuses with a lysosome and is subjected to lysosomal acid hydrolases and other enzymes that digest the engulfed material. Autophagy is thought to be an adaptive response during times of cell stress, such as nutrient limitation. For example, autophagy may occur between meals within the liver to maintain its metabolic functions, supplying amino acids through catabolism (5). In addition to its role in enabling the cell to gain vital nutrients during times of stress, autophagy can also be involved in tumor suppression, deletion of misfolded aggregate-prone proteins, and antigen presentation (6–8). Autophagy has also been found to play a role in innate immunity, neutralizing intracellular pathogens including Streptococcus pyogenes (9) and Mycobacterium tuberculosis (10). Although autophagy is generally considered to be an adaptive mechanism, unbridled autophagy may result in cell death distinct from necrosis or classical apoptosis (11).
A particularly profound cell stress occurs during sepsis, the host response that results during severe infection (12). Sepsis is characterized by a constellation of signs and symptoms which often include fever, hypotension, increased muscle protein breakdown (cachexia), hyper-metabolism, and the development of multiple organ dysfunction (13). Given that autophagy is a well-established cellular response to stress, we hypothesized that autophagy would be accelerated during sepsis. The purpose of the present study was to determine the extent of hepatic autophagy during severe sepsis. The liver was elected as an organ of interest because autophagy has been described in this organ (5) and because of reports implicating autophagy in hepatocytes during animal models of sepsis (14). Liver specimens were removed rapidly postmortem from patients who died of sepsis or from patients having elective liver resections and were evaluated by electron microscopy. The findings in patients were compared to results obtained in a clinically relevant mouse peritonitis model of sepsis, i.e., the cecal ligation and puncture model (15). In animals, the spleen was also examined because of the documented increase in apoptotic death in the spleen during sepsis (16, 17) and the link between apoptosis and autophagy (18–20). Organ and cell-type specific quantitative RT-PCR (qRT-PCR) was performed in mouse liver, CD4+ and B splenocytes 8 and 18 hours after sepsis or sham surgery to determine whether known mediators of autophagic and apoptotic cell death were transcriptionally regulated.
Materials and Methods
Clinical samples
The present work represents a continuation of previous studies from this laboratory in which we reported findings in patients who died of sepsis and multiple organ dysfunction (21). Patients were classified as septic based upon one of the 3 following critieria: 1) positive blood, abdominal fluid, or tissue cultures for bacteria or fungi, 2) intraoperative evidence of infection, e.g., perforated large bowel with peritoneal contamination, ischemic bowel with purulent abdominal fluid, or 3) a histopathologic diagnosis of infection at postmortem examination (e.g. bronchopneumonia, intra-abdominal abscess). The clinical condition and etiology of the sepsis is presented in Table 1a. Only 1 of the 6 patients with sepsis had a prothrombin time that was elevated above the upper limit of normal for the hospital at which the study was conducted (Barnes Jewish Hospital). Therefore, this patient was classified as having liver dysfunction (21). The length of time between the onset of death and tissue harvesting generally varied from 30 to 90 minutes (21). The left lobe of the liver was used for sampling. For control purposes, liver samples were obtained intra-operatively from four patients who had elective hepatic resections (see Table 1b). Of the latter, three had primary liver neoplasms (hepatic adenoma, hepatocellular carcinoma and hemangioma) and one had metastatic breast carcinoma. Samples from these control patients were obtained from the uninvolved margins of the resected liver segments. None of the control patients received chemotherapy or radiation therapy in the two months prior to resection. The protocol for tissue harvesting was approved by the Human Studies Committee at Washington University School of Medicine.
Table 1a.
Profiles of patients with sepsis
| Patient # | Age (yr)/ gender | Diagnosis | # of days septic | # days in ICU | Organ dysfunction | Miscellaneous |
|---|---|---|---|---|---|---|
| 1 | 73/F | Urosepsis, ARDS | 2 | 2 | Lung, Kidney | Found unconscious at home – likely sick additional days, blood culture(+) for enterococcus. |
| 2 | 60/F | Bilateral bronchopneumonia | 5 | 5 | Lung | Systemic lupus erythematous on sterioids, blood culture(+) for Staphylococcus aureus; malnourished. |
| 3 | 26/F | Bronchopneumonia, ARDS secondary to MVA, pelvic fractures, acute MI | 9 | 15 | Lung | Splenectomy, mild muscular dystrophy. |
| 4 | 49/M | Thigh abscess, aspiration pneumonia | 16 | 16 | Liver Kidney Lung |
Elevated INR, Enterococci and yeast in wound culture. Type 2 diabetes. |
| 5 | 54/M | Peritonitis due to disruption of colonic anastomosis, colon Adenocarcinoma | 25 | 30 | Lung Kidney |
Elevated INR COPD, type 2 diabetes, no specific organisms identified. |
| 6 | 51/F | Peritonitis | 25 | 30 | Kidney | Previous splenectomy, invasive adrenal carcinoma. |
ARDS; acute respiratory distress syndrome, MVA; motor vehicle accident, MI; myocardial infarction, INR; international normalized ratio (for blood clotting time), COPD, chronic obstructive pulmonary disease.
Table 1b.
Profiles of patients without sepsis (control patients)
| Patient # | Age (yr)/ gender | Diagnosis | Co-morbidity | Miscellaneous |
|---|---|---|---|---|
| 7 | 53/F | Metastatic breast carcinoma in liver | Breast cancer | Endoscopic liver biopsy. |
| 8 | 71/M | Hemangioma, liver cholestasis, cholelithiasis | - | Laparoscopic cholecystectomy and liver resection. |
| 9 | 41/F | Hemorrhagic necrosis within hepatocellular adenoma | - | Mild coagulapathy. Hemi-hepatectomy. |
| 10 | 77/M | Hepatocellular carcinoma (left lobe) | - | Cholecystectomy and left hemi-hepatectomy. |
Mouse cecal ligation and puncture (CLP) model of sepsis and tissue sampling
Male C57BL/6J mice aged 6–8 weeks, 22–26 gms body weight, were purchased from Jackson Laboratories, Bar Harbor, ME. Mice were housed for at least one week prior to utilization. CLP or sham surgery was performed by the methods of Baker et al. (15) as previously described. Anesthesia was induced with 5% isoflurane followed by maintenance with 2% isoflurane. A small midline abdominal incision was performed, and the cecum was exteriorized and ligated immediately distal to the ileocecal valve, in a fashion that did not result in intestinal obstruction. The cecum was then punctured 2 times with a 25 gauge hollow-bore needle. The abdominal wall was closed in two layers and each animal received a subcutaneous injection of 2 mL 0.9% NaCl to compensate for third-space fluid loss. Sham mice were treated identically except that the cecum was neither ligated nor punctured. Tissue samples were obtained 24 hrs after surgery. All experiments were conducted in accordance with the National Institutes of Health guidelines for the use of laboratory animals and with approval of the Washington University Animal Studies Committee.
Transmission electron microscopy
Specimens were excised and immediately immersion fixed overnight in a modified Karnovsky’s fixative containing 3% glutaraldehyde and, 2% paraformaldehyde in 1M sodium cacodylate buffer (pH 7.4). Tissue samples were then rinsed in 1M sodium cacodylate buffer, post fixed in 2% osmium tetroxide, dehydrated through graded ethanols and propylene oxide and embedded in Embed 812 (Electron Microscopy Sciences, Hatfield, PA). Sections were cut 90 nanometers thick and placed on 200 mesh copper grids.
Grids were stained with uranyl acetate and lead citrate and viewed at 80kv with a JEOL 1200EX electron microscope and digital images were acquired with an AMT Advantage HR high speed, wide angle, 1.3 megapixel TEM high definition CCD camera. A minimum of 8–10 random fields were examined in blinded fashion at 2,500x (magnification for evidence of autophagy or cell injury/death. Higher magnifications (10,000 – 30,000x) were used to examine abnormal or atypical areas that were observed, and to evaluate potential organelle ultrastructural changes.
Liver tissue processing for quantitative real-time PCR following total RNA extraction and reverse transcription
Liver samples were obtained 8 and 18 hours after sham or sepsis surgery for analysis. Note that mortality in the CLP model begins after 20–24 hrs and therefore, if the genes are not upregulated by the 18 hour time point, it is unlikely that there is significant transcriptional regulation of these genes following the septic insult. RNA was extracted from livers using the standard Trizol (Life Technologies) protocol with the following exceptions. The left lobe of liver tissue was homogenized in 3mL of Trizol instead of 1mL. After incubating at room temperature for 5 minutes the samples were clarified by centrifugation at 12,000 × g for 10 minutes at 4°C. The top layer was removed, 1,500 μL isopropanol added and the mixture was put at −20°C for at least 2 hours for the RNA to precipitate. The samples were then centrifuged as before. The pellet was washed with 75% ethanol and spun down at 7,500 × g for 5 minutes at 4°C. The supernatant was removed, and the pellet was resuspended into 150μL water. The RNA was then further purified by putting 100μg, determined by A260, of the RNA through the RNeasy mini columns (Qiagen, Valencia, CA) following the manufacture’s recommended protocol.
The quantity and purity of extracted RNA was measured with a spectrophotometer (Spectronic BioMate 3 UV-Vis, Thermo Electron Co., Madison, WI). The quality of the extracted mRNA was verified on an Agilent 2100 Bioanalyzer using the RNA Nano LabChip kit (Agilent, Andover, MA). Purified total RNA was reverse transcribed into cDNA by using random primers with a high-capacity cDNA archive kit (Applied Biosystems Inc., Lincoln, CA). Briefly, 100 μL of each reaction mixture containing 10 μL of 10× RT buffer, 4 μL of 25× dNTPs, 10 μL of 10× random primers, 5 μL of MultiScribe Reverse Transcriptase (50 U/μL), and total RNA (up to 2 μg) was incubated for 15 minutes at 25 °C followed by 2 hours at 37 °C.
Quantitative real-time PCR
qRT-PCR was performed on selected genes involved in autophagy and in apoptosis (Table 2). Genes were selected for qRT-PCR analysis based on the canonical pathways of autophagy and apoptosis and a manually curated network demonstrating the connectivity between genetically encoded components was prepared (6, 7, 22). Programmed cell death 1 (Pcd-1) is a recently discovered negative co-stimulatory receptor expressed on T cells and is regarded as a pro-apoptotic molecule (23). Selected cytokines and the suppressor of cytokine signaling 3 (SOCS3) transcript were also measured based on results from previous transcriptome studies in the cecal ligation and puncture of sepsis which demonstrated that they were elevated (24, 25). We have previously shown that some of proapoptotic genes, especially Bim, p53–up-regulated modulator of apoptosis (PUMA), and Pcd1 are transcriptionally up-regulated after surgical sepsis CD4+ splenocytes (26). Therefore, we additionally evaluated autophagy and cytokine gene expression in both splenic B-cells and CD4+ lymphocytes to determine the extent of tissue specific responses (27).
Table 2.
Apoptosis, autophagy and inflammation pathway genes evaluated in the present study
| Symbol | Gene name; Synonyms | Function * | Accession No. | Assay ID of probe set |
|---|---|---|---|---|
| Bcl2 | B-cell leukemia/lymphoma 2; Bcl-2 | GO:0006916: anti-apoptosis | NM_009741 | Mm00477631_m1 |
| Bcl2l1 | Bcl2-like 1; Bcl-XL | ** | NM_009743 | Mm00437783_m1 |
| Bak1 | BCL2-antagonist/killer 1; Bak | GO:0006917: induction of apoptosis | NM_007523 | Mm00432045_m1 |
| Bax | Bcl2-associated X protein | GO:0006917: induction of apoptosis | NM_007527 | Mm00432050_m1 |
| Bcl2l11 | BCL2-like 11 (apoptosis facilitator); Bim | GO:0006917: induction of apoptosis | NM_207680 | Mm00437795_m1 |
| Bid | BH3 interacting domain death agonist | GO:0008625: induction of apoptosis via death domain receptors | NM_007544 | Mm00626981_m1 |
| Bad | Bcl-associated death promoter | GO:0008633: positive regulation of apoptosis | NM_007522 | Mm00432042_m1 |
| Akt1 | thymoma viral proto-oncogene 1; Akt | GO:0007186: GPCR protein signalling pathway | NM_009652 | Mm00437443_m1 |
| Fasl | Fas ligand (TNF superfamily, member 6); Fas-L | GO:0008624: induction of apoptosis by extracellular signals | NM_010177 | Mm00438864_m1 |
| Fadd | Fas (TNFRSF6)-associated via death domain | GO:0008625: induction of apoptosis via death domain receptors | NM_010175.5 | Mm00438861_m1 |
| Casp8 | caspase 8 | GO:0008624: induction of apoptosis by extracellular signals | NM_009812.2 | Mm00802247_m1 |
| Trp53 | transformation related protein 53; p53 | GO:0008629: induction of apoptosis by intracellular signals | NM_011640 | Mm441964_g1 |
| Bbc3 | Bcl-2 binding component 3; PUMA (p53–up-regulated modulator of apoptosis) | GO:0006917: induction of apoptosis | NM_133234 | Mm00519268_m1 |
| Pdcd1 | programmed cell death 1; PD-1 | GO:0006915: apoptosis | NM_008798 | Mm00435532_m1 |
| Aifm1 | apoptosis-inducing factor, mitochondrion-associated 1; AIF, Pdcd8 | GO:0008630: DNA damage response, signal transduction resultin in induction of apoptosis | NM_012019 | Mm0042540_m1 |
| Htra2 | HtrA serine peptidase 2; OMI | GO:0006508: protelysis; GO:0006950: response to stress | NM_019752 | Mm00444847_m1 |
| Fkbp8 | FK506 binding protein 8; Fkbp38 | GO:0007242: intracellular signaling cascade | NM_010223 | Mm00487418_m1 |
| Atg5 | autophagy-related 5 (yeast) | GO:0000045: autophagosome formation | NM_053069 | Mm00504340_m1 |
| Becn1 | beclin 1 (coiled-coil, myosin-like BCL2-interacting protein); human synonym: Atg6 | GO:0006968: cellular defense response | NM_019584 | Mm00517174_m1 |
| Atg12 | Autophagy-related 12 (yeast) | GO:0000045: autophagosome function | NM_026217.1 | Mm00503201_m1 |
| Map1lc3a | Microtubule-associated protein 1 light chain 3 alpha; LC3 | GO:0000045: autophagosome function | NM_025735 | Mm00458724_m1 |
| Frap1 (mTOR) | FK506 binding protein 12- rapamycin associated protein 1 | GO:0007584: response to nutrient | NM_020009.1 | Mm00444968_m1 |
| Tnf | tumor necrosis factor; TNF-alpha | GO:0006919: caspase activation; GO:0006954: inflammatory response | NM_013693 | Mm00443258_m1 |
| Il6 | interleukin 6; Il-6 | GO:0006954: inflammatory response | NM_031168 | Mm00446190_m1 |
| Il10 | interleukin 10; Il-10 | GO:0006954: inflammatory response; GO:0042130: negative regulation of T- cell proliferation | NM_010548 | Mm00439616_m1 |
| Socs3 | suppressor of cytokine signaling 3; STAT-induced STAT inhibitor 3 | GO:0006916: anti-apoptosis | NM_007707 | Mm00545913_s1 |
| Gapdh *** | Glyceraldehydes-3-phosphate dehydrogenase; Gapd | GO:0006096: glycolysis | AK144690 | Mm99999915_g1 |
- Terms selected from curated biological process classifiers in the Gene Ontology Database (www.geneontology.org, date searched 09/19/2008) (39).
- Gene ontology entry refers to a splice variant with a different biologic function.
Gapdh was used as a housekeeping gene to calculate ΔC(t) values as per manufacturer’s instruction.
The reaction was performed in 96-well microtiter plates with an ABI Prism 7500 Sequence Detector System. Primers and reagents were purchased from Applied Biosystems (Table 2). TaqMan glyceraldehyde-3-phosphate dehydrogenase (Gapdh) endogenous control reagent was used as internal control for normalization. Using the manufacturer’s recommendation, the experimental parameters were 95 °C denaturation for 10 minutes followed by 40 cycles of 95 °C for 15 seconds and 60 °C for 1 minute. Cycle threshold values for each gene were determined and abundance in comparison to Gapdh was calculated. qRT-PCR results were recorded for each gene as fold change of CLP mice vs. Sham operated mice at two different time course (8 and 18 hours) using ΔΔC(t) method. PCR products were evaluated by dissociation curves to confirm single amplicons and the absence of significant primer-dimer contamination.
Quantification of autophagy
The salient electron microscopic attribute of autophagy, broadly defined, is the presence of phospholipid bilayers (of surface membrane or organellar origin) or cytoplasmic material within lysosomes (3, 4). More strictly defined, autophagic vacuoles/autophagolysosomes are part of a morphologic spectrum that includes organelles in various states of degradation within membrane-bound vacuoles or lysosomes (28). The early incorporation of organelles into autophagosomes results in the characteristic duplication of membrane material in traditionally defined autophagocytic structures, though with further degradation of lysosomal contents, only a single lysosomal membrane encompasses the phagocytic complex. These structures may have distinct organellar fragments or may consist of complex vacuoles/secondary lysosomes that are more reminiscent of the typical heterolysosome of active phagocytes (e.g., macrophages, Kupffer cells). In acute or recent injury, these structures will contain distinct membrane fragments. In older lysosomal complexes, phospholipids are reduced to electron dense debris (often referred to as ‘residual bodies’, ‘lipochrome pigment’ or ‘lipofuschin’). Because the latter is the end stage of any membrane degradation, the presence of lipochrome pigment in membrane-bound structures or free in cytoplasm cannot be regarded as evidence of active autophagic cell injury. Hence, though noted when present, lipochrome-containing vacuoles were not counted. Lamellae or whorls of membrane material (so-called ‘myelin figures’) are also evidence of membrane degradation and processing, but are not unique to the autophagic pathway. Indeed, many lamellae likely represent the end product of mitochondrial senescence, and are present in varying numbers in most cells as relatively short-lived mitochondria are degraded and replaced.
To provide as unbiased a sample as possible for counting heterolysosomes/autophagocytic structures, representative electron microscopic images prepared by one author (EW) and randomly selected for a given case by a second (PES) were used in each case. To avoid intentional sampling bias in any given image, lower magnification survey images (2500x; approximately 3,000 square microns, each image containing 5–8 hepatocytes and a variable complement of Kupffer cells, stellate cells, sinusoidal endothelial cells and inflammatory cells) were used. The samples were examined by an investigator (PES) blinded to sample identity. Multiple images from a given case were counted, but the data were derived from the mean +/−SD per image from all images pooled for the individual group study populations. Alterations in mitochondria and other organelles, when present, were evaluated in higher magnification images (5,000–25,000x), but because of sample bias, any such changes were not quantified.
The ultrastructural features of apoptosis have been defined elsewhere. For the present purposes, cells with evidence of irregular coarse chromatin condensation in nuclei, together with evidence of nuclear membrane damage or overt nuclear and cellular fragmentation, were regarded as apoptotic. Electron microscopic images from human and mouse livers were selected using the procedure defined for counting autophagocytic structures.
Statistical analysis
To determine significantly different gene expression between CLP and sham, two parameters were evaluated. Fold-change was calculated to determine the magnitude of difference in gene expression and a Student’s t-test P-value was performed to demonstrate the reproducibility of the changes observed in the genes selected. For quantification of autophagic vacuoles, data reported are the mean ± SD. Data were analyzed with the statistical software program PRISM (GraphPad Software, San Diego, CA). All data involving two groups (CLP and sham) were also analyzed by a Student t-test.
Results
qRT-PCR of liver in septic mice demonstrated increased apoptotic but slightly decreased autophagic expression
Table 2 shows the fold change for gene expression in CLP versus sham. There are 15 genes with a P-value below 0.05 at 8 hours after surgery. Of these genes, 6 genes have a fold change above 2.0 and a P-value below 0.05. This shows that these 6 genes are significantly up-regulated after surgical sepsis (CLP). Similarly, there are 12 genes with a P-value below 0.05 at 18 hours after surgery. Of those genes, 5 genes have a fold change above 2.0.
Two pro-apoptotic genes, i.e., Bim and Pdcd1, were markedly increased at 8 hrs in sepsis versus sham, P < 0.05. Surprisingly, the anti-apoptotic gene Bcl-xL was also increased more than 4 fold. At 18 hr. after sepsis surgery, gene expression for Bim remained elevated while expression of Pdcd1 and Bcl-XL returned to the expression level in sham mice. Expression of the autophagic genes was not altered in septic versus sham mice at either 8 or 18 hrs after surgery. In addition to examining gene expression for apoptosis and autophagy, we also determined gene expression levels for a selected group of cytokines. The most impressive increase in gene expression occurred in pro- and anti-inflammatory cytokines and SOCS3, a key regulator of pro-inflammatory cytokines. These classic changes of cytokine-related gene expression validated our CLP model by showing upregulation of prototypical genes involved in sepsis induced inflammation (24, 29).
Clinical samples - sepsis induces mitochondrial injury and a marked increase in autophagic vacuolization
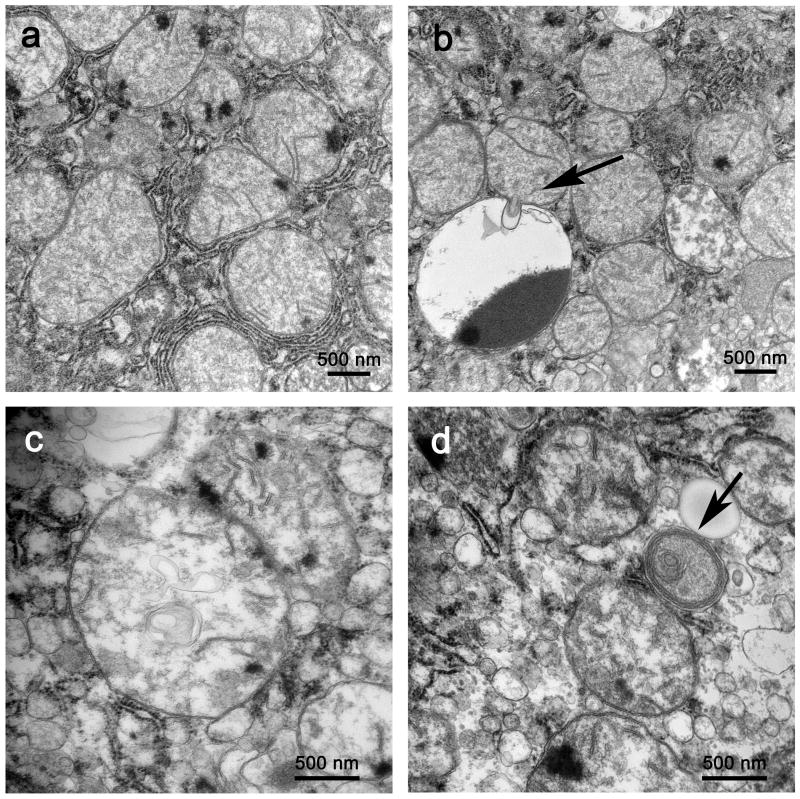
Electron microscopy demonstrated that livers from patients with sepsis had both a reproducible pattern of mitochondrial injury and a significant increase in autophagic vacuolization compared to patients with elective liver biopsies. Though essentially all mitochondria in control patients and the overwhelming majority of mitochondria in septic patients were normal in appearance (Figure 1a), a number of mitochondrial membrane irregularities were seen sporadically in high power electron microscopic images (not quantitated because of sample bias), including herniation of outer membranes into cytoplasm or adjacent mitochondria or other organelles (Figure 1b), intramitochondrial vacuoles (Figure 1c), and early myelin figure-like changes (Figure 1d). Other changes, including prominent matrix granules and crystalline-like inclusions (in both normal-sized and large mitochondria - ‘megamitochondria’) were seen in selected examples of both septic and control liver.
Figure 1.
a. In liver from septic patients, most mitochondria are normal in appearance, with intact organellar membranes. Magnification: 25,000x. b. Mitochondrial membrane injury included herniation of membranes and mitochondrial matrix into adjacent lysosomal structures (arrow). Magnification: 25,000x. c. Vacuoles formed of cristal membranes were present in several mitochondria. As illustrated here, these vacuoles could be numerous. Magnification: 40,000x. d. Orientation of cristae and intramitochondrial membranes fragments in the periphery of a degenerating organelle suggests early ‘myelin figure’ formation (arrow). Magnification: 40,000x.
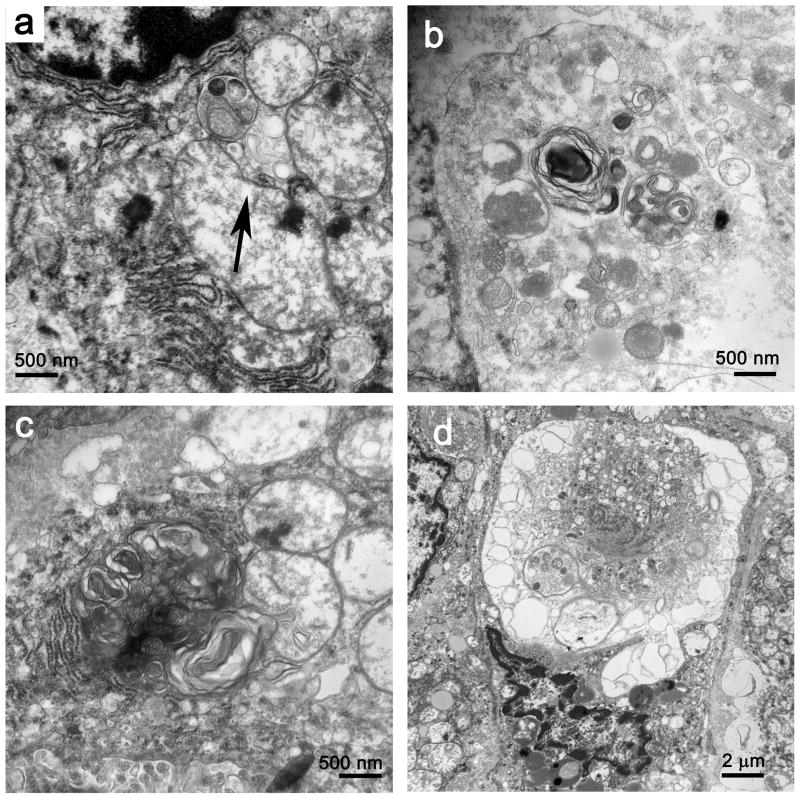
As noted in the methods section, autophagocytic structures were defined as those autolysosomes that contained evidence of recognizeable organelles in various states of degradation (Figure 2a, 2b), whereas ‘heterolysosomes’ represented less obviously organelle-derived phospholipid fragments in secondary lysosomes (Figure 2c). In general, there was no unequivocal evidence that autophagic vacuoles were occurring in cells that were irreversibly committed to cell death in septic patients, although in one patient, cell damage incompatible with cell survival also included extensive autophagocytosis (Figure 2d). Examination of liver samples from the control patients who had elective liver resections revealed only rare cells with discernable autophagosomes; no such structures were identified in low power images randomly selected for counting (as described above). With the foregoing in mind, the differences between control and septic patients were consistent and significant: 1.2 ± 1.5 and 5.3 ± 3.3 (mean ± SD) heterolysosomes/autophagocytic structures per image in control and septic samples, respectively (P < 0.001).
Figure 2.
a. Autophagic vacuoles (autophagosomes) with recognizable organellar fragments assume various sizes and degrees of complexity. A small autophagosome rests near mitochondria with membrane vacuolar injury (arrow). Magnification: 30,000x. b. A larger autophagosome contains mitochondria and other organelles in varying states of degradation, admixed with whorls of membrane-derived material. Magnification: 30,000x c. With loss of discernable organellar fragments, autophagosomes assume a more complex appearance, with redundant whorls of membrane-derived material. This complex lysosomal structure is juxtaposed to and focally invaginates into an adjacent mitochondrion. Magnification: 30,000x. d. In rare cells, extensive autophagolysis is associated with nuclear condensation and generalized organellar injury. These features are consistent with cell death. Magnification: 7,500x.
Inspection of hepatocyte nuclei, endoplasmic reticulum and other membrane-bound organelles in samples from patients with sepsis did not demonstrate any consistent abnormalities and there were no clear differences compared to controls. Marked increases in intracellular lipid were noted in 3 septic and 1 control patient; residual bodies were conspicuous in 1 septic and 2 control samples and generalized dilation of endoplasmic reticulum was noted in a single example of both sepsis and control. There was no indication that damaged mitochondria or autophagosomes were more common in patients who also had fatty livers.
Prominent heterolysosomes were present consistently in Kupffer cells and occasional stellate cells; rare autophagosomes were also identified. Sinusoidal endothelial cells contained occasional complex lysosomal structures, but none with clear organellar fragments. Necrotic cell death and apoptosis were seen only rarely, and with only the exceptional cell noted above, only in non-hepatocellular elements.
Murine sepsis replicates the clinical studies by showing increased hepatocyte autophagosomes
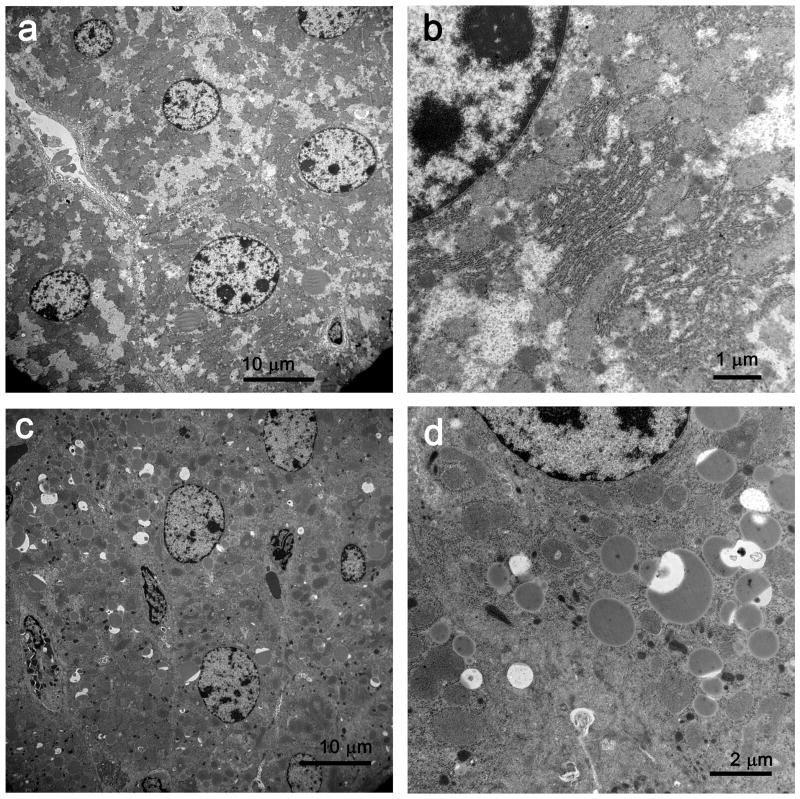
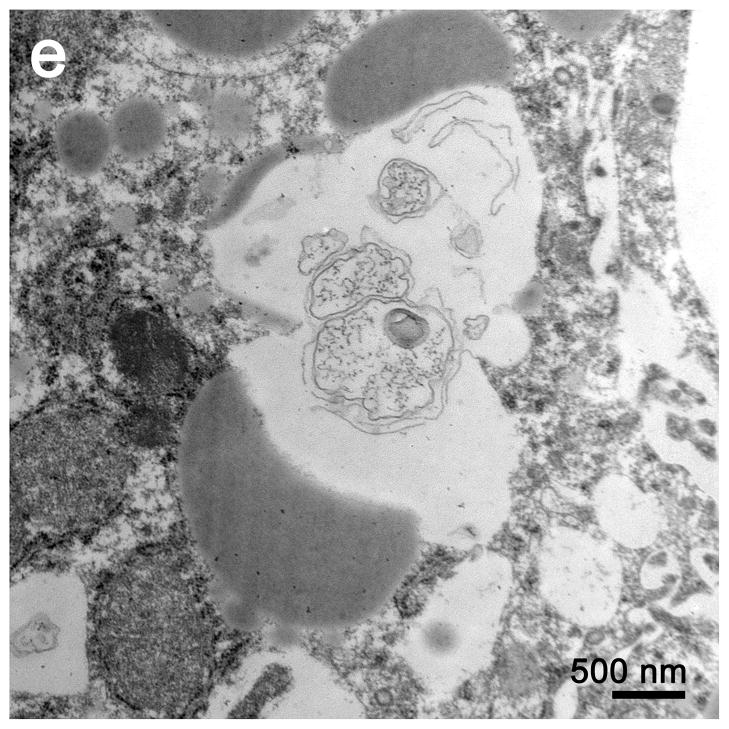
The findings in the livers of septic mice were similar to those in the clinical samples; however, the absolute number of heterolysosomes and autophagosomes was greater in murine samples. Although there was an increase in polymorphonuclear and mononuclear cellular infiltrates observed in the septic livers, there was no evidence of increased hepatocyte cell death. Specifically, there was no evidence of hepatocyte apoptosis or necrosis in the mouse liver at 24 hrs after surgery. TUNEL staining of livers from sham and septic mice showed no difference in the degree of hepatocyte apoptosis in these two groups with the exception of isolated TUNEL positive intra-hepatic lymphocytes in livers from septic mice (data not shown). The increase in heterolysosomes/autophagosomes in the hepatocytes from sham versus septic operated mice (7.2 ± 1.9 versus 38.7 ± 3.9 (mean ± SD) per image, respectively) was also statistically significant (P = 0.002), Figure 3). Despite the increased number of autophagosomes in the septic mice, the cells did not appear to be committed to cell death. Hepatocyte nuclei from sham mice and animals with sepsis had normal chromatin distribution and were without apparent injury or defects (Figure 3a, 3b). The endoplasmic reticulum was mildly dilated in most septic samples, but not in shams. Although the vast majority of hepatic mitochondria appeared normal (Figure 3c), a small percentage (<1%) had membrane bound inclusions/vacuoles that resembled those in septic patients. In addition to the difference in number of autophagosomes between septic humans and mice, phagocytic elements in mice but not humans often incorporated cytoplasmic lipid droplets (Figure 3d, 3e).
Figure 3.
a, In sham liver, hepatocytes are of relatively uniform size; organelles are intact and lysosomes do not contain membrane material. Few lipid vacuoles are present. Magnification: 2,500x. b, At higher magnification, mitochondria and rough endoplasmic reticulum are normal in appearance. Magnification: 15,000x. c, In septic liver, organelles are distributed in a relatively normal fashion, but numerous dilated structures (often associated with lipid) contain membrane fragments and electron dense material. Magnification: 2,500x. d, At higher magnification, the relationship of phagocytic lysosomes to lipid is more apparent. The electron dense material associated with membrane debris is focally membrane-bound, suggesting origin from organelles. Magnification: 10,000x. e, In septic liver, a complex phagolysosome contains abundant membrane debris. Magnification: 25,000x. EM (3,000 square microns) showed 7.2± 1.9 and 38.7±3.9 (mean±SD) complex lysosomal/autophagolysosomal cells in livers of sham and CLP mice, respectively (P = 0.002). There were no reproducible ultrastructural differences in mitochondrial or nuclei in livers of sham vs CLP.
Mouse spleen demonstrated increased apoptosis but no increase in autophagic vacuoles
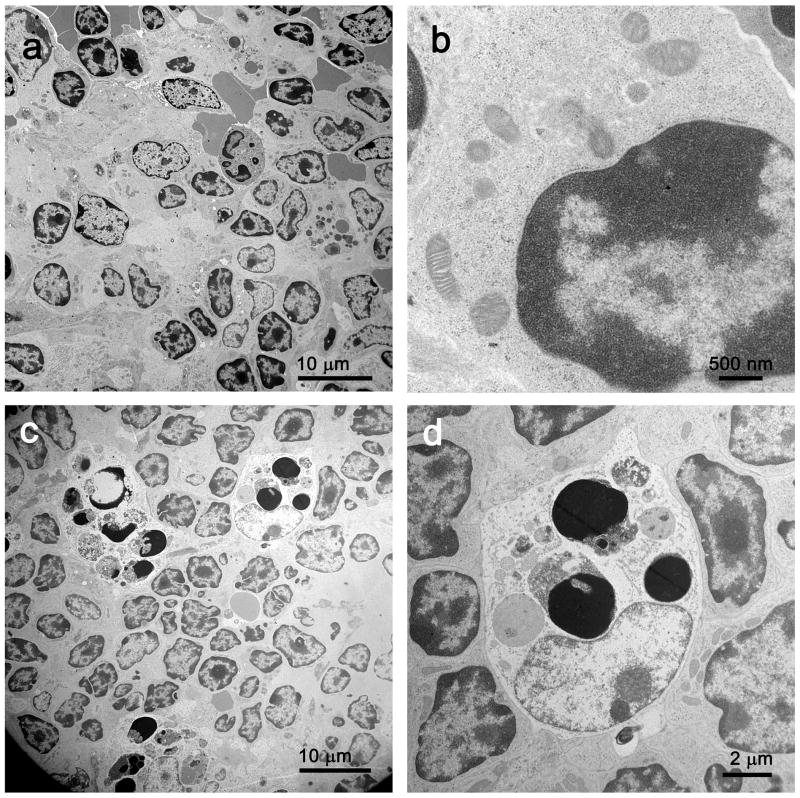
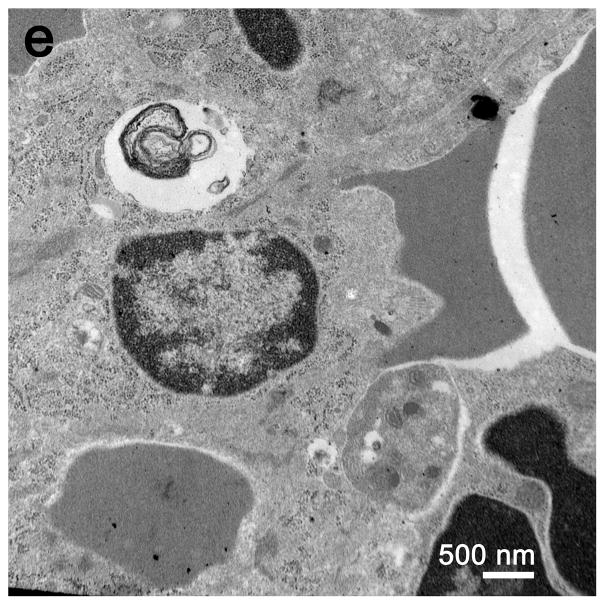
Electron microscopic examination of spleens from septic mice showed numerous apoptotic splenocytes (Figure 4). There was no apparent difference in the number of autophagosomes in the splenocytes in the septic versus the sham operated animals; such structures were noted only sporadically in images selected for review (Figure 4e).
Figure 4.
a, In sham spleen, at low magnification, lymphocytes are normal in appearance without evidence of apoptosis or intracytoplasmic inclusions. Magnification: 2,500x. b, At high magnification, sparse organelles, including mitochondria, are unremarkable. Magnification: 30,000x. c, Although most lymphocytes appear normal, both apoptotic lymphocytes and apoptotic bodies (the latter ingested by macrophages) are apparent. Magnification: 2,500x. d, At higher magnification, apoptotic debris within a macrophage is better visualized. Magnification 10,000x. e, A complex phagolysosome is present within cytoplasm. Magnification: 20,000x. Splenic EM showed numerous lysosomal/autophagolysosomal structures in sham and CLP with no apparent difference.
qRT-PCR of splenic B and CD4+ T cells in septic mice demonstrated slightly decreased autophagic but remarkably increased cytokine-related gene expression
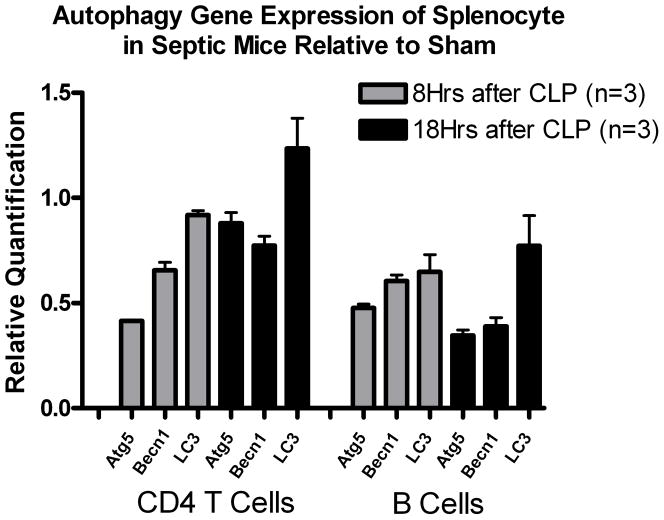
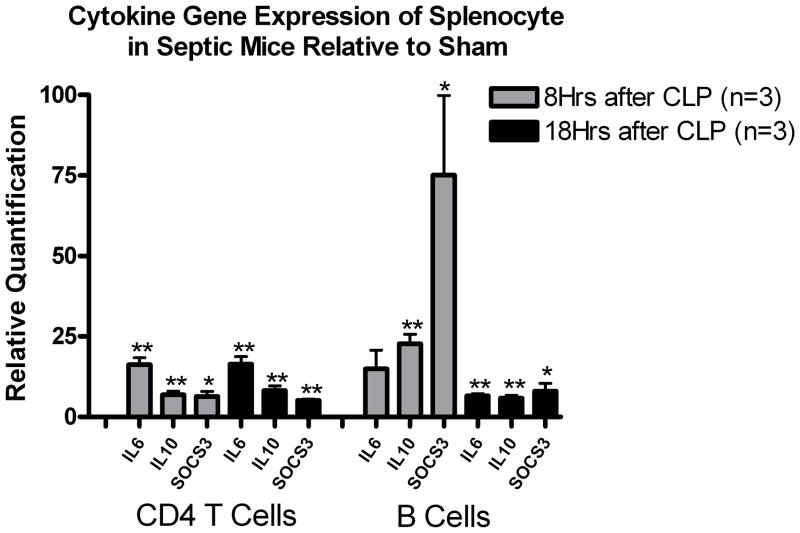
Expression of the autophagic genes was slightly decreased in septic versus sham mice at either 8 or 18 hrs after surgery, but there was a mild trend toward upregulation of all the 3 autophagic genes in CD4+ T cells of septic mice. Pro- and anti-inflammatory cytokines and SOCS3 expressions were remarkably increased at 8 hrs after surgery compared to sham (*P<0.05, ** P<0.01) in B and CD4+ T cells, but decreased by 18 hors in B cells.
Discussion
This is the first clinical study to show that sepsis induces autophagy. Our observations in the livers of mice with sepsis are similar to those from septic patients, validating the relevance of CLP as a model of human sepsis. In general, autophagy is considered to be a survival mechanism that is rapidly upregulated during cellular stress as occurs during nutrient deprivation (5) or growth factor withdrawal (30). During these situations, autophagy functions to provide alternative sources of substrates that are essential for cell survival. In addition, autophagy may theoretically protect against cell death is by elimination of toxic proteins or damaged mitochondria. Defective mitochondria can generate excess reactive oxygen species and release cytochrome c into the cytoplasm which can result in cell injury or the initiation of the intrinsic apoptotic pathway. Studies indicate that cells can tolerate a significant loss in mitochondria without compromise in oxidative phophorylation (19). Autophagy has been shown to play a role in host defense by elimination of intracellular pathogens such as Streptococcus pyogenes(9), Mycobacterium tuberculosis (10) and Shigella flexneri (31). Interestingly, Shigella’s VirG, protein induces bacterial clearance via autophagy through an Atg5 dependent mechanism and pathogenic Shigella evades autophagocytic degradation by secreting IcsB, a protein that blocks the VirG-dependent activation of Atg5 (31). In certain situations of excessive autophagy, cell death may ensue because of loss of essential cellular functions. Autophagic cell death is characterized by the accumulation of massive numbers of cytoplasmic autophagic vacuoles (autophagosomes) in cells that lack signs of apoptosis. With only rare exception, we did not observe this phenomenon. Recent evidence indicates that autophagy can induce apoptotic cell death presumably via common regulators including proteins from the Bcl-2 family (20). In this regard, beclin1, a BH3 protein that is required for the formation of the autophagosome, binds to and inhibits the anti-apoptotic protein Bcl-2. In contrast to findings in the liver, we did not observe an increase in autophagosomes in splenic lymphocytes from mice with sepsis compared to sham-operated animals. As expected, based upon previous studies (12, 16, 17, 25, 32), there were numerous apoptotic splenocytes in septic mice. A previous report from our group showed that sepsis increased the mRNA expression of a number of pro-apoptotic genes including Bim, Pdcd1 and PUMA in CD4+ splenocytes (26) further supporting finding of apoptotic splenocytes in septic animals (Figure 4). Interestingly, PUMA expression in liver was not altered in the same septic animals (Table 3).
Table 3.
Apoptosis, autophagy and inflammation pathway gene expression on cecal ligation and puncture in total liver cells
| Symbol | Fold-change (CLP vs. Sham) (p-value) n = 3 animals for CLP and Sham group, respectively | ||
|---|---|---|---|
| 8 Hrs after surgery | 18 Hrs after surgery | ||
| Apoptosis | Bcl2 | 1.16 (0.415) | −1.25 (0.013) |
| Bcl2l1 (Bcl-XL) * | 4.04 (0.022) | 1.50 (0.018) | |
| Bak1 | 1.17 (0.279) | −1.32 (0.024) | |
| Bax | −1.10 (0.457) | 1.15 (0.476) | |
| Bcl2l11 (Bim) * | 3.52 (0.045) | 3.93 (0.002) | |
| Bid | −1.09 (0.109) | −1.81 (0.031) | |
| Bad * | −3.39 (0.023) | −2.13 (0.056) | |
| Akt1 | −1.82 (0.006) | 1.00 (0.950) | |
| Fasl | 1.91 (0.063) | 1.10 (0.594) | |
| Fadd | −1.48 (0.078) | −2.59 (0.079) | |
| Casp8 | −1.24 (0.026) | 1.25 (0.301) | |
| Trp53 | 1.24 (0.264) | −1.54 (0.326) | |
| Bbc3 (PUMA) * | −4.53 (0.001) | −7.48 (0.002) | |
| Pdcd1 * | 6.36 (0.003) | 2.66 (0.108) | |
| Aifm1 (Pdcd8) * | −1.48 (0.002) | −2.30 (<0.001) | |
| Htra2 (Omi) | −1.58 (0.013) | −1.94 (0.069) | |
| Fkbp8 | −1.22 (0.212) | −2.53 (0.059) | |
| Autophagy | Atg5 | −1.79 (0.007) | −1.40 (0.015) |
| Becn1 | −1.16 (0.148) | 1.01 (0.891) | |
| Atg12 | −1.01 (0.958) | 1.17 (0.135) | |
| Map1lc3a | −1.24 (0.042) | −1.67 (0.081) | |
| Frap1 (mTOR) | −1.44 (0.015) | 1.15 (0.414) | |
| Cytokine | Tnf * | 12.27 (0.065) | 6.65 (0.004) |
| Il6 * | 93.74 (0.009) | 64.65 (<0.001) | |
| Il10 * | 89.90 (0.023) | 59.96 (0.022) | |
| Socs3 * | 16.25 (<0.001) | 13.15 (<0.001) | |
Results are displayed as fold change of mice performed CLP vs Sham surgery, and data are representative of three to four independent samples. Student t-test was performed with each relative quantification value normalized by Gapdh.
Genes whose expression with over than ± 2.0 fold change in CLP relative to Sham, AND P < 0.05.
The reasons for the different degree of observed autophagocytic activity in the liver and spleen are unclear, though it is likely related to the manner in which these tissues transduce signals from septic stimuli. In comparison to hepatocytes, lymphocytes contain fewer mitochondria and have abundant stores of caspases, cell death proteases that are rapidly activated during times of cell stress. Because most lymphocytes are short-lived, it makes sense that these cells do not rely on autophagy to survive acute stress. All of these factors may help explain the relative paucity of autophagic vacuolization observed in spleens from septic patients and septic mice.
A second finding of interest in the present study was the relative lack of non-mitochondrial organelle injury in the hepatocytes in patients with sepsis. Mitochondrial injury, on the other hand, is an expected consequence of cell injury, including bacterial infection/sepsis (14, 28, 33). Isolated mitochondrial preparations from livers of animals with sepsis have shown defects in oxygen utilization, and this may be reflected in the mitochondrial alterations noted in the present study, including vacuole formation, membrane herniation and early myelin figure-like changes seen in septic patients and mice. Similar vacuolar changes in liver mitochondria of septic mice were noted recently by Crousier et al (14). It is important to note that the vast majority of mitochondria in septic samples showed no abnormalities, suggesting that the extent of injury as well as the time point when tissues were sampled may be significant determinants of the degree of organellar injury observed. We postulate that these changes, though related to injury, may in part reflect a sepsis-induced increase in the turnover in this labile organellar population and that the extent of organellar damage we observed was below the threshold for the initiation of the intrinsic apoptotic pathway. Previous reports from our group showed that focal hepatic necrosis and focal hepatic apoptosis occurred in 35% and 15% of septic patients respectively (16). We did not observe either apoptosis or necrosis in the 6 patients examined by electron microscopy in this study; however, it is important to note that the present manuscript is an electron microscopy study which provides high resolution data about only small regions of the liver and spleen whereas previous reports have been based predominantly on histologic surveys of larger tissue sections.
Despite the increase in autophagic vacuolization, there was no increase in autophagic gene transcription (Table. 3). The proteins that are essential for autophagy to proceed are most likely already present within the cells. Autophagy-related proteins are presumably regulated via post-transcriptional mechanisms, including protein-protein interactions, post-translational modifications and regulation of their subcellular localization (34). Martinet et al. have also failed to find increased autophagic gene transcription despite the presence of definite cell autophagy (34). On the other hand, Shimizu et al demonstrated in an in vitro study that non-apoptotic (i.e. autophagic) programmed cell death was mediated by imbalance between anti-apoptotic Bcl-2/BclxL and pro-apoptotic Bax/Bak. In that study, BclxL, which had increased transcription in the present study, was required for autophagic cell death of Bax/Bak double knockout mouse embryonic fibroblasts (35). The abundance of the Bcl-xL transcript was increased by approximately 4-fold in this study, possibly indicating that there is a role for Bcl-xL in hepatocyte autophagy. Furthermore, Jia et. al have shown that the pro-inflammatory cytokine TNF-αupregulates autophagy gene expression of Map1lc3 and also induces Beclin 1protein in human atherosclerotic vascular smooth cells (36). All of these results are consistent with the qRT-PCR results in the present study which support those previous studies that suggest interactions among autophagy, apoptosis, and cytokine related molecules.
The observational nature of this study does not allow us to determine what role sepsis-induced hepatic autophagy has in the pathophysiology of sepsis. We cannot determine if the observed autophagy is pathologic, ultimately resulting in cell death, or an adaptive mechanism that is activated during the stress of sepsis. There is increasing evidence that the autophagic machinery can be utilized to kill cells under certain conditions via a caspase-independent form of programmed cell death (37). A similar difficulty in determining whether autophagy is beneficial or detrimental to survival of cancer cells has also been discussed recently (38). The use of mice with defects in autophagic machinery may allow investigators to address the issue of the beneficial versus adverse effects of autophagy and such studies are currently underway in our laboratory.
In conclusion, there is a marked increase in hepatocyte autophagocytosis in both patients with sepsis and in a clinically relevant animal model of sepsis. There was no evidence of systemic nuclear or endoplasmic reticulum injury in hepatocytes during sepsis, but mitochondrial injury was observed. In contrast to its effect on hepatocytes, sepsis did not induce autophagy in splenocytes; rather, apoptosis was the predominant form of cell death in the latter population. Whether the extensive autophagy documented in the present study has beneficial or adverse effects in sepsis remains unknown.
Figure 5.
Figure 5a and 5b. Quantitation of messenger RNA in CD4 T and B cells at 8 and 18 hours after sepsis.
Each gene shown is quantified relative to levels of sham operated mice. We show here that pro-and anti-inflammatory cytokines and SOCS3 expressions are increased early when compared to sham (*P<0.05, ** P<0.01) and decreased during the time course. Expression of the autophagic genes was not increased in septic versus sham mice at either 8 or 18 hrs after surgery.
Acknowledgments
This work was supported by National Institutes of Health Grants GM055194, GM044118, K08 GM084143, and the Alan A. and Edith L. Wolff Foundation.
References
- 1.Clark SL., Jr Cellular differentiation in the kidneys of newborn mice studies with the electron microscope. J Biophys Biochem Cytol. 1957;3:349–362. doi: 10.1083/jcb.3.3.349. [DOI] [PMC free article] [PubMed] [Google Scholar]
- 2.Ashford TP, Porter KR. Cytoplasmic components in hepatic cell lysosomes. J Cell Biol. 1962;12:198–202. doi: 10.1083/jcb.12.1.198. [DOI] [PMC free article] [PubMed] [Google Scholar]
- 3.Seglen PO, Berg TO, Blankson H, et al. Structural aspects of autophagy. Adv Exp Med Biol. 1996;389:103–111. doi: 10.1007/978-1-4613-0335-0_12. [DOI] [PubMed] [Google Scholar]
- 4.Mortimore GE, Miotto G, Venerando R, et al. Autophagy. Subcell Biochem. 1996;27:93–135. doi: 10.1007/978-1-4615-5833-0_4. [DOI] [PubMed] [Google Scholar]
- 5.Kuma A, Hatano M, Matsui M, et al. The role of autophagy during the early neonatal starvation period. Nature. 2004;432:1032–1036. doi: 10.1038/nature03029. [DOI] [PubMed] [Google Scholar]
- 6.Cuervo AM. Autophagy: many paths to the same end. Mol Cell Biochem. 2004;263:55–72. doi: 10.1023/B:MCBI.0000041848.57020.57. [DOI] [PubMed] [Google Scholar]
- 7.Huang J, Klionsky DJ. Autophagy and human disease. Cell Cycle. 2007;6:1837–1849. doi: 10.4161/cc.6.15.4511. [DOI] [PubMed] [Google Scholar]
- 8.Pattingre S, Levine B. Bcl-2 inhibition of autophagy: a new route to cancer? Cancer Res. 2006;66:2885–2888. doi: 10.1158/0008-5472.CAN-05-4412. [DOI] [PubMed] [Google Scholar]
- 9.Nakagawa I, Amano A, Mizushima N, et al. Autophagy defends cells against invading group A Streptococcus. Science. 2004;306:1037–1040. doi: 10.1126/science.1103966. [DOI] [PubMed] [Google Scholar]
- 10.Gutierrez MG, Master SS, Singh SB, et al. Autophagy is a defense mechanism inhibiting BCG and Mycobacterium tuberculosis survival in infected macrophages. Cell. 2004;119:753–766. doi: 10.1016/j.cell.2004.11.038. [DOI] [PubMed] [Google Scholar]
- 11.Bursch W, Ellinger A, Gerner C, et al. Programmed cell death (PCD). Apoptosis, autophagic PCD, or others? Ann N Y Acad Sci. 2000;926:1–12. doi: 10.1111/j.1749-6632.2000.tb05594.x. [DOI] [PubMed] [Google Scholar]
- 12.Hotchkiss RS, Karl IE. The pathophysiology and treatment of sepsis. N Engl J Med. 2003;348:138–150. doi: 10.1056/NEJMra021333. [DOI] [PubMed] [Google Scholar]
- 13.Lorente JA, Marshall JC. In: Sepsis: Clinical Critical Care Medicine. Albert R, Slutsky A, Ranieri MV, et al., editors. Philadephia, PA: Elsvier; 2006. pp. 589–602. [Google Scholar]
- 14.Crouser ED, Julian MW, Huff JE, et al. Carbamoyl phosphate synthase-1: a marker of mitochondrial damage and depletion in the liver during sepsis. Crit Care Med. 2006;34:2439–2446. doi: 10.1097/01.CCM.0000230240.02216.21. [DOI] [PubMed] [Google Scholar]
- 15.Baker CC, Chaudry IH, Gaines HO, et al. Evaluation of factors affecting mortality rate after sepsis in a murine cecal ligation and puncture model. Surgery. 1983;94:331–335. [PubMed] [Google Scholar]
- 16.Hotchkiss RS, Swanson PE, Cobb JP, et al. Apoptosis in lymphoid and parenchymal cells during sepsis: findings in normal and T- and B-cell-deficient mice. Crit Care Med. 1997;25:1298–1307. doi: 10.1097/00003246-199708000-00015. [DOI] [PubMed] [Google Scholar]
- 17.Hotchkiss RS, Tinsley KW, Swanson PE, et al. Sepsis-induced apoptosis causes progressive profound depletion of B and CD4+ T lymphocytes in humans. J Immunol. 2001;166:6952–6963. doi: 10.4049/jimmunol.166.11.6952. [DOI] [PubMed] [Google Scholar]
- 18.Pyo JO, Jang MH, Kwon YK, et al. Essential roles of Atg5 and FADD in autophagic cell death: dissection of autophagic cell death into vacuole formation and cell death. J Biol Chem. 2005;280:20722–20729. doi: 10.1074/jbc.M413934200. [DOI] [PubMed] [Google Scholar]
- 19.Luo S, Rubinsztein DC. Atg5 and Bcl-2 provide novel insights into the interplay between apoptosis and autophagy. Cell Death Differ. 2007;14:1247–1250. doi: 10.1038/sj.cdd.4402149. [DOI] [PubMed] [Google Scholar]
- 20.Pattingre S, Tassa A, Qu X, et al. Bcl-2 antiapoptotic proteins inhibit Beclin 1-dependent autophagy. Cell. 2005;122:927–939. doi: 10.1016/j.cell.2005.07.002. [DOI] [PubMed] [Google Scholar]
- 21.Hotchkiss RS, Swanson PE, Freeman BD, et al. Apoptotic cell death in patients with sepsis, shock, and multiple organ dysfunction. Crit Care Med. 1999;27:1230–1251. doi: 10.1097/00003246-199907000-00002. [DOI] [PubMed] [Google Scholar]
- 22.Kanehisa M, Goto S. KEGG: kyoto encyclopedia of genes and genomes. Nucleic Acids Res. 2000;28:27–30. doi: 10.1093/nar/28.1.27. [DOI] [PMC free article] [PubMed] [Google Scholar]
- 23.Keir ME, Butte MJ, Freeman GJ, et al. PD-1 and its ligands in tolerance and immunity. Annu Rev Immunol. 2008;26:677–704. doi: 10.1146/annurev.immunol.26.021607.090331. [DOI] [PMC free article] [PubMed] [Google Scholar]
- 24.Wu RQ, Xu YX, Song XH, et al. Relationship between cytokine mRNA expression and organ damage following cecal ligation and puncture. World J Gastroenterol. 2002;8:131–134. doi: 10.3748/wjg.v8.i1.131. [DOI] [PMC free article] [PubMed] [Google Scholar]
- 25.Wagner TH, Drewry AM, Macmillan S, et al. Surviving sepsis: bcl-2 overexpression modulates splenocyte transcriptional responses in vivo. Am J Physiol Regul Integr Comp Physiol. 2007;292:R1751–1759. doi: 10.1152/ajpregu.00656.2006. [DOI] [PubMed] [Google Scholar]
- 26.Brahmamdam P, Watanabe E, Unsinger J, et al. Targeted delivery of siRNA to cell death proteins in sepsis. Shock. doi: 10.1097/SHK.0b013e318194bcee. in press. [DOI] [PMC free article] [PubMed] [Google Scholar]
- 27.Cobb JP, Laramie JM, Stormo GD, et al. Sepsis gene expression profiling: murine splenic compared with hepatic responses determined by using complementary DNA microarrays. Crit Care Med. 2002;30:2711–2721. doi: 10.1097/00003246-200212000-00016. [DOI] [PubMed] [Google Scholar]
- 28.Ghadially FN. Mitochondria: Ultrastructural Pathology of the Cell and Matrix. 4. Vol. 1. Newton, MA: Butterworth-Heineman; 1997. pp. 195–342. [Google Scholar]
- 29.Kabay B, Kocaefe C, Baykal A, et al. Interleukin-10 gene transfer: prevention of multiple organ injury in a murine cecal ligation and puncture model of sepsis. World J Surg. 2007;31:105–115. doi: 10.1007/s00268-006-0066-9. [DOI] [PubMed] [Google Scholar]
- 30.Lum JJ, Bauer DE, Kong M, et al. Growth factor regulation of autophagy and cell survival in the absence of apoptosis. Cell. 2005;120:237–248. doi: 10.1016/j.cell.2004.11.046. [DOI] [PubMed] [Google Scholar]
- 31.Ogawa M, Yoshimori T, Suzuki T, et al. Escape of intracellular Shigella from autophagy. Science. 2005;307:727–731. doi: 10.1126/science.1106036. [DOI] [PubMed] [Google Scholar]
- 32.Schwulst SJ, Muenzer JT, Peck-Palmer OM, et al. Bim siRNA decreases lymphocyte apoptosis and improves survival in sepsis. Shock. 2008;30:127–134. doi: 10.1097/shk.0b013e318162cf17. [DOI] [PubMed] [Google Scholar]
- 33.Crouser ED, Julian MW, Dorinsky PM. Ileal VO(2)-O(2) alterations induced by endotoxin correlate with severity of mitochondrial injury. Am J Respir Crit Care Med. 1999;160:1347–1353. doi: 10.1164/ajrccm.160.4.9810116. [DOI] [PubMed] [Google Scholar]
- 34.Martinet W, De Meyer GR, Andries L, et al. In situ detection of starvation-induced autophagy. J Histochem Cytochem. 2006;54:85–96. doi: 10.1369/jhc.5A6743.2005. [DOI] [PubMed] [Google Scholar]
- 35.Shimizu S, Kanaseki T, Mizushima N, et al. Role of Bcl-2 family proteins in a non-apoptotic programmed cell death dependent on autophagy genes. Nat Cell Biol. 2004;6:1221–1228. doi: 10.1038/ncb1192. [DOI] [PubMed] [Google Scholar]
- 36.Jia G, Cheng G, Gangahar DM, et al. Insulin-like growth factor-1 and TNF-alpha regulate autophagy through c-jun N-terminal kinase and Akt pathways in human atherosclerotic vascular smooth cells. Immunol Cell Biol. 2006;84:448–454. doi: 10.1111/j.1440-1711.2006.01454.x. [DOI] [PubMed] [Google Scholar]
- 37.Klionsky DJ. Autophagy: from phenomenology to molecular understanding in less than a decade. Nat Rev Mol Cell Biol. 2007;8:931–937. doi: 10.1038/nrm2245. [DOI] [PubMed] [Google Scholar]
- 38.Marx J. Autophagy: is it cancer’s friend or foe? Science. 2006;312:1160–1161. doi: 10.1126/science.312.5777.1160. [DOI] [PubMed] [Google Scholar]
- 39.Ashburner M, Ball CA, Blake JA, et al. Gene ontology: tool for the unification of biology. The Gene Ontology Consortium. Nat Genet. 2000;25:25–29. doi: 10.1038/75556. [DOI] [PMC free article] [PubMed] [Google Scholar]


