Abstract
Background and Objectives
Photothermal (PT) responses of individual red blood cells (RBC) to short laser pulses may depend upon PT interactions at microscale.
Study Design/Materials and Methods
A sequence of identical short laser pulses (0.5 and 10 nanoseconds, 532 nm) was applied to individual RBCs, and their PT properties were analyzed at microscale in real time after each single pulse.
Results
PT interactions in RBC were found to be localized to sub-micrometer zones associated with Hb that may be responsible for overheating and evaporation at higher optical energies. At sub-ablative energies, a single short laser pulse induced irreversible changes in the optical properties of RBC that stimulated the transition from a heating-cooling response to ablative evaporation in individual erythrocytes during their exposure to subsequent, but identical pulses.
Conclusion
The PT response of RBCs to short laser pulses of specific energy includes localized irreversible modifications of cell structure, resulting in three different effects: thermal non-ablative response, ablative evaporation, and residual thermal response.
Keywords: pulsed laser, blood, bubble, photo-coagulation, photothermal, ablation
INTRODUCTION
Laser diagnostics, therapy, and surgery of various organs often involve red blood cells (RBC) due to the high optical absorbance of hemoglobin (Hb) and high concentration in many organs. For high optical energies such a response has a thermal nature and includes heating and various secondary processes (conformational changes, denaturation, coagulation, vapor bubble generation, shock waves, etc.). These phenomena are referred as photothermal (PT) and depend upon the initial laser-induced temperature, which, in turn, depends upon the laser parameters (wavelength, energy, and duration) and upon the optical absorbance and bio-chemical properties of the target. It was found that PT effects in RBC do not always correlate with the optical absorption spectrum of blood [1–18], because PT interactions alter the erythrocyte properties at the cellular and molecular levels. It was also found that laser radiation can induce both transient and permanent changes in the absorbing protein which influences the photodamage thresholds of Hb solutions and RBCs [1,2,5–7,9]. All these effects are directly related to the efficacy and safety of clinical applications of high-energy laser radiation and were therefore examined carefully. Several explanations for these phenomena have been previously suggested including a bathochromic shift of the iron porphyrin complexes [1,6,7,10,19–21], transition of Hb from oxy-state into met-state [4,6,7,14,22–24], changes in RBC shape [3,5–7,11,15], and protein aggregation and denaturation [10,25–41].
Our understanding of laser–blood interaction (especially in the high-energy pulsed mode of laser treatment) is still limited. First, most results are obtained using macrosamples of whole blood or for Hb solutions and do not take into account the real-time dynamics and heterogeneity of PT interactions at micro- and even nanoscale. Second, responses to pulsed laser treatment are usually considered as the accumulated effects of multiple pulses and without monitoring real-time changes of RBC or Hb during their irradiation. Third, relatively long optical pulses do not allow the efficient administration of laser-induced heat to the target because thermal losses due to heat diffusion require to increase optical fluence in order to compensate them, and the same thermal diffusion also decreases the selectivity of the thermal effect.
We hypothesized that the dynamic changes in the PT properties of RBC at microscale may occur rapidly enough to influence the response of same RBC to a subsequent and identical laser pulse. Such a set of consecutive effects may, in turn, influence the safety and efficacy of laser therapy and surgery. In this work we studied the responses of single human RBC to short individual laser pulses with sufficient temporal resolution in order to analyze the real-time changes in the PT properties of intact human RBCs.
METHODS AND MATERIALS
Samples
Four types of samples were investigated: individual human RBC, stroma-free Hb from the same erythrocyte sample (~95% pure solution of Hb), blood plasma, and a simple solution of trypan blue dye. While our main sample represented single RBCs, we have applied several controls: stroma-free Hb from the RBC lysate was prepared to test the effects on a concentrated Hb solution in the absence of the cell membrane and other cytoskeletal compounds. Blood plasma represented proteins present in whole blood without the strongly absorbing red cells (albumin, globulin, and fibrinogen). This protein solution has practically no optical absorbance at the wavelength of excitation, 532 nm. Dye solution represented a non-protein optically absorbing solution.
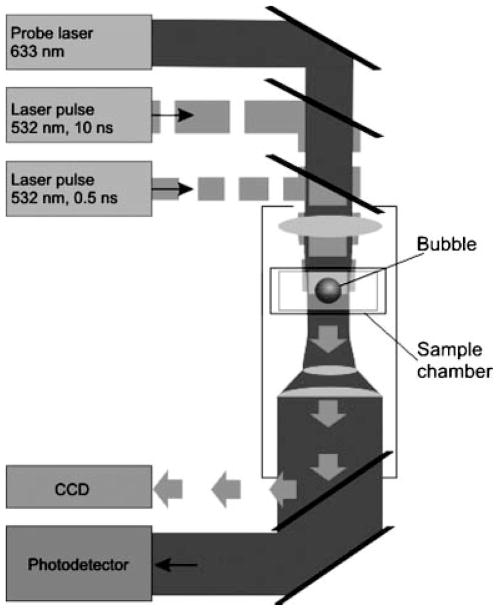
Human RBC were obtained from fresh whole blood of male and female volunteers, which was diluted with phosphate-buffered saline (PBS) (pH 7.35) by 450 times. Monolayers of individual cells were studied in sealed chambers (S-24737 Molecular Probes, Inc., Eugene, OR) between two parallel glasses slide base and cover slip. All measurements were done at room temperature. Each individual cell was placed in the center of the laser beam and then irradiated with a single laser pulse (Fig. 1).
Fig. 1.
The microscope-based set up for a short-pulse treatment of individual cells and solutions and for optical detection of their photothermal responses and for measuring their optical density.
The stroma-free Hb solution from RBC lysates was obtained from the same samples of blood as described previously [42,43]. The advantage of this form of Hb over lyophilized one in that the latter is oxidized and partially denatured itself. The RBCs were washed by several centrifugations using NaCl buffer solution to remove plasma proteins and white cells. Hemolysis of RBC was carried out by resuspending RBC in distilled water. The red cell membranes were removed by centrifugation at 3,000 rpm for 60 minutes and the cell debris pellets were discarded. The supernatant containing Hb was then further purified and made aseptic by passage through a 0.22 μm filter (09-719A, Fisher Scientific, Pittsburgh, PA). The concentration of Hb was varied by diluting the sample in various amounts of PBS buffer. Stroma-free Hb was also studied in a sealed volume between two parallel glasses. The vertical gap between the two glasses was maintained by adding spherical polystyrene particles (Spherotech, Inc., Libertyville, IL) to the solution. A low concentration of 10 μm particles provided the required gap (equal to particle diameter) between the glasses. Only areas of solution without microparticles were irradiated by the pump laser pulse. In this case, heated space was confined by the laser beam diameter, and by the vertical gap between slide and cover glasses. We used the same samples of blood that were diluted two times with PBS (pH7.35) to prepare the blood plasma. The diluted blood was centrifuged at 5,000 rpm for 10 minutes and supernatant was removed and used as the plasma control. Trypan blue solution (T8154, Sigma, St. Louis, MO) was additionally purified with a 0.22 μm filter, was diluted with distilled water, and was then prepared as described above. The optical properties of all samples were verified with RedTide USB 650 spectrometer (Ocean Optic, Inc., Dunedin, FL).
Experimental Setup
The PT effect of individual laser pulses was studied using the laser microscope developed by us [44]. As a source of heat we used individual focused laser pulses (532 nm, 0.5 and 10 nanoseconds). Short laser pulse mode provides what is known as “thermal confinement condition” [45], when all initial laser-induced heat stays within the individual cell and does not dissipate outside. This allows the precise measurement and analysis of PT effects in individual cells. A microvolume of a sample (or the whole individual cell) was exposed to a single pulse with the diameter of 7 μm at the sample plane. Laser pulse fluence was gradually varied with a polarizing optical filter and was monitored by simultaneous detection of the pulse energy (with laser energy detector 11XLE4, Standa Ltd, Vilnius, Luthuania), and of the pulse image (with CCD camera Luca S, And or Technology, Belfast, Northern Ireland) (Fig. 1). The diameter of the beam was obtained from the image of the laser pulse and the pulse fluence was determined as the ratio of the pulse energy to the pulse area at the sample plane. Both durations were supposed to be short enough to prevent significant thermal diffusion. Absorbance of a laser pulse generated local heating within the cell or within the aperture of laser pulse in solutions. Depending on the initially induced temperature, the sample responded by heating and cooling (due to thermal diffusion after the termination of laser pulse) or, (when the laser-induced temperature exceeded the evaporation threshold) by generating vapor bubbles. Both of these PT effects were detected optically using the pump-probe thermal lens method [46] based on local heating creating a gradient of refractive index. The latter was monitored with continuous He–Ne laser (633 nm, 10 μm diameter at the sample plane, model 1135P, JDS Uniphase Corporation, CA, Milpitas, CA) which was coaxially focused with pump laser pulses in the sample plane. Its axial intensity at the exit from the sample was monitored with photodetector (PD510A, Newton, NJ) as the PT time response of the sample [46]. PT responses for reversible heating-cooling and for laser-induced vapor bubbles are very different and have specific shapes which allowed us to identify and to quantify specific processes [46]. For the heating-cooling process, the maximal amplitude of PT response is linearly proportional to maximal laser-induced temperature of absorbing sample [46]. In a case of a laser-induced vapor bubble, the PT response changes shape and its duration corresponds to the bubble lifetime and diameter [46–49].
In each sample, PT responses to laser pulses were obtained separately for 20–50 different cells (or microvolumes of solutions). The individual response represented one cell (or one point of solution) irradiated with the pump laser pulse of specified fluence. The evaporation mode was characterized by the probability of bubble generation:
| (1) |
where N is the amount of bubble-specific PT responses and N1 is the amount of irradiated objects. In case of treatment with multiple laser pulses, PT responses were detected for each laser pulse.
To determine an ablation threshold, values of PRB were obtained at several pulse fluencies, so that the one corresponding to PRB being 0.5 was defined as the bubble generation threshold ε(0.5) for a given sample.
The relative change of optical absorbance K of the laser-treated microvolume of a sample (or of an individual cell) was measured by monitoring the amplitude of the image I of an additional low energy pulse (fluence about 10 μJ/cm2) at the same wavelength (532 nm) that was passed through the sample collinearly with the excitation laser pulse (532 nm, 10 or 0.5 nanoseconds) before and after the excitation pulse. The images of the probe laser were registered with a CCD camera and the coefficient K was calculated as:
| (2) |
where I0 is the averaged pixel amplitude in the sample image before laser treatment, Ibc is the background signal for I0, I1 is the averaged pixel amplitude in the sample image after laser treatment, Ibc1 is the background signal for I1. This coefficient allowed us to monitor a relative change of the static component of optical absorbance of the sample volume that had been exposed to the excitation laser pulse, and thus to independently monitor the optical state of the sample.
RESULTS
PT Response of Red Blood Cells to Single Short Laser Pulses
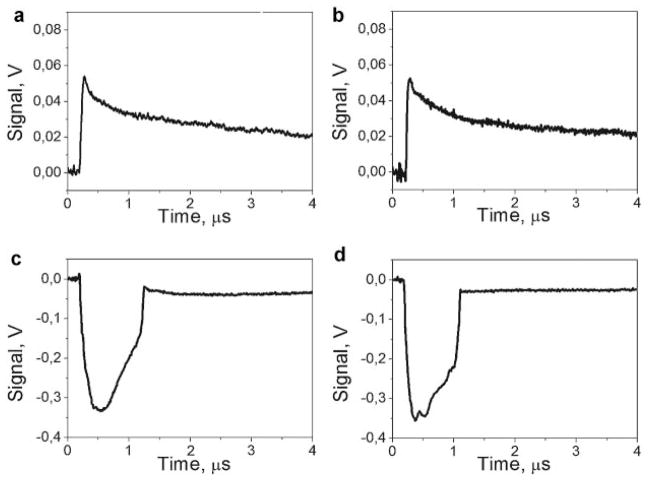
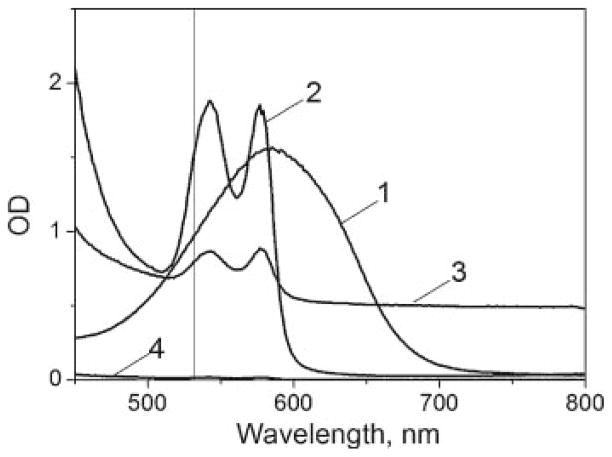
We obtained the PT responses to single laser pulses (532 nm) of 0.5 and 10 nanoseconds duration for individual RBC and for the several controls: stromal free Hb, blood plasma and a non-organic optically absorbing solution of trypan blue dye. Unlike the cells, the controls represented solution confined in the 10 μm gap between two parallel glasses. The fluence of laser pulses was adjusted experimentally to a level below the evaporation threshold for each sample and was then gradually increased to and above the evaporation threshold. We monitored the transition from the laser-induced heating (Fig. 2a,b) to the laser-induced generation of vapor bubbles (Fig. 2c,d) through the process-specific shape of the PT responses [46]. The only sample that did not return any signals in the full range of laser fluences (up to 4 J/cm2) was blood plasma because this sample has <0.01 optical density at 532 nm (see Fig. 3). Protein components of the plasma have 200-fold lower concentration compared to Hb and do not include light-absorbing pigments like the iron-porphyrin found in Hb. Based on this result, we associated the obtained PT responses of RBC with optical absorbance by Hb and the plasma samples were excluded from further studies.
Fig. 2.
Photothermal responses of RBC to the laser pulses (532 nm, 10 nanoseconds) at three different fluence levels as obtained with the probe laser beam: Low fluence (0.8 J/cm2): (a) response to the first pulse shows heating (sharp front) and cooling after the pulse termination (not shown in full), (b) response to the second identical pulse shows an almost identical response; high fluence (2.5 J/cm2): (c) response to the first pulse shows an ablative vapor bubble, (d) response to the second identical pulse shows an almost identical response (the bubble); intermediate fluence (2.0 J/cm2). Cooling tails of the responses shown in (a) and (b) are not completely shown because of the cooling time of about 10 microseconds.
Fig. 3.
Extinction spectra of trypan blue solution (1), RBC lysate (2), blood (3), and blood plasma (4). Vertical line corresponds to wavelength 532 nm.
Our observed PT responses represent the effect of laser excitation integrated over the whole cell (or over the whole heated area of the Hb and dye solutions). Integrated cooling times (τ) were found to be similar for most of the samples (about 10–20 microseconds) and they were determined by the size of the heated object (d) and by the thermal diffusivity (a) of the liquid environment. They can be estimated from the expression [45,50]:
| (3) |
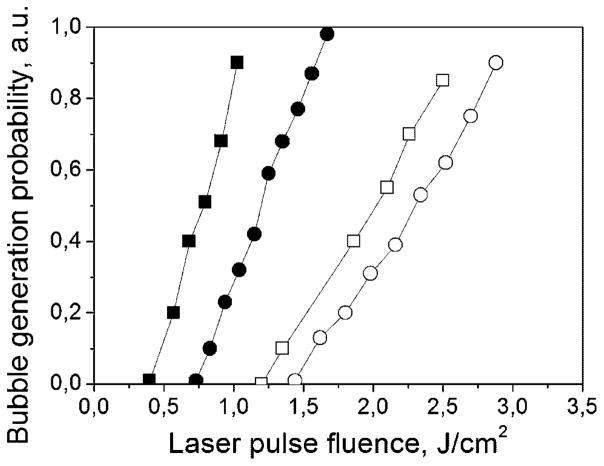
The τ value (measured at the level of 0.5 relative to the initial maximum) estimates for human RBCs with a diameter of 7–8 μm in isotonic buffer are in the range of 13–17 microseconds, which are close to the experimentally observed cooling times for the 0.5 nanoseconds and for 10 nanoseconds laser pulses. However, when we compared the bubble generation threshold fluences for short and long laser pulses (Table 1), the situation dramatically changed. This threshold corresponds to the specific temperature associated with the onset of evaporation, and a vapor bubble can be detected through a shape-specific PT response (Fig. 2c,d). The fluence threshold of vapor formation for a long 10 nanoseconds pulse was found to be 2.5 times higher for RBCs, 1.9 times higher for stroma-free Hb, and almost identical for the dye solution. In addition, we measured the probabilities (PRB) of vapor bubble generation in individual RBC and in the solution of stroma-free Hb for both pulses (Fig. 4). Under identical laser fluence, the bubbles were generated with a short laser pulse but not with a longer laser pulse, as we observed both for the cells and their lysate. These changes indicated that the increase of the pulse duration mainly influenced the bubble generation conditions in the samples with localized optical absorbers (RBC) while the homogeneously absorbing sample did not yield the dependence of the bubble generation threshold upon pulse duration. The level of the laser fluence required for the bubble generation depends upon the spatial scale of optical absorbance and heat release. When the optical absorption occurs homogeneously over the whole volume of the sample, the evaporation threshold does not depend upon the duration of the deposition of thermal energy, assuming that the time of such deposition is much shorter than the thermal relaxation time (which was close to 20 microseconds for RBC in our case). The threshold fluence of the bubble generation begins to depend upon the duration of the laser pulse when the thermal relaxation time becomes comparable to the pulse duration. For the pulses under consideration this would mean the size of the absorbing target being in sub-micrometer range. Our results indicated a strong difference in the evaporation threshold for 10 and 0.5 nanoseconds pulse both for RBC and for Hb solutions but not for the dye solutions. Earlier we observed a similar effect for optically absorbing nanoparticles with even stronger difference in the evaporation thresholds for the same laser pulses [51]. Therefore, we assumed that optical absorbance by RBC might have been spatially very heterogeneous.
TABLE 1.
Laser Pulse Fluence Thresholds for the Generation of Vapor Bubbles (J/cm2)
| Sample | Fluence (J/cm2) for bubble formation
|
|
|---|---|---|
| 0.5 nanoseconds pulse | 10 nanoseconds laser pulse | |
| RBC | 0.8 | 2.0 |
| RBC lysate | 1.2 | 2.3 |
| Solution of trypan blue dye | 2.6 | 2.7 |
| Blood plasma | No evaporation was observed | No evaporation was observed |
Fig. 4.
The probability of the generation of laser-induced vapor bubbles in RBC and their lysate as a function of the fluence of short (0.5 nanoseconds) and long (10 nanoseconds) single laser pulses: ■, RBC, 0.5-nanoseconds laser; □, RBC, 10-nanoseconds laser; ●, RBC lysate, 0.5-nanoseconds laser; ○, RBC lysate, 10-nanoseconds laser.
To check this assumption, we studied in detail the PT responses of RBC and of trypan blue dye to the shortest available pulse of 0.5 nanoseconds. The shorter optical excitation provided better temporal resolution for monitoring fast thermal processes. The PT response of the trypan blue sample in Figure 5a showed heating and gradual cooling with the characteristic cooling time being about 19 microseconds. However, in the case of RBC, we observed an additional, short component in the response (Fig. 5b). While the characteristic cooling time for RBC remained the same (about 15 microseconds) as for a long pulse, the front of the PT response to 0.5 nanoseconds pulse yielded an additional short component with a much shorter relaxation time of about 5 nanoseconds. Such a relaxation time was shorter than the duration of the long excitation pulse and corresponded to the characteristic size of a heated domain of about 136 nm (as estimated with the expression 3). The presence of a short component in the RBC response indicated the localized nature of laser-induced heating. This, in turn, may explain the difference in the evaporation thresholds for a long and a short pulse (Table 1): the dissipation of heat from those nanodomains is fast enough to decrease the efficacy of the energy deposition with a relatively long laser pulse (like 10 nanoseconds in our case). These “hot spots” in RBC may act as the sites of vapor bubble nucleation at the fluence level that is not sufficient for the vaporization of the bulk material. These two results (dependence of the bubble generation threshold upon the pulse length and the short-time component in RBC response) suggest that the spatial distribution of the main optical absorber in RBC, Hb, can be quite heterogeneous at micro- and even nanoscale, with the existence of the localized nanodomains with a high level of optical absorption at 532 nm. The study of the biological and chemical mechanisms behind this result is beyond the scope of this work. Here we would like to point out that this “localized” PT effect was observed for a single, short laser pulse. With an increase in the pulse duration, the influence of local high-absorbing zones decreases due to the effect of thermal diffusion, explaining why such an effect cannot be observed with longer pulses or with continuous optical radiation.
Fig. 5.
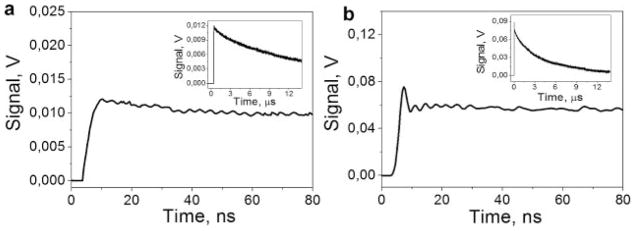
The photothermal responses of trypan blue dye (a) and an individual RBC (b) to a short 0.5 nanoseconds single laser pulse: Fronts of the responses are shown with high temporal resolution, while the insets show the full time scale of the same responses.
The Response of Red Blood Cells to Multiple Laser Pulses
We monitored the PT responses of all four samples to the several identical laser pulses at the three fluence levels and two durations of laser excitation: below the evaporation threshold, close to, and above the evaporation threshold. The laser pulses were applied to the cells with the variable delay (from 70 milliseconds to 100 seconds). The low fluence (heating) responses were similar and reproducible for all pulses (Fig. 2a,b). The high fluence (bubble mode) responses were also found to be rather similar, although the second response was a little shorter due to the bubble-induced disruption of the cell [52] that caused leakage and large dilution of Hb (Fig. 2c,d). These two situations were in line with current understanding of laser-blood interaction. However, at the sub-threshold level of laser fluence, the second laser pulse caused a response that was totally different from the response to the first laser pulse (Fig. 6a,b): it changed from the simple heating (non-ablative) type to generation of a vapor bubble (ablative), despite the identical laser fluences of each pulse. After several additional pulses, there was a deterioration of the bubble-specific response until only heating-type response was observed (Fig. 6c), due presumably to complete the disruption of RBC, dilution of Hb, and deterioration of the heme pigment (the disruption of the cell was monitored optically through its bright field image). The effect of the transition from heating to ablative evaporation after a single laser pulse was observed both for 0.5 nanoseconds and for 10 nanoseconds pulses. Such a dramatic change in the response of individual RBCs to high-intensity laser radiation has not been reported previously and required further examination.
Fig. 6.

Photothermal responses of the RBC to the laser pulses (532 nm, 10 nanoseconds): (a) response to the 1st pulse, heating (sharp front) and cooling after the pulse termination (not shown in full); (b) response to the second identical pulse, generation of a vapor bubble, (c) response to the pulse with the number >30.
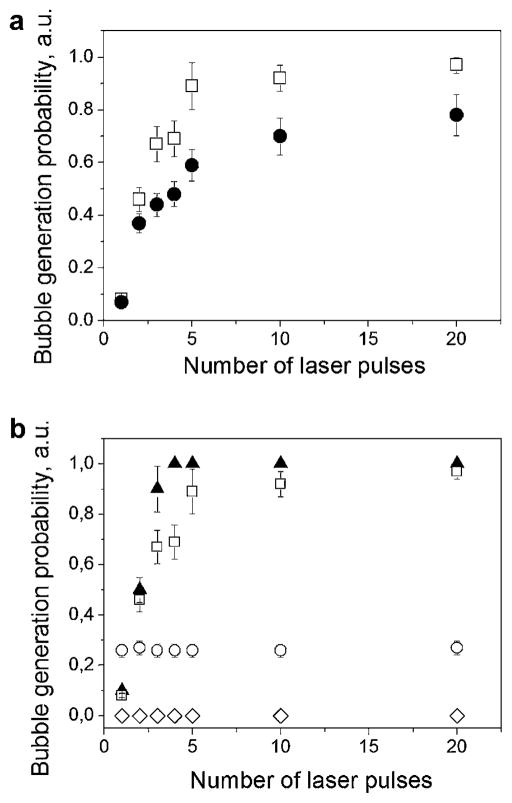
To examine this effect further, we measured the probability of the ablative (vapor bubble type) response as a function of the number of laser pulses applied to the same object with 1s intervals. The bubble generation probability rapidly increased from almost zero for the 1st pulse (no bubble) to a high probability of bubble generation during the 2nd and 3rd laser pulses (Fig. 7). We also found that this effect did not depend upon the time interval between the pulses in the range from 0.07 to 100 seconds and thus the effect of the first pulse can be considered irreversible. We also observed a difference between the probabilities after 0.5 and 10 nanoseconds pulses (Fig. 7a). Although the difference in the cell responses developed in a more pronounced way for longer pulses, the general trend observed was quite similar. The biggest difference was observed between the first and the second pulses, and then the probability of bubble formation gradually decreased for the next subsequent pulses. This means that major laser-induced modification of RBC occurred after the first pulse. To understand the nature of the observed modification of the PT properties of the cells, we compared four samples under identical laser illumination conditions: RBC, stroma-free Hb, an absorbing dye and blood plasma (Fig. 7b). The fluences of laser pulses (532 nm, 10 nanoseconds) were fixed at specific levels for each sample level that was below the threshold of bubble generation. The responses to the 2nd and the subsequent pulses differed somewhat between RBCs and its lysate, stroma-free Hb also showed a marked increase in the probability of bubble formation after the 1st excitation pulse. In contrast, the solution of strongly absorbing trypan blue dye yielded no such changes (Fig. 7b). No changes were also observed for the plasma sample, but because of its lack of absorbance at 532 nm, no bubbles are seen under any conditions. Thus, it appears that the first laser pulse and subsequent heating to the sub-boiling temperatures stimulates irreversible modification of the light absorbing properties of Hb in RBC. This effect appears to be specific for Hb or perhaps heme proteins in general (including myoglobin and reduced cytochrome c, subjects of another research), for example, by causing the irreversible changes of local concentration and (or) alterations of the heme group and its optical absorption coefficient, which reduce the evaporation threshold fluence. Since the volume of such an absorbing domain can be rather small (10−20 m3 and less or less than 0.01% of the cell volume), any local increase of optical absorbance or concentration should not influence the cell-averaged values of the corresponding parameters. To examine this hypothesis further, we performed additional experiments with stroma-free Hb.
Fig. 7.
The probability of ablation (bubble generation) in the sample as a function of the number of pulses applied to the samples for: (a) stroma-free Hb and two durations of laser pulses (□, 10 nanoseconds at 1.9 J/cm2; ●, 0.5 nanoseconds at 0.8 J/cm2); (b) RBCs (▲), stroma-free Hb (□), blood plasma (◇), and trypan blue dye (○) solutions for 10 nanoseconds pulse (laser pulse fluence was 1.7 J/cm2 for RBC, 1.9 J/cm2 for RBC lysate, 2.5 J/cm2 for blood plasma and trypan blue solution).
Photothermal Properties of Stroma-Free Hb Under Pulsed Laser Irradiation
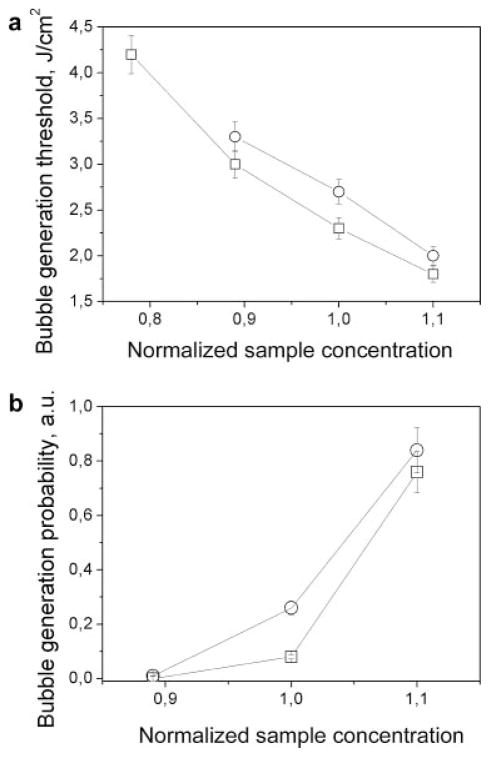
We compared the PT responses of concentrated Hb and trypan blue samples as a function of their concentration since the concentration determines an actual optical absorbance. First, we measured the evaporation threshold fluence in a single pulse mode as a function of the relative concentration (the level 1.0 was the level of the concentration of the previously studied samples, Fig. 8a). Both samples yielded quite a predictable result: an increase in the concentration reduced the bubble generation fluence thresholds and increased the probabilities of bubble generation (Fig. 8b). An increase in the concentration of optical absorber causes an increase in optical absorbance, which in turn increases the laser-induced local temperature and generates bubbles at lower fluence.
Fig. 8.
The vapor bubble generation parameters as a function of the concentration of the solution of RBC lysate (□) and trypan blue (○): (a) threshold fluence for 10 nanoseconds single laser pulse (532 nm) and (b) probability of bubble generation (laser pulse fluence 2.5 J/cm2 for trypan blue solution and 1.9 J/cm2 for RBC lysate).
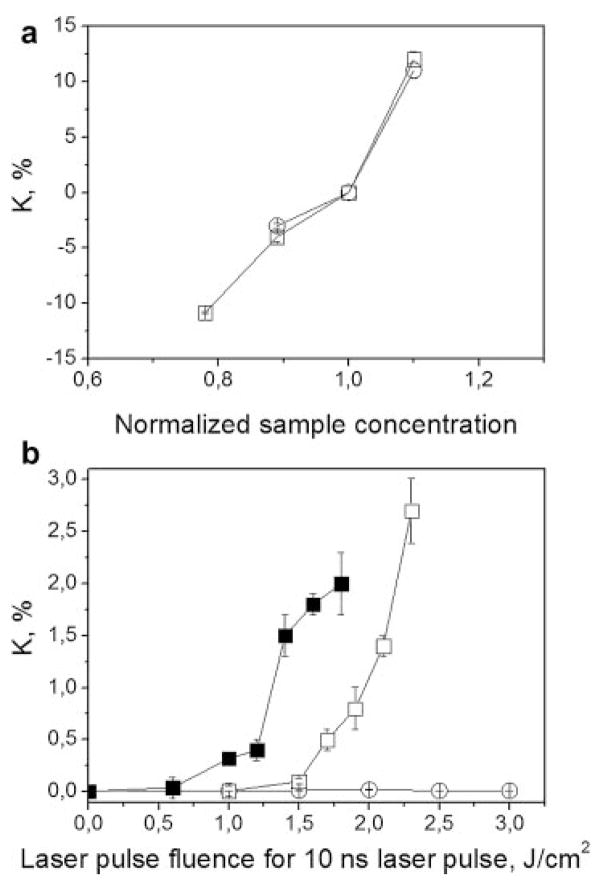
We next monitored the relative change of optical absorbance of the sample at 532 nm as the function of the fluence of the excitation laser pulse. The relative change of optical absorbance was characterized by the coefficient of K that was initially obtained as a function of the sample concentration, as was done earlier for the bubble generation threshold and probability. We observed an increase of K with the concentration for both the samples (Fig. 9a). Positive values of K indicated an increase in optical absorbance relative to that of the initial sample (with the relative concentration being 1.0). Negative values of K indicated a decrease in optical absorbance. After validating this method and K, we studied its dependence upon the fluence of single 10 nanoseconds laser pulses at sub-threshold range (Fig. 9b). The exposure of the solution of trypan blue did not induce any changes in the level of K which remained at 1.0 in the full range of applied fluences up to its evaporation threshold. This means that the optical absorption coefficient of the trypan blue dye did not change after exposure to laser pulse at any level of fluence.
Fig. 9.
Dependence of the relative change of optical absorbance K (532 nm) of RBC lysate (□) and trypan blue solution (○) upon: (a) relative concentration of the solution (the sample concentration was increased or decreased relative to the previously used levels), (b) fluence of a single 10 nanoseconds laser pulse at 532 nm (□, stroma-free Hb; ○, trypan blue solution; ■, stroma-free Hb with the concentration increased by 10%).
In contrast to the simple organic dye, the stroma-free Hb was studied at the two different concentrations (initial and increased by 10%) and showed a significant dependence of the coefficient K (that indicates the relative change in optical absorption) upon the fluence of the pre-treating laser pulse. The relative change of optical absorption (K) of Hb increased gradually with the increasing fluence of the initial pulse (Fig. 9b). This effect was found to be irreversible and the values of K did not depend upon time delay (that was varied from 1 to 100 seconds.) between exposure to the excitation laser pulse and the measurement of K. Furthermore, we additionally observed the influence of the Hb concentration on its optical absorption coefficient (Fig. 9b). In the RBC lysate sample with 10% higher concentration, the absorption coefficient became fluence-dependent at a lower fluence of the pre-treating pulse. This implies that the modification of optical absorbance has a thermal mechanism, since at a higher concentration of absorber, the same laser-induced temperature of evaporation was achieved at a lower fluence of laser pulse.
The fluence threshold for effect of the first pulse on the absorption coefficient of stroma-free Hb is 1.7–1.8 J/cm2, which is lower than the bubble generation threshold for the same sample (2.3 J/cm2). These findings allowed us to assume that a single laser pulse at a fluence level below the evaporation threshold irreversibly increased the local optical absorbance of the Hb sample. According to Figure 8b, the increase in the concentration of the same sample by 10%was sufficient to generate the vapor bubble during the exposure of the same area of Hb solution to the second laser pulse.
The bubble generation threshold fluence for stroma-free Hb after the 0.5 nanoseconds single laser pulse was measured as the function of the fluence of pre-treating pulse (Fig. 10). The data clearly show that the bubble generation threshold fluence for a 0.5 nanoseconds pulse also became fluence-dependent (Fig. 10). The threshold of the pre-treating fluence for this effect was 1.5–1.75 J/cm2. Comparing Figures 9b and 10 we have found that threshold fluence of laser pulse that influenced optical absorbance was 1.7–1.8 J/cm2 and threshold fluence of laser pulse fro the bubble generation was 1.5–1.75 J/cm2. Since these two processes have quite similar thresholds, we assumed that they can be connected and involve one mechanism related to the irreversible laser-induced changes in optical absorbance and in the evaporation threshold fluence of Hb. These two results may directly explain the previously described effect of the transition of the PT response of RBCs and stroma-free Hb from the thermal type (during the exposure to the first laser pulse) to the evaporation type (during the exposure to the second identical pulse) (Figs. 6 and 7). The first laser pulse irreversibly increased optical absorbance and thus decreased the minimal fluence required to evaporate the absorbing zone (in other words, it decreased the bubble generation threshold). Such a modification was stable enough (for the times up to 100 seconds) so that by the time of exposure to the next identical pulse the evaporation threshold was exceeded causing the vapor bubble generation in the same sample. The above results can be considered as the confirmation of our hypothesis about the laser pulse-induced irreversible modification of the PT properties of RBC Hb.
Fig. 10.
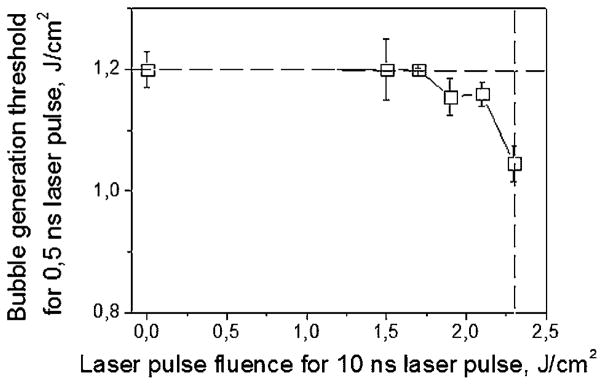
Bubble generation threshold fluence in RBC lysate for a single 0.5 nanoseconds pulse (532 nm) as a function of the fluence of pre-treating single 10 nanoseconds pulse (532 nm). Dashed lines show the bubble generation fluence threshold for 10 nanoseconds pulse (vertical), and 0.5 nanoseconds pulse (horizontal).
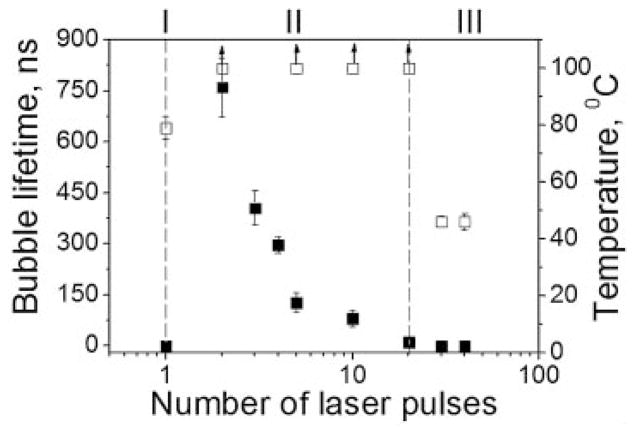
The application of the subsequent identical laser pulses to RBCs revealed the onset of the next set of changes after the generation of the first vapor bubble (Fig. 11).
Fig. 11.
Bubble lifetime (■) and estimated laser-induced temperature (□) versus pulse number at fixed sub-ablative fluence level for RBCs, three modes of PT interaction are presented: I, non-ablative thermal impact during the first pulse; II, mechanically ablative vapor bubble during the next pulses; III, non-ablative residual thermal impact (laser pulse 10 nanoseconds, 532 nm).
We detected the PT response of a thermal type (Fig. 6a) during the first pulse, and the evaporation type response (Fig. 6b) during the second pulse (Fig. 11). However, each subsequent pulse induced bubbles with a shorter lifetime, and the bubbles completely disappeared after 25–40 pulses and then only small amplitude thermal responses are observed (Fig. 6c). In contrast, such a transition from evaporative mode back to thermal mode was not observed for stroma-free Hb, which continued to generate bubbles. Thus, the loss of bubble formation during the third stage of the PT responses can be associated with the disruption of the cell and dilution of the optical absorber, Hb, into the surroundings.
Finally, we found that the deoxygenation of Hb and the variation of the pH level from 5 to 8 did not influence laser-induced modification of the PT response after a single pulse. Although these parameters influenced the bubble generation thresholds for the first pulse (because these parameters are very sensitive to Hb and RBC state and, see Refs. [46–49,53–56] for details, including bubble generation in non-Hb proteins), they did not influence the nature of the laser-induced modification of the PT response after a single pulse.
DISCUSSION
Our results have that there are three different stages of the PT response of RBC to laser pulses (Fig. 11):
Non-ablative thermal PT response during the first pulse (stage I).
Mechanically ablative vapor bubble generation during the next pulses (stage II).
Non-ablative residual PT response of relatively low amplitude (stage III).
Pulsed optical pre-treatment of RBC changed its PT response from non-ablative after the first pulse to ablative after subsequent pulses, even if the initial laser fluence was below the ablation threshold. In order to understand the mechanism responsible for this “second pulse” effect (that has never been reported previously), we have tried to estimate the laser-induced temperatures increases in the RBC or stroma-free Hb solutions. Presumably evaporation occurs when the laser-induced local temperature exceeds 100°C (Fig. 12, stage II) and, according to our data, this requires the fluence of 2.3 J/cm2 for 10 nanoseconds pulse at 532 nm. Assuming an ambient room temperature of 20°C, the temperature jump is about 80°C. Therefore, the threshold fluence of the first pulse effect (1.6–1.8 J/cm2 in the same sample of Hb) probably induces a proportionally lower temperature jump resulting in sample temperatures of 75–83°C (Figs. 11 and 12, for stage I). In terms of biological temperature thresholds, the latter estimate is close to the threshold for denaturation of oxy-Hb (that may also be accompanied by Hb coagulation) [2,9,26,27,32,33,57]. Thermal Hb denaturation has been reported to cause the formation of protein aggregates and Heinz bodies containing hemichrome complexes [4] which, in turn, may further stimulate the aggregation of native, non-denatured protein [5,6]. A similar effect was observed after a long (10 milliseconds) laser pulse at 532 nm [7], however, the thresholds of the aggregation were higher (3.6–4.4 J/cm2) than those in our results. This difference is readily explained by thermal losses in the irradiated sample at the longer pulses.
Fig. 12.
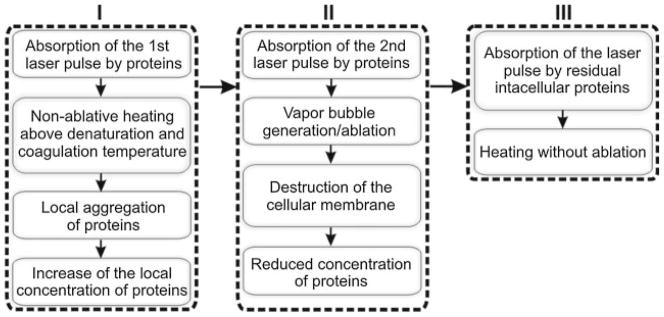
A three-stage mechanism for pulsed laser treatment of blood: I, initial non-ablative thermal impact; II, ablative impact; III, residual non-ablative thermal impact. Stage I: absorption of the first laser pulse by proteins induces non-ablative response (heating), but if the temperature is above the denaturation and coagulation threshold it will cause local aggregation of proteins and local increase of the concentration of proteins to the degree that the absorption of the 2nd, identical laser pulse will result in vapor bubble generation and transition to the ablative stage II; generation of the bubbles will disrupt the cellular membrane and will thus eject light-absorbing protein out of the cell, reducing its concentration below the ablation threshold and eventually terminating the bubble generation and returning to the residual thermal stage (III) with much lower temperatures than at stage I.
In general, the shorter was the pulse, the higher the laser-induced temperature. This rule was clearly demonstrated in our work by the reduced threshold or bubble generation to 0.5 nanoseconds pulse compared to 10 nanoseconds pulse (Table 1). The authors of [7] reported this threshold to be above 4 J/cm2, and reported temperatures in the range of 80–90°C that were close to our above estimates. Therefore, we suggest that the first pulse causes the aggregation of Hb that increases its density and optical absorbance (Fig. 12). Thus, our experimental observation of the localized nature of the PT responses (Fig. 5b) may be considered as additional evidence of Hb aggregation into nanodomains.
The coagulation of Hb has also been shown to increase optical absorbance [9,28,58–60]. If these processes take longer than the duration of the first laser pulse, the effect of this pulse will be limited to heating but not to vaporization and ablation (as we observed). However, if the aggregation develops by the time of arrival of the next laser pulse, the modified optical density and absorbance of the sample may provide a higher temperature and vapor bubble generation (Fig. 6b). This mechanism of laser-induced modification of Hb (and proteins in general) is shown in Figure 12. The mechanism for increasing Hb concentration in the local nanodomains can be different and may depend upon many variables such as transition from oxy-Hb to met-Hm, hemin loss, aggregation, and precipitation [9,10,25–27,61]. A study of these mechanisms is beyond the scope of the current work but will be pursued in future work. Regarding the potential influence of the deoxygenation and transition from oxy-Hb to met-Hb we may just note that photo- and thermally induced changes of Hb state were reported not to significantly influence its optical absorbance at 532 nm [19–21,62].
In the evaporative (bubble) mode (stage II) the vapor bubbles disrupt the cellular membrane. which if the fluence is high enough can happen during the one/single pulse [8]). Cell lysis will in turn lead to diffusion of the light-absorbing Hb from the cell causing a large dilution of the absorbing species. Thus, each consequent pulse in this mode (stage II) is absorbed by the residual Hb, whose concentration is rapidly decreasing and, eventually, the extent of absorption drops below the bubble generation threshold. This situation is what we refer to as stage III (Figs. 11 and 12) when the cell is destroyed, Hb is diluted into the surround fluid, and optical absorbance is markedly decreased. The concentration of Hb at this stage is much lower than its intracellular concentration and, therefore, the laser-induced temperature elevation during stage III is much lower than during stage I (compare Fig. 6a and c). We estimated the laser-induced temperatures during this stage based on the relative amplitudes of the PT responses in stage III versus stage I (Fig. 6a vs. c), and they were found to be much lower with a maximum temperature of ≤50°C.
The small irradiated volume of the sample did not allow us to monitor dynamically the absorption spectra of such a sample. We modified the pump-probe method (as described in the Methods and Materials Section) to provide the time-resolved monitoring of optical density of the microvolume at the excitation wavelength of 532 nm. Also, we were able to detect and to differentiate such transient events as the generation of vapor bubbles and laser-induced heating. Additional monitoring of optical density at the excitation (pumping) wavelength of 532 nm (which almost coincides with one of the maximums of Hb optical absorbance) provided independent control of the optical properties of the sample.
We suggest that the mechanism (Fig. 12) that depends upon the temperature induced by the first pulse and the pulsed laser treatment involving blood may follow several routes. (1) The temperature is below the protein aggregation threshold (Fig. 2a,b), and the responses to the first and subsequent pulses (or the response in single- and multi-pulse modes) are identical and associated with non-ablative heating of the laser targets. (2) The temperature is above the ablation/vaporization threshold (Fig. 2b,c), and the responses to the first and second pulses (or the response in single- and multi-pulse modes) are also identical and associated with ablation of the laser target that occurs during the first pulse. (3) The temperature is above the protein aggregation threshold (70–80°C) but be low the ablation threshold (100°C), and the responses to the first and second pulses (or the response in single- and multi-pulse modes) are no longer identical, single-pulse mode is associated with non-ablative heating and the subsequent pulses are associated with the ablation of the target that is followed by the residual thermal impact after the target (RBC) is destroyed.
Although cases 1 and 2 have been well studied and documented with simple dyes, the existence of the transient multi-stage zone (case 3) has not previously documented. However, case 3 can be important for laser hyperthermia and surgerical methods because in real tissue the spatial heterogeneity of the concentration of optically absorbing protein would inevitably cause the heterogeneity of the laser-induced maximal temperatures that may exceed the evaporation thresholds for case 1. Therefore, when ablation must be avoided, a single-pulse mode is preferable and allows the delivery of the highest thermal impact. To the contrary, when ablation has to be achieved, the multi-pulse mode allows for operating at lower energies and temperatures although is limited to a certain number of pulses.
CONCLUSIONS
We conclude that a single short laser pulse at fluence level below the evaporation threshold, but above the threshold for protein denaturation and coagulation, may irreversibly change the PT properties of RBCs (and concentrated Hb solutions) causing the transition of the cell response from a non-ablative heating mode to an ablative bubble generation mode. This “second pulse effect” was verified for pulse durations from 0.5 and 10 nanoseconds at 532 nm and was not observed for optically absorbing dye solutions where denaturation and aggregation of the pigment does not occur. Furthermore, we discovered that the PT interactions that cause Hb denaturation in RBCs include formation of small zones of nanosize (about 136 nm) of presumably aggregated Hb that may be responsible for localized overheating upon exposure to subsequent laser pulses and for irreversible modification of RBC. These findings influence laser medicine suggesting two opposite modes of high-energy pulsed laser applications. The non-ablative applications may benefit from a single-pulse mode assuming relatively high optical energy without the ablation of RBC. Ablative applications may be realized at the decreased optical energies by employing a multi-pulse mode.
Acknowledgments
Contract grant sponsor: NIH; Contract grant number: 1R21CA133641, 1R01GM094816, GM035649, HL047020; Contract grant sponsor: Robert A. Welch Foundation; Contract grant number: C0612.
Authors acknowledge support from NIH through the research grants 1R21CA133641 and 1R01GM094816 to DOL and GM035649, HL047020, and grant C0612 from Robert A. Welch Foundation to JSO, and thank Ms. Sue Parminter for proofreading the manuscript.
References
- 1.Verkryusse W, Nilsson AMK, Milner TE, Beek JF, Lucassen GW, van Gemert MJC. Optical absorption of blood depends on temperature during a 0. 5 ms laser pulse at 586 nm. Photochem Photobiol. 1998;67:276–281. [PubMed] [Google Scholar]
- 2.Mordon S, Rochon P, Dhelin G, Lesage LC. Dynamics of temperature dependent modifications of blood in the near-infrared. Laser Surg Med. 2005;37:301–307. doi: 10.1002/lsm.20238. [DOI] [PubMed] [Google Scholar]
- 3.Nilsson A, Lucassen GW, Verkryusse W, Andersson-Engels S, van Gemert MJC. Changes in optical properties of human whole blood in vitro due to slow heating. Photochem Photobiol. 1997;65:366–373. doi: 10.1111/j.1751-1097.1997.tb08572.x. [DOI] [PubMed] [Google Scholar]
- 4.Randeberg LL, Bonesronning JH, Dalaker M, Nelson JS, Svaasand LO. Methemoglobin formation during laser induced photothermolysis of vascular skin lesions. Laser Surg Med. 2004;34:414–419. doi: 10.1002/lsm.20042. [DOI] [PubMed] [Google Scholar]
- 5.Barton JK, Popok D, Black OA. Thermal analysis of blood undergoing laser photocoagulation. IEEE J Sel Topics Quant Electron. 2001;7:936–943. [Google Scholar]
- 6.Black JF, Barton JK. Chemical and structural changes in blood undergoing laser photocoagulation. Photochem Photobiol. 2004;80:89–97. doi: 10.1562/2004-03-05-RA-102.1. [DOI] [PubMed] [Google Scholar]
- 7.Black JF, Wade N, Barton JK. Mechanistic comparison of blood undergoing laser photocoagulation at 532 and 1,064 nm. Laser Surg Med. 2005;36:155–165. doi: 10.1002/lsm.20134. [DOI] [PubMed] [Google Scholar]
- 8.Barton JK, Rollins A, Yazdanfar S, Pfefer TJ, Westphal V, Izatt JA. Photothermal coagulation of blood vessels: A comparison of high-speed optical coherence tomography and numerical modeling. Phys Med Biol. 2001;46:1665–1678. doi: 10.1088/0031-9155/46/6/306. [DOI] [PubMed] [Google Scholar]
- 9.Pfefer T, Choi B, Vargas G, McNally K, Welch A. Pulsed laser-induced thermal damage in whole blood. J Biomech Eng. 2000;122:196–202. doi: 10.1115/1.429642. [DOI] [PubMed] [Google Scholar]
- 10.Wood BR, Hammer L, Davis L, McNaughton D. Raman micro-spectroscopy and imaging provides insights into heme aggregation and denaturation within human erythrocytes. J Biomed Opt. 2005;10:14005. doi: 10.1117/1.1854678. [DOI] [PubMed] [Google Scholar]
- 11.Tan OT, Murray S, Kurban AK. Action spectrum of vascular specific injury using pulsed irradiation. J Invest Dermatol. 1989;92:868–8871. doi: 10.1111/1523-1747.ep12696885. [DOI] [PubMed] [Google Scholar]
- 12.Hohenleutner U, Walther T, Wenig M, Baumler M, Landthaler M. Leg telangiectasia treatment with a 1.5 ms pulse due laser, ice cube cooling of the skin and 595 vs. 600 nm: Preliminary results. Lasers Surg Med. 1998;23:72–78. doi: 10.1002/(sici)1096-9101(1998)23:2<72::aid-lsm4>3.0.co;2-s. [DOI] [PubMed] [Google Scholar]
- 13.Tuchin V, Zhestkov D, Bashkatov A, Genina E. Theoretical study of immersion optical clearing of blood in vessels at local hemolysis. Opt Express. 2004;12:2966–2971. doi: 10.1364/opex.12.002966. [DOI] [PubMed] [Google Scholar]
- 14.Suthamjariya K, Farinelli WA, Koh W, Anderson RR. Mechanisms of microvascular response to laser pulses. J Invest Dermatol. 2004;122:518–525. doi: 10.1046/j.0022-202X.2004.22241.x. [DOI] [PubMed] [Google Scholar]
- 15.Baranov VY, Chekhov DI, Leonov AG, Leonov PG, Ryaboshapka OM, Semenov SY, Splinter R, Svenson RH, Tatsis GP. Heat-induced changes in optical properties of human whole blood in vitro. Proc SPIE. 1999;3599:180–187. [Google Scholar]
- 16.Ross EV, Domankevitz Y. Laser leg vein treatments: A brief overview. J Cosmetic Laser Ther. 2003;5:192–197. doi: 10.1080/14764170310021878. [DOI] [PubMed] [Google Scholar]
- 17.Tanghetti EA, Sherr EA, Alvarado SL. Multipass treatment of photodamage using the pulse dye laser. Derm Surg. 2003;29:686–691. doi: 10.1046/j.1524-4725.2003.29187x. [DOI] [PubMed] [Google Scholar]
- 18.Rohrer TE, Chatrath V, Iyengar V. Does pulse stacking improve the results of treatment with variable-pulse pulsed dye lasers? Derm Surg. 2004;30:163–167. doi: 10.1111/j.1524-4725.2004.30059.x. [DOI] [PubMed] [Google Scholar]
- 19.Cordone L, Cupane A, Leone M, Vitrano E. Optical absorption spectra of deoxy- and oxyhemoglobin in the temperature range 300–320 K. Biophys Biophys Chem. 1986;24:259–275. doi: 10.1016/0301-4622(86)85031-1. [DOI] [PubMed] [Google Scholar]
- 20.San Biagio PL, Vitrano E, Cupane A, Madonia F, Palma MU. Temperature induced difference spectra of oxy and deoxy hemoglobin in the near-IR, visible and Soret regions. Biochem Biophys Res Commun. 1977;77:1158–1165. doi: 10.1016/s0006-291x(77)80100-9. [DOI] [PubMed] [Google Scholar]
- 21.Steinke JM, Shepherd AP. Effects of temperature on optical absorbance spectra of oxy-, carboxy- and deoxy-hemoglobin. Clin Chem. 1992;38:1360–1364. [PubMed] [Google Scholar]
- 22.Seto Y, Kataoka M, Tsuge K. Stability of blood carbonmonoxide and hemoglobins during heating. Forensic Sci Int. 2001;121:144–150. doi: 10.1016/s0379-0738(01)00465-0. [DOI] [PubMed] [Google Scholar]
- 23.Randeberg L, Hagen AD, Svaasand L. Optical properties of human blood as a function of temperature. Proc SPIE. 2002;4609:20–28. [Google Scholar]
- 24.Farahani K, Saxton RE, Yoon H-C, De Salles A, Black KL, Lufkin RB. MRI of thermally denatured blood: Methemoglobin formation and relaxation effects. Magn Reson Imaging. 1999;17:1489–1494. doi: 10.1016/s0730-725x(99)00094-6. [DOI] [PubMed] [Google Scholar]
- 25.Stege G, Kampinga HH, Konings AW. Heat-induced intranuclear protein aggregation and thermal radiosensitization. Int J Radiat Biol. 1995;67:203–209. doi: 10.1080/09553009514550251. [DOI] [PubMed] [Google Scholar]
- 26.Lepock J. Role of nuclear protein denaturation and aggregation in thermal radiosensitization. Int J Hyperthermia. 2004;20:115–130. doi: 10.1080/02656730310001637334. [DOI] [PubMed] [Google Scholar]
- 27.Lepock J, Frey HE, Ritchie KP. Protein denaturation in intact hepatocytes and isolated cellular organelles during heat shock. J Cell Biol. 1993;122:1267–1276. doi: 10.1083/jcb.122.6.1267. [DOI] [PMC free article] [PubMed] [Google Scholar]
- 28.Welch A. The thermal response of laser irradiated tissue. IEEE J Quant Electron. 1984;20:1471–1481. [Google Scholar]
- 29.Lepock J. Measurement of protein stability and protein denaturation in cells using differential scanning calorimetry. Methods. 2005;35:117–125. doi: 10.1016/j.ymeth.2004.08.002. [DOI] [PubMed] [Google Scholar]
- 30.Lepock J, Frey HE, Rodahl AM, Kruuv J. Thermal analysis of CHL V79 cells using differential scanning calorimetry: Implications for hyperthermic cell killing and the heat shock response. J Cell Phys. 1988;137:14–24. doi: 10.1002/jcp.1041370103. [DOI] [PubMed] [Google Scholar]
- 31.Lepock J, Rodahl AM, Zhang C, Heynen ML, Waters B, Cheng CH. Thermal denaturation of the Ca2(+)-ATPase of sarcoplasmic reticulum reveals two thermodynamically independent domains. Biochemistry. 1990;29:681–689. doi: 10.1021/bi00455a013. [DOI] [PubMed] [Google Scholar]
- 32.Anson ML, Mirsky AE. On some general properties of proteins. J Gen Physiol. 1925;9:169–179. doi: 10.1085/jgp.9.2.169. [DOI] [PMC free article] [PubMed] [Google Scholar]
- 33.Anson ML, Mirsky AE. Protein coagulation and its reversal: The preparation of insoluble globin? soluble globin and heme. J Gen Physiol. 1930;13:469–476. doi: 10.1085/jgp.13.4.469. [DOI] [PMC free article] [PubMed] [Google Scholar]
- 34.Burgman PW, Konings AW. Heat induced protein denaturation in the particulate fraction of HeLa S3 cells: Effect of thermotolerance. J Cell Physiol. 1992;153:88–94. doi: 10.1002/jcp.1041530112. [DOI] [PubMed] [Google Scholar]
- 35.Bellelli A, Ippoliti R, Brancaccio A, Lendaro E, Brunori M. Cooperative ligand binding of crosslinked hemoglobins at very high temperatures. J Mol Biol. 1990;213:571–574. doi: 10.1016/S0022-2836(05)80241-4. [DOI] [PubMed] [Google Scholar]
- 36.Shimada K, Matsushita S. Relationship between thermocoagulation of proteins and amino acid compositions. J Agric Food Chem. 1980;28:413–417. [Google Scholar]
- 37.Roto Roti JL, Winward RT. The effect of hyperthermia on the protein-to-DNA ratio of isolated HeLa cell chromatin. Radiat Res. 1978;74:159–169. [PubMed] [Google Scholar]
- 38.Tomasovic S, Turner GN, Dewey WC. Effect of hyperthermia on nonhistone proteins isolated with DNA. Radiat Res. 1978;73:532–552. [PubMed] [Google Scholar]
- 39.Warters RL, Brizgys LM, Sharma R, Roti Roti JL. Heat shock (45°C) results in an increase of nuclear matrix protein mass in HeLa cells. Int J Radiat Biol. 1986;50:253–268. doi: 10.1080/09553008614550641. [DOI] [PubMed] [Google Scholar]
- 40.Kampinga HH, Luppes JG, Konings AW. Heat-induced nuclear protein binding and its relation to thermal cytotoxicity. Int J Hyperther. 1987;3:459–465. doi: 10.3109/02656738709140416. [DOI] [PubMed] [Google Scholar]
- 41.Pittsyn OB. The molten globule. In: Creighton TE, editor. Protein Folding. New York: Freeman; 1992. pp. 243–300. [Google Scholar]
- 42.Vandegriff KD, Olson JS. Morphological and physiological factors affecting oxygen uptake and release by red blood cells. J Biol Chem. 1984;259:12619–12627. [PubMed] [Google Scholar]
- 43.Lemon DD, Nair PK, Boland EJ, Olson JS, Hellums JD. Physiological factors affecting o2 transport by hemoglobin in an in vitro capillary system. J Appl Physiol. 1987;62:798–806. doi: 10.1152/jappl.1987.62.2.798. [DOI] [PubMed] [Google Scholar]
- 44.Lapotko D, Kuchinsky G. Photothermal microscopy for cell imaging and diagnostics. Proc SPIE. 1995;2390:89–100. [Google Scholar]
- 45.Anderson RR, Parrish J. Selective photothermolysis: Precise microsurgery by selective absorption of pulsed radiation. Science. 1983;220:524–527. doi: 10.1126/science.6836297. [DOI] [PubMed] [Google Scholar]
- 46.Lapotko D, Lukianova K, Shnip A. Photothermal responses of individual cells. J Biomed Optics. 2005;10:014006. doi: 10.1117/1.1854685. [DOI] [PubMed] [Google Scholar]
- 47.Lapotko D, Lukianova E. Influence of physiological conditions on laser damage thresholds for blood, heart and liver cells. Lasers Surg Med. 2005;36:13–21. doi: 10.1002/lsm.20113. [DOI] [PubMed] [Google Scholar]
- 48.Lapotko D. Laser-induced bubbles in living cells. Lasers Surg Med. 2006;38:240–248. doi: 10.1002/lsm.20284. [DOI] [PubMed] [Google Scholar]
- 49.Lapotko D, Lukianova K. Laser-induced micro-bubbles in cells. Int J Heat Mass Transfer. 2005;48:227–234. [Google Scholar]
- 50.McKenzie AL. Physics of thermal processes in laser-tissue interaction. Phys Med Biol. 1990;35:1175–1209. doi: 10.1088/0031-9155/35/9/001. [DOI] [PubMed] [Google Scholar]
- 51.Lukianova-Hleb EY, Hu Y, Latterini L, Tarpani L, Lee S, Drezek RA, Hafner JH, Lapotko DO. Plasmonic nanobubbles as transient vapor nanobubbles generated around plasmonic nanoparticles. ACS Nano. 2010;4:2109–2123. doi: 10.1021/nn1000222. [DOI] [PMC free article] [PubMed] [Google Scholar]
- 52.Lapotko D, Shnip A, Lukianova E. Photothermal detection of laser-induced damage in single intact cells. Lasers Surg Med. 2003;33:320–329. doi: 10.1002/lsm.10285. [DOI] [PubMed] [Google Scholar]
- 53.Lapotko D, Romanovskaya T, Gordiyko E. Photothermal monitoring of redox state of respiratory chain in single live cells. Photochem Photobiol. 2002;75:519–526. doi: 10.1562/0031-8655(2002)075<0519:pmorso>2.0.co;2. [DOI] [PubMed] [Google Scholar]
- 54.Lapotko D, Kuchinsky G, Romanovskaya T, Scoromnik H. Photothermal method for cell viability control. In: Scudiery F, Bertolotti M, editors. Photoacoustica and Photothermal Phenomena. Rome: AIP; 1998. pp. 582–584. [Google Scholar]
- 55.Lapotko D, Kultchitcky V, Kutchinsky G, Kultchitsky S, Skoromnik E, Akulitch N, Gurin V. Thermoregulation and temperature adaptation. Minsk: Polibig; 1995. The red blood cells: The new world of febrile and endotoxin shock sensors; pp. 113–117. [Google Scholar]
- 56.Lapotko D, Romanovskaya T. Human cell viability to laser pulse and ion transport processes. Proc SPIE. 2000;3914:262–269. [Google Scholar]
- 57.Mordon S, Brisot D, Fournier N. Using a “non-uniform pulse sequence” can improve selective coagulation with an Nd:YAG laser (1. 06 μm) thanks to met-hemoglobin absorption: A clinical study on blue leg veins Lasers. Surg Med. 2003;32:160–170. doi: 10.1002/lsm.10135. [DOI] [PubMed] [Google Scholar]
- 58.Ao H, Xing D, Wei H, Gu H, Wu G, Lu J. Thermal coagulation-induced changes of the optical properties of normal and adenomatous human colon tissues in vitro in the spectral range 400–1100 nm. Phys Med Biol. 2008;53:2197–2206. doi: 10.1088/0031-9155/53/8/013. [DOI] [PubMed] [Google Scholar]
- 59.Ritz J-P, Roggan A, Isbert C, Müller G, Buhr HJ, Germer C-T. Optical properties of native and coagulated porcine liver tissue between 400 and 2400 nm. Laser Surg Med. 2001;29:205–212. doi: 10.1002/lsm.1134. [DOI] [PubMed] [Google Scholar]
- 60.Terenji A, Willmann S, Osterholz J, Hering P, Schwarzmaier HJ. Measurement of the coagulation dynamics of bovine liver using the modified microscopic Beer-Lambert Law. Laser Surg Med. 2005;36:365–370. doi: 10.1002/lsm.20178. [DOI] [PubMed] [Google Scholar]
- 61.Pandita T, Pandita S, Bhaumik SR. Molecular parameters of hyperthermia for radiosensitization. Crit Rev Eukaryot Gene Expr. 2009;19:231–251. doi: 10.1615/critreveukargeneexpr.v19.i3.50. [DOI] [PMC free article] [PubMed] [Google Scholar]
- 62.Zijlstra WG, Buursma A, Meeuwsen-Van Der Roest WP. Absorption spectra of human fetal and adult oxyhemoglobin, deoxyhemoglobin, carboxyhemoglobin, and methemoglobin. Clin Chem. 1991;37:1633–1638. [PubMed] [Google Scholar]


