

Abstract
Mutations of the ENPP1 gene encoding ecto-nucleotide pyrophosphatase/phosphodiesterase 1 (NPP1) are associated with medial calcification in infancy. While the inhibitory role of matrix proteins such as osteopontin (OPN) with respect to atherosclerotic plaque calcification has been established, the role of NPP1 in plaque calcification is not known. We assessed the degree of plaque calcification (computed tomography), NPP1 and OPN localization (immunohistochemistry) and expression (RT-PCR) in a cohort of 45 patients undergoing carotid endatherectomy for significant stenosis of the internal carotid artery and in normal arteries (N= 50). We correlated NPP1 and OPN expression levels to the degree of plaque calcification, to pro-atherogenic factors and statin therapy. NPP1 was demonstrated in the base and in the shoulder of atherosclerotic plaques. Compared to normal arteries and non-calcified plaques, in calcified plaques NPP1 mRNA was decreased (P < 0.0001). OPN mRNA levels were up-regulated in carotid atheroma. NPP1 and OPN expression levels positively correlated with the degree of plaque calcification (R= 0.54, P= 0.00019 and R= 0.46, P= 0.017, respectively) and with risk factors of atherosclerosis. Expression of the calcification inhibitor NPP1 is down-regulated in calcified atherosclerotic plaques. Our correlation data point to a counter-active mechanism, which in the end turns out to be insufficient to prevent further progression of calcification.
Keywords: NPP1, plaque, calcification, carotid stenosis, statins
Introduction
Vascular calcification frequently develops in patients with atherosclerosis, stroke, valvular disease and varicosis [1–6]. Advanced age and metabolic disorders, including end stage renal disease and diabetes mellitus are known contributing factors [7–9]. Increased risk of cardiovascular events is closely associated with arterial calcification [7]. Arterial calcification correlates with an increased frequency of ischemic episodes in peripheral vascular disease [9]. Calcification in the thin fibrous cap of atherosclerotic lesions in the coronary and carotid arteries ultimately increases the risk of plaque rupture [10].
Symptomatic intimal plaques in the carotid artery involve primarily the carotid bulb and are characterized by increased cellular proliferation, lipid accumulation, ulceration and calcification [11].
Whereas arterial calcification in aging, diabetes mellitus and end-stage renal disease is primarily located to the medial layer, calcification in atherosclerosis occurs in the intima. Like medial calcification, intimal calcification is due to ectopic calcification as a consequence of vascular smooth muscle cell (VSMC) transdifferentiation. As members of the mesenchymal cell differentiation tree VSMC may differentiate to a ‘bone-forming’ chondroblast- or osteoblast-like phenotype. These transdifferentiated calcifying VSMCs form mineralizing, membrane-limited cell fragments (matrix vesicles) that provide a sheltered environment for the initiation of calcification [6, 12].
Recent studies in animal models and cell culture studies have demonstrated that (as in mineralizing bone) vascular calcification must be actively inhibited by physiological function of resident cells (VSMCs and endothelial cells) and infiltrating cells (tissue macrophages). Characterization of targeted or naturally occurring mutations of a variety of bone and cartilage associated genes in mice has identified 11 different inhibitors of vascular calcification in vivo[13]. One of these inhibitors is the nucleotide pyrophosphatase/phosphodiesterase family member NPP1, since inborn deficiency of NPP1 is associated with calcification of arteries in mice and human beings [13].
NPP1 is a major generator of extracellular inorganic pyrophosphate (PPi) in cartilage and a variety of other tissues [14, 15]. PPi potently inhibits hydroxyapatite crystal deposition and growth and regulates cell differentiation processes. The physiologic role of NPP1-mediated PPi generation in tissue calcification has come to light recently. First, an inactivating NPP1 mutation was linked to the hypermineralizing phenotype of ttw/ttw mice [15]. A similar phenotype is found in NPP1-knockout mice. In the aorta of these mice, hydroxyapatite crystals are deposited in the medial layer at the level of the internal elastic lamina. In human beings, inactivating mutations of ENPP1 are associated with generalized arterial calcification of infancy, a spontaneous and frequently lethal form of widely disseminated arterial media calcification [16]. Polymorphisms of the ENPP1 gene have been associated with increased risk for myocardial infarction and earlier onset of peripheral arterial disease [8, 17, 18]. Thus, there is ample evidence that NPP1 not only governs medial calcification, but may also play an important role in intimal calcification.
Therefore, the present study set out to investigate whether NPP1 is also involved in intimal calcification. Here we used calcified and non-calcified carotid endatherectomy samples in comparison with normal arteries to study the expression of NPP1. Particularly, we focussed on the relation between NPP1 and osteopontin (OPN), a known inhibitor of intimal calcification.
Furthermore, the correlation of the expression levels of both factors to the degree of calcification, to risk factors and statin therapy was analysed. Here we show decreased mRNA expression of NPP1 in the calcified atherosclerotic plaque compared to normal arteries and uncalcified plaques. Moreover, NPP1 as well as OPN expression levels correlate with risk factors of atherosclerosis. Interestingly, in the calcified carotid plaque both NPP1 and OPN levels positively correlate with the extent of calcification indicating a failing mechanism to counter regulate further calcification.
Materials and methods
Patients, samples and tissue preparation
Human carotid artery specimens were obtained during surgery from patients undergoing carotid artery endatherectomy for significant stenosis after informed consent. The study was approved by the institutional ethical committee (Reg. No.: 4IRutsch1). Immediately after excision of the carotid atheromas, the samples from the arteria carotis interna were split longitudinally in two samples, one was directly frozen in liquid nitrogen, the other was immediately embedded in cryoprotective medium (Thermo Shandon, Frankfurt/Main, Germany) and snap-frozen in liquid nitrogen for subsequent cryosectioning. Normal human vascular tissue including samples with minimal intima hyperplasia (Aorta, N= 16; A. mammaria, N= 23; A. radialis; N= 11) was obtained from patients undergoing coronary bypass surgery (approved by the ethics committee of Muenster University Hospital Az. 2007-210-f-S). The frozen samples were stored at −80°C until required.
RNA-isolation and RT-PCR
TRIzol extraction of total RNA was carried out essentially according to the manufacturer’s specifications (Invitrogen, Carlsbad, CA, USA) with minor modifications. To a carotid artery segment, 1.6 ml of TRIzol was added, and the sample was homogenized using a Mikro-Dismembrator U (B. Braun Biotech International, Melsungen, Germany). Following incubation for 5 min. at room temperature, 0.3 ml of chloroform was added, and the tubes were shaken for 20 sec. and then incubated for 3 min. at room temperature. This mixture was then centrifuged at 12,000 x g for 15 min. at 48C. The aqueous phase was transferred to a new tube, 500 ml TRIzol and 100 ml chloroform were added, the tubes were shaken for 20 sec. and centrifuged at 12,000 x g for 15 min. at 48C. The aqueous phase was transferred to a new tube, isopropanol (0.8 ml) was added and the sample was mixed by inversion and then incubated for 10 min. at room temperature prior to centrifugation at 12,000 x g for 20 min. at 48C. The RNA pellet was washed with 1 ml of 80% ethanol, centrifuged at 7500 x g for 15 min. at room temperature, and air-dried in sterile conditions for 5–10 min. The RNA pellets were dissolved in 20 ml of RNase-free water and stored at −808C. RNA quality and integrity was determined by analysing the absorbance at 260/280 nm wavelength and by visualizing the 28S and 18S rRNA bands in ethidium bromide-stained agarose gels under ultraviolet light. The A260/A280 ratio of the total RNA samples was >1.7 and 28S/18S ratios were >1.8.
Total RNA isolated from carotid endatherectomy samples was used. One microgram of total RNA was reverse-transcribed after an initial denaturation step at 658C for 10 min. in a total volume of 20 ml using 10 U/ml of Superscript™ III reverse transcriptase (Invitrogen™ Life Technologies), 1 U/ml Ribo Lock™ ribonuclease inhibitor (MBI Fermentas GmbH, St. Leon-Rot, FRG), 25 ng/ml oligo[(dT)12–18] (Invitrogen™ Life Technologies), 0.5 mmol/l each of 29-desoxynucleoside-59triphosphate (dNTP), 5 mmol/l dithiothreitol (DTT), 1x first strand buffer (250 mmol/l Tris-HCl (pH 8.4), 375 mmol/l KCl, 15 mmol/l MgCl2) freshly diluted from 5x stock (Invitrogen™ Life Technologies) at 378C for 60 min. Samples were heated at 958C for 5 min. to terminate RT activity. Total RT products were subsequently used for PCR amplification. mRNAs of NPP1, OPN and glyceraldehyde-3-phosphate-dehydrogenase (GAPDH) were assessed in all biopsies by RT-PCR. In brief, 1 mg total RNA was reverse transcribed using Superscript™ III according to the manufacturer’s instructions (Invitrogen™ Life Technologies). The RT products (1ml) were brought to a volume of 25 ml containing 1x Qiagen PCR buffer, 2.5 mM MgCl2, 0.1 mM of each dNTP, 1.5 U of Taq Polymerase (Qiagen GmbH, Hilden, Germany) and 0.4 mM of each primer. Primers were designed across intron/exon boundaries. Optimal amplification temperature and cycle number were estimated on a gradient cycler (Stratagene, Cedar Creek, TX, USA). After estimating the optimal temperature (50–608C, 28C steps) a cycle gradient was performed (24–39 cycles, 3-cycle steps) using the optimal temperature. The optimal cycle number was in the range of linear amplification. Table S1 summarizes the individual sequences of the primers, annealing temperatures and cycle numbers used for each primer pair and the PCR product sizes (Table S1). After denaturation at 958C for 5 min. amplification was carried out in a Robocycler Gradient 96 (Stratagene) using the following temperature and time profile: denaturation at 958C for 30 sec.; primer annealing at the respective temperatures for 60 sec.; primer extension at 728C for 60 sec.; and a final extension of 728C for 10 min. A total of 10 ml of the PCR reaction were analysed using standard agarose gel electrophoresis. To evaluate the relative expression, the agarose gels were scanned using a video documentation system, and ImageQuant™ software (Molecular Dynamics, Krefeld, Germany). The absorption units were corrected for GAPDH mRNA levels.
Immunohistochemistry
NPP1, OPN and SMC specific a-actin were detected as follows: (i) for NPP1, monoclonal mouse anti-human NPP1 1:500 (3E8, 0.25 mg/ml IgG, kindly provided by James Goding, Monash University, Prahan, Australia) [19]; (ii) for OPN, monoclonal mouse anti-human OPN 1:100 (OP3N, 0.34 mg/ml IgG, Novocastra Laboratories Ltd., Newcastle upon Tyne, UK) (iii) SMC specific a-actin, monoclonal mouse anti-human SMC a-actin 1:100 (HHF35, 0.11 mg/ml IgG, Dako Corporation, Carpinteria, CA, USA) were used. The secondary antibody detection system was donkey anti-mouse conjugated to Cy3 (1:50; 0.5 mg/ml IgG, Chemicon International, Temecula, CA, USA). Nuclei were stained with 4'-6-diamidino-2-phenylindole (DAPI, 1:10000; Carl Roth GmbH & Co.KG, Karlsruhe, Germany).
Cryosections were fixed for 20 min. in methanol at 4°C and blocked for 1 hr in 5% normal donkey serum containing 1% bovine serum albumin (BSA) at room temperature. Sections were incubated with the respective primary antibody diluted in PBS containing 5% normal donkey serum and 1% BSA at room temperature over night. After washing thoroughly in PBS, sections were treated with the secondary antibody diluted in PBS containing 1% BSA for 1 hr at room temperature. After rinsing with PBS, nuclei were stained for 5 min. by DAPI. After washing again, the slides were mounted with DakoCytomation fluorescent mounting medium (Dako, Hamburg, Germany). Negative controls included substitution of the primary antibody by mouse anti-human IgG 2a (1:500; MOPC-173, 0.25 mg/ml, kindly provided by James Goding, Monash University, Prahan, Australia) or omission of the primary antibody. Results were documented using a fluorescence microscope (AXIOPHOT2™; Zeiss, Jena, Germany) fitted with the appropriate filter blocks for detection of Alexa and Texas Red fluorescence.
Histological analysis and quantification of calcification
For visualization of calcification the von Kossa staining procedure was used. Sections (10 μm) were stained according to standard procedures. Haematoxylin and eosin standard stain demonstrated general morphology.
For quantification of calcification the frozen specimens were scanned using a Dual Source CT (Somatom Definition, Siemens Medical Solutions, Forchheim, Germany). Scan parameters were as follows: detector collimation: 2 × 64 × 0.6 mm, pitch: 0.7, 330 msec. rotation time, tube current-time product: 400 mAs and tube voltage 120 kV. We used a simulated ecg-signal (60 bpm) and images were reconstructed with a slice thickness of 3.0 mm and an increment of 1.5 mm. The field of view was set to 250 mm. These parameters were chosen as the scanner is calibrated to these settings using a calcium score phantom (QRM, Moehrendorf, Germany).
As the scan protocol is optimized for coronary calcium quantification, we used a simulated ecg-signal (60 bpm). Images were reconstructed with a slice thickness of 3.0 mm and an increment of 1.5 mm. The field of view was set to 250 mm. These parameters were chosen as the scanner is calibrated to these settings using a calcium score phantom (QRM).
The quantification of the calcium mass was performed with standard software (CalciumScore, Siemens Medical Solutions) running on the scanner. To calculate the calibrated calcium mass, the density and volume of each volume element (voxel) with a density above 130 Hounsfield units are taken into account [20].
Statistical analysis
Expression data are presented as means ± S.D. The groups were compared with ANOVA followed by post hoc analysis of the means. Univariate analysis was performed by means of the Mann-Whitney U-test for continuous variables. Fisher’s exact test was used to examine the significance of the association between two variables. A value of P < 0.05 was considered as statistically significant.
Results
Patient characteristics
Forty-five patients (average age 67 ± 8.3 years) were enrolled in the study, including 37 males and 8 females. In our study cohort, 7 patients (15.6%) showed a non-calcified plaque (–calc group), 38 (84.4%) showed various degrees of calcification (+calc group). Both groups did not differ with respect to total cholesterol (calcified: 214.20 ± 102.26 versus non-calcified: 214.52 ± 34.20 mg/dl, n.s.), LDL (calcified: 139.84 ± 26.73 versus non-calcified: 167.70 ± 46.81 mg/dl, n.s.), HDL (calcified: 56.92 ± 16.57 versus non-calcified: 59.60 ± 18.98 mg/dl, n.s.) and triglyceride levels (calcified: 231.00 ± 140.13 versus non-calcified: 437.80 ± 343.36 mg/dl, n.s.). Table S2 summarizes the clinical characteristics of the patients.
Calcification levels as shown by CT analysis varied between 0.01% and 58.9% of plaque mass. Linear regression analysis (Fig. 1) of all samples with known extent of calcification, which yielded intact RNA (N= 45) revealed a positive correlation between age and calcification (R= 0.44, P < 0.01). Correlations of calcification with the other risk factors of atherosclerosis (diabetes mellitus, smoking, obesity, lipid parameters, gender) were not found.
Fig 1.
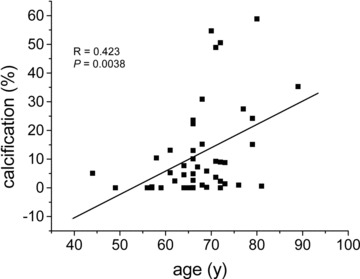
Linear regression analysis showing the correlation between calcification and age in atheromatous carotid stenosis. In carotids the extent of calcification (calcification mass related to plaque mass) correlates with age (Please note: Only plaque samples yielding intact RNA were used for this analysis).
Expression of NPP1 and OPN in carotid endatherectomy samples
The mRNA expression levels of NPP1 and OPN were assessed by RT-PCR in normal arteries (all not calcified, including samples with minimal intima hyperplasia) and all carotid artery tissue samples yielding intact RNA (N= 34). The mRNAs of NPP1 and OPN were detected in all samples.
The NPP1 mRNA levels ranged from 4.9 to 13.8 in normal arteries. In carotid endatherectomy samples the levels of NPP1 mRNA ranged from 3.9 to 10.7 in non-calcified atheroma and from 1.2 to 5.6 in calcified samples. Differences between normal arteries and non-calcified carotids were not found (normal: 9.51 ± 4.87 versus non-calcified: 7.62 ± 2.82, P= n.s.). For analysis of mRNA expression, calcified samples were divided into moderately and severely calcified samples. Samples showing calcification up to 5% of the plaque mass were considered as moderately calcified (+calc), samples showing calcification of more than 5% were considered as severely calcified (++calc). In comparison with normal arteries, the NPP1 mRNA levels of moderately and severely calcified carotids were significantly decreased (normal: 9.51 ± 4.87 versus calcified: +calc: 1.90 ± 0.82, P < 0.0001; normal: 9.51 ± 4.87 versus++calc: 3.62 ± 1.25, P < 0.0001). Also, in comparison with non-calcified atheroma, NPP1 mRNA levels were significantly decreased in moderately and severely calcified samples ([non-calcified: 7.62 ± 2.82 versus calcified: +calc: 1.90 ± 0.82 and ++calc: 3.62 ± 1.25, P < 0.0001]; Fig. 2).
Fig 2.
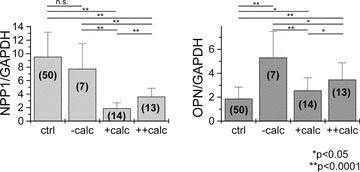
Expression of NPP1 mRNA and OPN mRNA levels in normal arteries (ctrl), non-calcified (–calc), moderately calcified (+calc) and severely calcified (++calc) carotid endatherectomy samples. NPP1 mRNA is highly expressed in normal arteries. In comparison with normal arteries and the –calc group, the relative expression of NPP1 mRNA was significantly down-regulated in calcified carotid atheroma. Higher NPP1 levels were found in the ++calc group compared to the +calc group. Differences between the ctrl and –calc groups were not found. In comparison with normal arteries, OPN mRNA levels were significantly increased in both non-calcified and calcified carotid atheroma. Interestingly, when comparing both +calc groups, the expression levels of OPN mRNA were higher in the ++calc group. (ctrl) normal arteries; (–calc) non-calcified; (+calc) <5% calcification; (++calc) >5% calcification; numbers in brackets reflect number of samples studied in each group; n.s. not significant.
In normal arteries, OPN mRNA levels ranged from 0.6 to 3.4. In carotid endatherectomies OPN mRNA expression levels were between 2.7 and 9.2 in non-calcified and between 1.1 and 6.4 in calcified samples. OPN levels were significantly up-regulated in non-calcified atheromatous carotid samples compared to normal arteries (normal: 1.88 ± 0.96 versus non-calcified: 5.32 ± 2.81, P= 0.0001), and in calcified carotid samples compared to normal arteries (normal: 1.88 ± 0.96 versus calcified: +calc: 2.56 ± 1.06, P < 0.05 and normal: 1.88 ± 0.96 versus calcified: ++calc: 3.47 ± 1.40, P < 0.0001). When comparing the non-calcified and calcified atheroma groups, lower levels of OPN were found in both moderately and severely calcified samples ([non-calcified: 5.32 ± 2.81 versus calcified: +calc: 2.56 ± 1.06, P > 0.0001 and non-calcified: 5.32 ± 2.81 versus++calc: 3.47 ± 1.40, P < 0.05]; Fig. 2). Similar to NPP1 expression levels, the lowest levels of OPN mRNA were observed in moderately calcified atheromatous carotid samples (Fig. 2).
Relation between NPP1 and OPN expression and calcification
Linear regression analysis was used to establish the potential relationship between NPP1 and OPN as well as the relation between NPP1, OPN and calcification. In the –calc group correlations between NPP1, OPN and age were not found. In the +calc group, age positively correlated with calcification (R= 0.38483, P= 0.047). The mRNA expression levels of NPP1 as well as OPN positively correlated with the degree of calcification (NPP1: R= 0.53975, P= 0.00019; OPN: R= 0.46, P= 0.036), but not with age. Furthermore, mRNA levels of NPP1 and OPN positively correlated with each other (R= 0.35, P= 0.021; Fig. 3).
Fig 3.
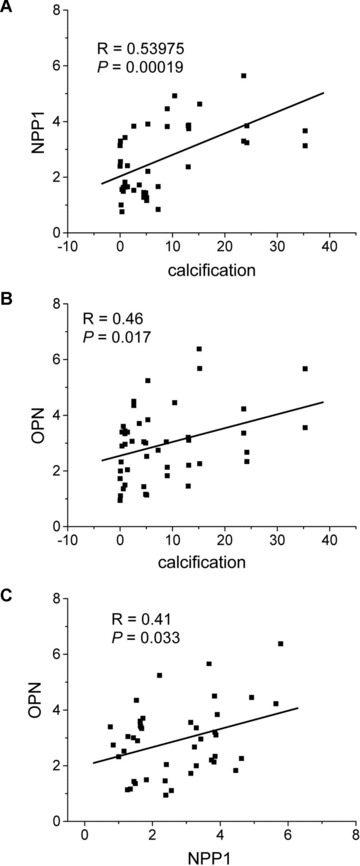
Correlation of NPP1 mRNA and OPN mRNA expression with the degree of calcification in carotid atheroma. Linear regression analysis demonstrates that relative expression levels of NPP1 mRNA (A) and OPN mRNA (B) positively correlates with the extent of calcification. Moreover, a positive correlation exists between NPP1 mRNA and OPN mRNA expression (C).
NPP1 and OPN expression and risk factors of atherosclerosis
In the +calc group, NPP1 and OPN mRNA levels in the plaque were analysed with respect to gender, presence of symptoms, hypertension, smoking, obesity, diabetes and therapy with statins (Table 1). NPP1 levels were lower in male (61%; P= 0.043) as well as in obese patients (54%; P= 0.003), whereas increased levels were found in patients with hypertension (188%; P < 0.0001). Decreased OPN mRNA levels were found in patients with hypercholesterolemia (80%; P= 0.049) and diabetes (81%; P= 0.013); the levels were increased in the smoking subgroup (136%; P= 0.023).
Table 1.
Effect of gender and risk factors on the expression of NPP1 and OPN mRNA in atheromatous carotid plaques
| NPP1 (mean ± S.D.) | P-value | OPN (mean ± S.D.) | P-value | |||||||||
|---|---|---|---|---|---|---|---|---|---|---|---|---|
| Calcification | – | + | – | + | ||||||||
| Presence of symptoms | 2.73 ± 1.55 | 2.58 ±1.11 | n.s. | 2.97 ± 1.32 | 2.96 ± 1.30 | n.s. | ||||||
| Hypertension | 1.48 ± 0.12 | 2.78 ± 1.35 | <0.0001 | 2.78 ± 1.21 | 3.03 ± 1.30 | n.s. | ||||||
| Hypercholesterolemia | 2.45 ± 1.10 | 2.81 ± 1.49 | n.s. | 3.25 ± 1.22 | 2.60 ± 1.32 | 0.049 | ||||||
| Smoking | 2.74 ± 1.10 | 2.54 ± 1.67 | n.s. | 2.59 ± 1.13 | 3.52 ± 1.36 | 0.023 | ||||||
| Obesity | 2.70 ± 1.36 | 1.47 ± 0.42 | 0.003 | 2.96 ± 1.34 | 3.28 ± 0.49 | n.s. | ||||||
| Diabetes | 2.66 ± 1.35 | 2.70 ± 1.50 | n.s. | 3.00 ± 1.33 | 2.44 ± 0.20 | 0.013 | ||||||
| Statin therapy | 3.07 ± 1.44 | 2.14 ± 1.06 | 0.009 | 3.33 ± 1.32 | 2.41 ± 1.06 | 0.014 | ||||||
| Gender (f/m)* | 2.48 ± 1.21 (m) | 0.043 | 2.92 ± 1.18 (m) | n.s. | ||||||||
| 4.05 ± 1.56 (f) | 3.33 ± 2.15 (f) | |||||||||||
In calcified carotid plaques, male and hypertensive patients presented a lower NPP1 expression, whereas in obese patients the NPP1 levels were increased. OPN levels were decreased in patients with hypercholesterolemia and diabetes, while increased OPN levels were observed in smokers. Interestingly, under statin therapy lower levels of both NPP1 and OPN were observed.
S.D., standard deviation; n.s., not significant.
Only data for the calcified carotid plaques are shown.
Under statin therapy levels of NPP1 and OPN significantly decreased to about 70% (P= 0.009 and P = 0.014, respectively). Moreover, the extent of calcification was significantly lower in statin treated patients of the +calc group (+statin: 4.04 ± 4.31 versus–statin: 10.79 ± 9.98, P = 0.044).
Occurrence and distribution of NPP1 and OPN in carotid plaques
Sections of plaque samples were analysed by immunofluorescence with respect to the expression and distribution of NPP1 and OPN in different plaques with various degrees of calcification (Figs 4–6).
Fig 4.
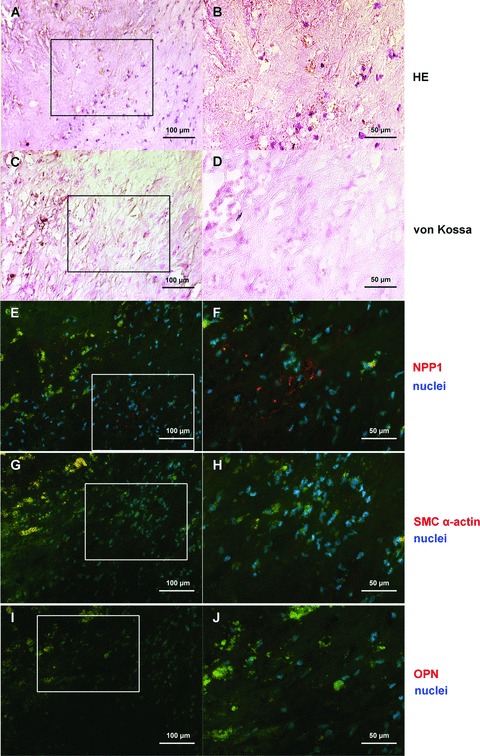
NPP1 and OPN protein expression in the uncalcified core region of a plaque. General morphology is shown by haematoxylin and eosin stain (A, B); von Kossa stain demonstrates the absence of hydroxyapatite deposits in this region of the plaque (C, D); NPP1 immunolabelling: only few NPP1 expressing cells are found in the core region of the plaque (E, F). In the core of the plaque smooth muscle cells are scarcely found (G, H); OPN immunofluorescence staining is not present (I, J). Right parts (B, D, F, H, J) represents detailed enlargement of boxed areas in the corresponding left part. Immunofluorescence signal (NPP1, OPN, smooth muscle cell specific α-actin) was done using Cy3-conjugated secondary antibodies (red), DAPI was used to stain nuclei (blue). Autofluorescence of matrix structures: green; calcified and lipid rich areas: yellow. For individual data of the immunofluorescence signals see Fig. S1.
In non-calcified plaques NPP1 was detected mainly in the media. In the non-calcified core region of a plaque (Fig. 4), few NPP1 expressing cells were found (Fig. 4E, F). In moderately calcified areas of the plaque (Fig. 5) NPP1 was detected in the media and in intimal regions adjacent to the media (Fig. 5E, F). In the media NPP1 colocalized with smooth muscle cells (Fig. 5G, H). In the severely calcified plaque (Fig. 6) NPP1 was found in the acellular matrix of the non-calcified core area with only few expressing cells (Fig. 6E, F). OPN immunolabel gradually increased with progressing plaque calcification. In the uncalcified plaque (Fig. 4I, J) no OPN expressing cells were detected. In moderately calcified plaques, a positive staining was found in the intimal layer adjacent to the calcification (Fig. 5I, J). OPN was particularly strongly expressed in the acellular severely calcified areas of the plaque core (Fig. 6I, J).
Fig 5.
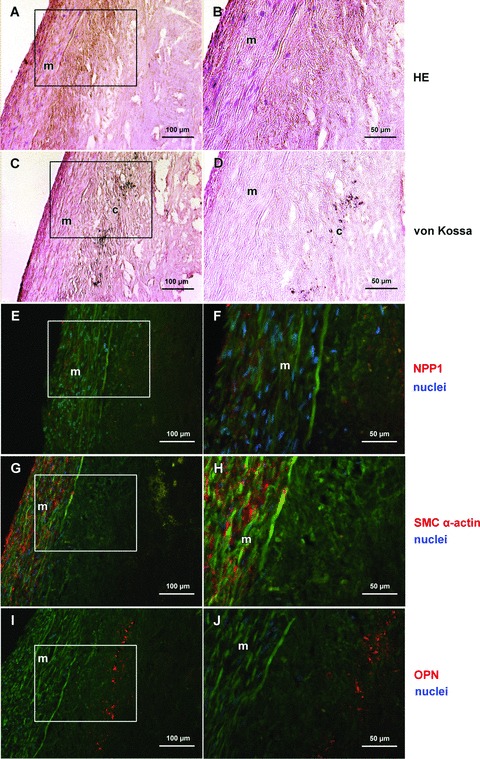
NPP1 and OPN protein expression in a moderately calcified region of the basis of a plaque. Haematoxylin and eosin stain shows the media and the acellular intimal region of the plaque (A, B); von Kossa staining (brown) shows minor hydroxyapatite deposits in the deep intimal layer adjacent to the media (C, D). NPP1 immunostaining is present in the media and in intimal regions adjacent to the media (E, F). Immunofluorescence staining for smooth muscle cell specific α-actin: smooth muscle cells are mainly detected in the media (G, H). Osteopontin immunostaining is demonstrated in the intimal layer adjacent to the calcification zone (I, J). Right part (B, D, F, H, J) represents detailed enlargement of boxed areas in the corresponding left part. Immunofluorescence signal (NPP1, OPN, smooth muscle cell specific α-actin) was done using Cy3-conjugated secondary antibodies (red), DAPI was used to stain nuclei (blue). Autofluorescence of matrix structures: green; calcified and lipid rich areas: yellow. For individual data of the immunofluorescence signals see Fig. S2. m, media; c, calcification.
Fig 6.
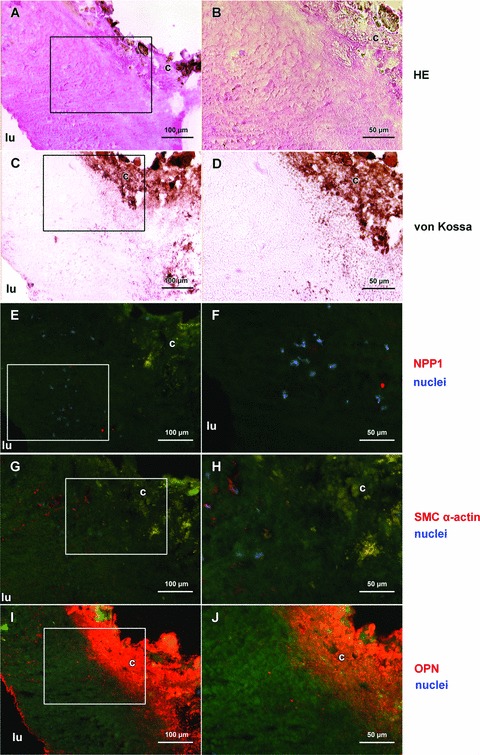
NPP1 and OPN protein expression in a severely calcified region of the core of a plaque. Haematoxylin and eosin stain shows the acellular core region of the plaque (A, B); massive accumulation of hydroxyapatite in the core of the severely calcified plaque is shown by von Kossa staining (brown, C, D). In the severely calcified plaque NPP1 is found in the acellular matrix of the non-calcified core area; few expressing cells are demonstrated (E, F). Smooth muscle cells are only scarcely present (G, H). Osteopontin is strongly expressed adjacent to the calcified core of the plaque (I, J). Right part (B, D, F, H, J) represents detailed enlargement of boxed areas in the corresponding left part. Immunofluorescence signal (NPP1, OPN, smooth muscle cell specific a-actin) was done using Cy3-conjugated secondary antibodies (red), DAPI was used to stain nuclei (blue). Autofluorescence of matrix structures: green; calcified and lipid rich areas: yellow. For individual data of the immunofluorescence signals see Fig. S3. lu, lumen; c, calcification.
Discussion
In our present study we elaborate the relation between the inhibitor of calcification NPP1 and extent of carotid calcification.
Our study shows for the first time that
NPP1 is expressed in normal arteries (including arteries with minimal intima hyperplasia), non-calcified (advanced atherosclerosis) and calcified atherosclerotic lesions,
NPP1 is down-regulated only in calcified carotid atheroma,
While OPN mRNA levels are lower in calcified lesions, more OPN protein is deposited in calcified plaques and
In calcified carotid stenoses, NPP1 and OPN expression levels correlate positively with the degree of calcification, with risk factors of atherosclerosis and with each other.
Among the limitations of the study was the limited availability of uncalcified carotid artery samples. Any study based on carotid endatherectomy samples will face this problem, since mostly advanced and calcified atherosclerotic lesions will be present in a cohort with severe carotid artery stenoses. Furthermore, for obvious medical and ethical reasons, fresh normal carotid artery tissue cannot be obtained through biopsies from healthy control individuals. Therefore, to also characterize expression levels in normal arteries, we included different bypass graft arteries not affected by advanced atherosclerosis in our study.
Calcification of atherosclerotic plaques and age
As shown in the present study, age correlated with the degree of calcification of atheromatous carotids in patients with proven calcification of the atheroma. This is in line with previous studies showing that, in patients with coronary heart disease and atherosclerosis, the extent of calcification highly correlates with age and mortality [7]. In carotid plaques, destabilization and thus fatal ischemic events have been associated with increased deposition of calcified matrix vesicles and microcalcifications [21]. In patients with end-stage renal disease the coronary calcium score increased with age [7]. Also, the presence of calcium in renal arteries was significantly associated with age [22]. To our knowledge, our investigations represent the first study confirming this association also in carotid atheromatous plaques.
Expression of inhibitors of calcification in calcified atherosclerotic plaques
As shown for the first time in the present study NPP1 – an enzyme generating the mineralization inhibitor PPi – is down-regulated in calcified stenotic carotid arteries, i.e. in intimal calcification. In normal arteries and in non-calcified atherosclerotic plaques, NPP1 expression levels are comparable. As previously reported, NPP1 plays an important role in medial calcification in human beings and animal models [16, 23, 24]. NPP1 levels and activity are reduced or even deficient in patients with generalized arterial calcification of infancy, a disorder caused by mutations in the ENPP1 gene [16, 23]. Moreover, ENPP1 polymorphisms have been associated with insulin resistance and atherogenic phenotypes, including coronary calcification and myocardial infarction [17, 18, 25]. The pathogenic mechanism underlying this link is most likely to be on the one hand a consequence of systemic abnormalities, which are associated to insulin resistance, such as arterial hypertension, obesity and dyslipidaemia [26]. On the other hand, atherosclerosis may derive secondary to a direct deleterious effect of impaired insulin signalling on the endothelium leading to reduced insulin-stimulated nitric oxide release and decreased vasodilatation [27]. However, these systemic effects, which are associated with increased NPP1 plasma levels interfering with insulin signalling [28], were beyond the scope of our study.
Interestingly, although generally down-regulated in calcified carotid atheroma, NPP1-levels positively correlated with the degree of calcification in our study. Our data suggest that a reduction of NPP1 expression is also a trigger of intimal calcification. The positive correlation of NPP1 levels with the degree of plaque calcifications furthermore suggests a counter-regulative mechanism, which in the end turns out to be insufficient to prevent further progression of calcification. Such a regulatory role has already been proposed for other inhibitory matrix proteins, including matrix Gla protein (MGP) [29] and OPN [29, 30], the expression of which has been found to correlate with increasing plaque calcification.
OPN mRNA levels were also up-regulated in carotid plaques in our study. However, marked deposits of OPN were found only in strongly calcified carotid atheromatous lesions closely associated with hydroxyapatite clusters. OPN is a known inhibitor of vascular mineralization [31–33]. Typically, OPN is associated with mineralized deposits in human atherosclerotic plaques [33]. Reportedly, OPN serum levels are elevated in patients with carotid stenosis and have been discussed as potential markers of vulnerable carotid plaques [34]. Taken together these data and ours, one may suggest that during atherogenesis and early stages of calcification, OPN is released into the circulation. Only with progressing calcification OPN is deposited and accumulated in the calcified area of the plaque.
Interestingly, in calcified carotid plaques, we observed a positive correlation between NPP1 and OPN expression levels, indicating a common regulatory pathway. This would be in line with previous studies suggesting down-regulated OPN expression in defective NPP1 expression [35]. The results of our study furthermore prove the current concept of arterial calcification being an active process, which is orchestrated by accelerators of calcification including alkaline phosphatase, BMP-2, BMP-4, osteocalcin and bone sialoprotein and by inhibitors such as MGP and OPN [29, 30].
Expression of inhibitors of calcification and risk factors of atherosclerosis
Differential relations between NPP1, OPN and pro-atherogenic factors were observed in the present study.
Lower levels of NPP1 were detected in the plaque of male and in obese patients; both groups are known to have an increased prevalence of atherosclerosis and increased burden of calcification. As shown by Gonzales-Sanchez and coworkers the ENPP1 121Q allele might contribute to the genetic susceptibility to abdominal obesity among subjects with metabolic syndrome [36]. Moreover, adipocyte maturation is enhanced in the absence of NPP1, and adipocyte maturation was more efficient in mesenchymal embryonal cells from ENPP1 knockout mice than from wild-type mice [37]. Our data indicate that in both groups compromised inhibition of calcification by NPP1 may augment the intimal calcification. However, we did not measure NPP1 serum levels in the patients to validate this hypothesis.
OPN expression was lower in calcified plaques of patients with hypercholesterolemia and diabetes. Reportedly, both hypercholesterolemia and diabetes are pro-atherogenic and are directly related to the prevalence and extent of coronary artery calcification [38, 39]. Plasma levels of OPN are not associated with plasma cholesterol metabolites but with tissue markers of cholesterol synthesis, indicating an interplay between OPN and cholesterol metabolism in the plaque [40].
Interestingly, in our study lipid lowering therapy by statins was associated with decreased expression levels of NPP1 and OPN in the plaque. Furthermore, plaques of statin treated patients were less calcified. Reportedly, statins not only reduce the anatomic burden of coronary artery disease but also that of calcification [41, 42]. Whether the effect of statins on NPP1 and OPN is mediated via their effect on lipid metabolism or by a pleitropic mechanism has to be elucidated.
As mentioned above, expression of NPP1 and OPN positively correlated in the calcified carotid plaque. Since both inhibitors of calcification are affected by alterations of the lipid metabolism and lipid profile, looking for a common regulating pathway in this area might be promising.
Taken together, our study demonstrates that the inhibitor of media calcification NPP1 is down-regulated in calcified advanced plaques. Interestingly, NPP1 levels are higher in severely calcified lesions, most likely reflecting a counter-active mechanism. We therefore conclude that NPP1 serves as a novel player orchestrating plaque calcification. Moreover, our data suggest an interplay between NPP1, OPN and potent risk factors of atherosclerosis.
Acknowledgments
F.R, G.W.-P. and Y.N. were supported by a grant from the Deutsche Forschungsgemeinschaft (SFB 492, subproject A12). The authors thank Ulrike Botschen, Elisabeth Lange and Brigitta Weißen for expert technical assistance.
Supporting Information
Uncalcified core region of a plaque: Individual data of immunofluorescence signals using the appropriate filter blocks. Right part shows merged images.
Moderately calcified region of the basis of a plaque: Individual data of immunofluorescence signals using the appropriate filter blocks. Right part shows merged images.
Severely calcified region of the core of a plaque: Individual data of immunofluorescence signals using the appropriate filter blocks. Right part shows merged images.
Primer and PCR characteristics
References
- 1.Jeziorska M, McCollum C, Woolley DE. Calcification in atherosclerotic plaque of human carotid arteries: associations with mast cells and macrophages. J Pathol. 1998;185:10–7. doi: 10.1002/(SICI)1096-9896(199805)185:1<10::AID-PATH71>3.0.CO;2-0. [DOI] [PubMed] [Google Scholar]
- 2.Caira FC, Stock SR, Gleason TG, et al. Human degenerative valve disease is associated with up-regulation of low-density lipoprotein receptor-related protein 5 receptor-mediated bone formation. J Am Coll Cardiol. 2006;47:1707–12. doi: 10.1016/j.jacc.2006.02.040. [DOI] [PMC free article] [PubMed] [Google Scholar]
- 3.Rajamannan NM, Subramaniam M, Rickard D, et al. Human aortic valve calcification is associated with an osteoblast phenotype. Circulation. 2003;107:2181–4. doi: 10.1161/01.CIR.0000070591.21548.69. [DOI] [PMC free article] [PubMed] [Google Scholar]
- 4.Cario-Toumaniantz C, Boularan C, Schurgers LJ, et al. Identification of differentially expressed genes in human varicose veins: involvement of matrix gla protein in extracellular matrix remodeling. J Vasc Res. 2007;44:444–59. doi: 10.1159/000106189. [DOI] [PubMed] [Google Scholar]
- 5.Doherty TM, Asotra K, Fitzpatrick LA, et al. Calcification in atherosclerosis: bone biology and chronic inflammation at the arterial crossroads. Proc Natl Acad Sci USA. 2003;100:11201–6. doi: 10.1073/pnas.1932554100. [DOI] [PMC free article] [PubMed] [Google Scholar]
- 6.Johnson RC, Leopold JA, Loscalzo J. Vascular calcification: pathobiological mechanisms and clinical implications. Circurlation Res. 2006;99:1044–59. doi: 10.1161/01.RES.0000249379.55535.21. [DOI] [PubMed] [Google Scholar]
- 7.Abbott RD, Ueshima H, Masaki KH, et al. Coronary artery calcification and total mortality in elderly men. J Am Geriatr Soc. 2007;55:1948–54. doi: 10.1111/j.1532-5415.2007.01454.x. [DOI] [PubMed] [Google Scholar]
- 8.Eller P, Hochegger K, Feuchtner GM, et al. Impact of ENPP1 genotype on arterial calcification in patients with end-stage renal failure. Nephrol Dial Transplant. 2008;23:321–7. doi: 10.1093/ndt/gfm566. [DOI] [PubMed] [Google Scholar]
- 9.Niskanen LK, Suhonen M, Siitonen O, et al. Aortic and lower limb artery calcification in type 2 (non-insulin-dependent) diabetic patients and non-diabetic control subjects. A five year follow-up study. Atherosclerosis. 1990;84:61–71. doi: 10.1016/0021-9150(90)90009-8. [DOI] [PubMed] [Google Scholar]
- 10.Li ZY, Howarth S, Tang T, et al. Does calcium deposition play a role in the stability of atheroma? Location may be the key. Cerebrovasc Dis. 2007;24:452–9. doi: 10.1159/000108436. [DOI] [PubMed] [Google Scholar]
- 11.Garcia JH, Khang-Loon H. Carotid atherosclerosis. Definition, pathogenesis, and clinical significance. Neuroimaging Clin N Am. 1996;6:801–10. [PubMed] [Google Scholar]
- 12.Hsu HH, Camacho NP, Sun F, et al. Isolation of calcifiable vesicles from aortas of rabbits fed with high cholesterol diets. Atherosclerosis. 2000;153:337–48. doi: 10.1016/s0021-9150(00)00425-1. [DOI] [PubMed] [Google Scholar]
- 13.Weissen-Plenz G, Nitschke Y, Rutsch F. Mechanisms of arterial calcification: spotlight on the inhibitors. Adv Clin Chem. 2008;46:263–93. [PubMed] [Google Scholar]
- 14.Rutsch F, Vaingankar S, Johnson K, et al. PC-1 nucleoside triphosphate pyrophosphohydrolase deficiency in idiopathic infantile arterial calcification. Am J Pathol. 2001;158:543–54. doi: 10.1016/S0002-9440(10)63996-X. [DOI] [PMC free article] [PubMed] [Google Scholar]
- 15.Okawa A, Nakamura I, Goto S, et al. Mutation in Npps in a mouse model of ossification of the posterior longitudinal ligament of the spine. Nat Genet. 1998;19:271–3. doi: 10.1038/956. [DOI] [PubMed] [Google Scholar]
- 16.Rutsch F, Böyer P, Nitschke Y, et al. Hypophosphatemia, hyperphosphaturia, and bisphosphonate treatment are associated with survival beyond infancy in generalized arterial calcification of infancy. Circ Cardiovasc Genet. 2008;1:133–40. doi: 10.1161/CIRCGENETICS.108.797704. [DOI] [PMC free article] [PubMed] [Google Scholar]
- 17.Eller P, Schgoer W, Mueller T, et al. The K121Q polymorphism of ENPP1 and peripheral arterial disease. Heart Vessels. 2008;23:104–7. doi: 10.1007/s00380-007-1014-9. [DOI] [PubMed] [Google Scholar]
- 18.Bacci S, Ludovico O, Prudente S, et al. The K121Q polymorphism of the ENPP1/PC-1 gene is associated with insulin resistance/atherogenic phenotypes, including earlier onset of type 2 diabetes and myocardial infarction. Diabetes. 2005;54:3021–5. doi: 10.2337/diabetes.54.10.3021. [DOI] [PubMed] [Google Scholar]
- 19.Solan JL, Deftos LJ, Goding JW, et al. Expression of the nucleoside triphosphate pyrophosphohydrolase PC-1 is induced by basic fibroblast growth factor (bFGF) and modulated by activation of the protein kinase A and C pathways in osteoblast-like osteosarcoma cells. J Bone Miner Res. 1996;11:183–92. doi: 10.1002/jbmr.5650110207. [DOI] [PubMed] [Google Scholar]
- 20.Ulzheimer S, Kalender WA. Assessment of calcium scoring performance in cardiac computed tomography. Eur Radiol. 2003;13:484–97. doi: 10.1007/s00330-002-1746-y. [DOI] [PubMed] [Google Scholar]
- 21.Bobryshev YV, Killingsworth MC, Lord RS, et al. Matrix vesicles in the fibrous cap of atherosclerotic plaque: possible contribution to plaque rupture. J Cell Mol Med. 2008;12:2073–82. doi: 10.1111/j.1582-4934.2008.00230.x. [DOI] [PMC free article] [PubMed] [Google Scholar]
- 22.Allison MA, DiTomasso D, Criqui MH, et al. Renal artery calcium: relationship to systemic calcified atherosclerosis. Vasc Med. 2006;11:232–8. doi: 10.1177/1358863x06073449. [DOI] [PubMed] [Google Scholar]
- 23.Rutsch F, Ruf N, Vaingankar S, et al. Mutations in ENPP1 are associated with ‘idiopathic’ infantile arterial calcification. Nat Genet. 2003;34:379–81. doi: 10.1038/ng1221. [DOI] [PubMed] [Google Scholar]
- 24.Johnson K, Polewski M, Van Etten D, et al. Chondrogenesis mediated by PPi depletion promotes spontaneous aortic calcification in NPP1-/- mice. Arterioscler Thromb Vasc Biol. 2005;25:686–91. doi: 10.1161/01.ATV.0000154774.71187.f0. [DOI] [PubMed] [Google Scholar]
- 25.McAteer JB, Prudente S, Bacci S, et al. The ENPP1 K121Q polymorphism is associated with type 2 diabetes in European populations: evidence from an updated meta-analysis in 42,042 subjects. Diabetes. 2008;57:1125–30. doi: 10.2337/db07-1336. [DOI] [PubMed] [Google Scholar]
- 26.Howard G, O’Leary DH, Zaccaro D, et al. Insulin sensitivity and atherosclerosis. Circulation. 1996;93:1809–17. doi: 10.1161/01.cir.93.10.1809. [DOI] [PubMed] [Google Scholar]
- 27.Federici M, Pandolfi A, De Filippis E, et al. G972R IRS-1 variant impairs insulin regulation of endothelial nitric oxide synthase in cultured human endothelial cells. Circulation. 2004;109:399–405. doi: 10.1161/01.CIR.0000109498.77895.6F. [DOI] [PubMed] [Google Scholar]
- 28.Meyre D, Bouatia-Naji N, Tounian A, et al. Variants of ENPP1 are associated with childhood and adult obesity and increase the risk of glucose intolerance and type 2 diabetes. Nat Genet. 2005;37:863–7. doi: 10.1038/ng1604. [DOI] [PMC free article] [PubMed] [Google Scholar]
- 29.Dhore CR, Cleutjens JPM, Lutgens E, et al. Differential expression of bone matrix regulatory proteins in human atherosclerotic plaques. Arterioscler Thromb Vasc Biol. 2001;21:1998–2003. doi: 10.1161/hq1201.100229. [DOI] [PubMed] [Google Scholar]
- 30.Aikawa E, Nahrendorf M, Figueiredo JL, et al. Osteogenesis associates with inflammation in early-stage atherosclerosis evaluated by molecular imaging in vivo. Circulation. 2007;116:2841–50. doi: 10.1161/CIRCULATIONAHA.107.732867. [DOI] [PubMed] [Google Scholar]
- 31.Scatena M, Liaw L, Giachelli CM. Osteopontin: a multifunctional molecule regulating chronic inflammation and vascular disease. Arterioscler Thromb Vasc Biol. 2007;27:2302–9. doi: 10.1161/ATVBAHA.107.144824. [DOI] [PubMed] [Google Scholar]
- 32.Bini A, Mann KG, Kudryk BJ, et al. Noncollagenous bone matrix proteins, calcification, and thrombosis in carotid artery atherosclerosis. Arterioscler Thromb Vasc Biol. 1999;19:1852–61. doi: 10.1161/01.atv.19.8.1852. [DOI] [PubMed] [Google Scholar]
- 33.Giachelli CM, Bae N, Almeida M, et al. Osteopontin is elevated during neointima formation in rat arteries and is a novel component of human atherosclerotic plaques. J Clin Invest. 1993;92:1686–96. doi: 10.1172/JCI116755. [DOI] [PMC free article] [PubMed] [Google Scholar]
- 34.Kadoglou NP, Gerasimidis T, Golemati S, et al. The relationship between serum levels of vascular calcification inhibitors and carotid plaque vulnerability. J Vasc Surg. 2008;47:55–62. doi: 10.1016/j.jvs.2007.09.058. [DOI] [PubMed] [Google Scholar]
- 35.Johnson K, Goding J, Van Etten D, et al. Linked deficiencies in extracellular PP(i) and osteopontin mediate pathologic calcification associated with defective PC-1 and ANK expression. J Bone Miner Res. 2003;18:994–1004. doi: 10.1359/jbmr.2003.18.6.994. [DOI] [PubMed] [Google Scholar]
- 36.Gonzalez-Sanchez JL, Zabena C, Martinez-Larrad MT, et al. Association of ENPP1 (PC-1) K121Q polymorphism with obesity-related parameters in subjects with metabolic syndrome. Clin Endocrinol. 2008;68:724–7. doi: 10.1111/j.1365-2265.2007.03103.x. [DOI] [PubMed] [Google Scholar]
- 37.Liang J, Fu M, Ciociola E, et al. Role of ENPP1 on adipocyte maturation. PLoS ONE. 2007;2:1–7. doi: 10.1371/journal.pone.0000882. [DOI] [PMC free article] [PubMed] [Google Scholar]
- 38.O'Malley PG, Taylor AJ, Jackson JL, et al. Prognostic value of coronary electron-beam computed tomography for coronary heart disease events in asymptomatic populations. Am J Cardiol. 2000;85:945–8. doi: 10.1016/s0002-9149(99)00906-6. [DOI] [PubMed] [Google Scholar]
- 39.O’Rourke RA, Brundage BH, Froelicher VF, et al. American College of Cardiology/American Heart Association Expert Consensus document on electron-beam computed tomography for the diagnosis and prognosis of coronary artery disease. Circulation. 2000;102:126–40. doi: 10.1161/01.cir.102.1.126. [DOI] [PubMed] [Google Scholar]
- 40.Luomala M, Paiva H, Thelen K, et al. Osteopontin levels are associated with cholesterol synthesis markers in mildly hypercholesterolaemic patients. Acta Cardiol. 2007;62:177–81. doi: 10.2143/AC.62.2.2020239. [DOI] [PubMed] [Google Scholar]
- 41.Rajamannan NM, Subramaniam M, Caira F, et al. Atorvastatin inhibits hypercholesterolemia-induced calcification in the aortic valves via the Lrp5 receptor pathway. Circulation. 2005;112:1229–34. doi: 10.1161/01.CIRCULATIONAHA.104.524306. [DOI] [PMC free article] [PubMed] [Google Scholar]
- 42.McCullough PA. Effect of lipid modification on progression of coronary calcification. J Am Soc Nephrol. 2005;16:S115–9. doi: 10.1681/ASN.2005060664. [DOI] [PubMed] [Google Scholar]
Associated Data
This section collects any data citations, data availability statements, or supplementary materials included in this article.
Supplementary Materials
Uncalcified core region of a plaque: Individual data of immunofluorescence signals using the appropriate filter blocks. Right part shows merged images.
Moderately calcified region of the basis of a plaque: Individual data of immunofluorescence signals using the appropriate filter blocks. Right part shows merged images.
Severely calcified region of the core of a plaque: Individual data of immunofluorescence signals using the appropriate filter blocks. Right part shows merged images.
Primer and PCR characteristics