Abstract
Calcineurin is an important signalling protein that regulates a number of molecular and cellular processes. Previously, we found that inhibition of calcineurin with cyclosporine reduced renal hypertrophy and blocked glomerular matrix expansion in the diabetic kidney. Isoforms of the catalytic subunit of calcineurin are reported to have tissue specific expression and functions. In particular, the β isoform has been implicated in cardiac and skeletal muscle hypertrophy. Therefore, we examined the role of calcineurin β in diabetic renal hypertrophy and glomerular matrix expansion. Type I diabetes was induced in wild-type and β−/− mice and then renal function, extracellular matrix expansion and hypertrophy were evaluated. The absence of β produced a significant decrease in total calcineurin activity in the inner medulla (IM) and reduced nuclear factor of activated T-cells (NFATc) activity. Loss of β did not alter diabetic renal dysfunction assessed by glomerular filtration rate, urine albumin excretion and blood urea nitrogen. Similarly, matrix expansion in the whole kidney and glomerulus was not different between diabetic wild-type and β−/− mice. In contrast, whole kidney and glomerular hypertrophy were significantly reduced in diabetic β−/− mice. Moreover, β−/− renal fibroblasts demonstrated impaired phosphorylation of Erk1/Erk2, c-Jun N-terminal kinases (JNK) and mammalian target of rapamycin (mTOR) following stimulation with transforming growth factor-β and did not undergo hypertrophy with 48 hrs culture in high glucose. In conclusion, loss of the β isoform of calcineurin is sufficient to reproduce beneficial aspects of cyclosporine on diabetic renal hypertrophy but not matrix expansion. Therefore, while multiple signals appear to regulate matrix, calcineurin β appears to be a central mechanism involved in organ hypertrophy.
Keywords: calcineurin, cyclosporine, diabetes, renal hypertrophy
Introduction
Calcineurin, a Ca +/calmodulin-dependent protein phosphatase, is an important signalling molecule and has been implicated in hypertrophy of a variety of cell types [1–6]. Previously, we examined hypertrophy-mediated signalling mechanisms in glomerular mesangial cells and found that inhibition of calcineurin effectively blocked insulin-like growth (IGF)-I-mediated hypertrophy [5]. Furthermore, we found that calcineurin was required for IGF-I and transforming growth factor (TGF)-β-induced extracellular matrix (ECM) deposition [5, 6]. In both pathways, the downstream calcineurin target NFATc was activated. Inhibition of proximal TGF-β signalling (i.e. within less than 30 min.) effectively blocked matrix regulation up to 72 hrs later, suggesting that calcineurin acts primarily via transcriptional regulation of matrix proteins. Supporting this, we found that TGF-β-mediated transcriptional regulation of fibronectin could be inhibited by cyclosporine [6]. Moreover, over expression of a dominant-negative NFATc protein or an NFATc inhibitory peptide (VIVIT) blocked TGF-β-mediated up regulation of fibronectin [7]. Because TGF-β is a central player in diabetic EMC regulation, these data suggested that the calcineurin/NFATc pathway may play a novel role in the renal response to diabetes.
We tested this hypothesis by inducing type I diabetes in rats and administered a low dose of cyclosporine daily for up to 2 weeks. Consistent with our in vitro findings, inhibition of calcineurin partially reduced whole kidney hypertrophy and dramatically blocked glomerular hypertrophy. In addition, glomerular matrix expansion and TGF-β expression in cyclosporine-treated diabetic rats was reduced [8]. From this study, we concluded that calcineurin is a key player in the mesangial cell response to hyperglycaemia and that targeting of this pathway may be an effective strategy to improve and/or preserve diabetic renal function.
To investigate this possibility further, we examined the kidneys of mice lacking either α or β isoform of the catalytic subunit of calcineurin. Interestingly, we found that loss of the α isoform resulted in increased matrix expansion and renal dysfunction [9]. in vitro, loss of the α isoform had no effect on NFATc whereas loss of the β completely abrogated NFATc transcriptional activity and nuclear localization [7]. Loss of NFATc regulation in β−/− but not α−/− renal fibroblasts suggested that β null mice may be protected from diabetic renal changes. Therefore, we examined both matrix regulation and hypertrophy in wild-type and β−/− control and diabetic mice. We now report that loss of the β isoform alone is not sufficient to prevent renal matrix accumulation in response to diabetes. However, β−/− mice showed a significant attenuation of both whole kidney and glomerular hypertrophy.
Materials and methods
Animal models
Calcineurin A-β knockout (β−/−) mice and transgenic NFATc-luciferase (NFATc-luc) reporter mice were created by J. Molkentin (Cincinnati Children's Hospital, Cincinnati, OH, USA) as described previously and were kindly gifted to our laboratory [10, 11]. All procedures were completed in accordance with the guidelines of the Institutional Animal Care and Use Committee at the Atlanta VA Medical Center. β−/− mice were crossed with NFAT-luc mice to obtain β−/−/NFAT-luc hemizygous mice on a mixed genetic background; therefore, all experiments were carried out using lit-termate controls. β−/− mice and their wild-type littermates weighing between 25 and 30 g were administered either 55 mg/kg body weight streptozotocin (STZ) in sodium citrate buffer (pH 4.0) or sodium citrate buffer alone intraperitoneally once daily for 4 days to induce diabetes. Blood glucose levels were monitored using a LifeScan One Touch glucometer (Johnson & Johnson, Langhorne, PA, USA) 1 week following the last injection of STZ and mice with blood glucose levels more than 200 mg/dl were considered diabetic. Diabetic mice were maintained for 6 weeks and blood glucose levels were monitored weekly. At the end of 1 or 6 weeks of diabetes mice were housed in metabolic cages (Nalgene, Rochester, NY, USA) with ad libitum food and water and urine was collected over 24 hrs. Urinary blood urea nitrogen (BUN), osmolality, protein and albumin were determined. Mice were then killed and blood obtained to estimate glucose and BUN and kidneys were weighed and processed for histopathological examination.
Calcineurin phosphatase assay
Calcineurin phosphatase activity was determined as described [12]. Briefly, the calcineurin substrate peptide RII was synthesized with a phospho-serine at residue 15 and an amino-terminus TAMRA fluorescent tag. In a 96-well plate, the labelled substrate was mixed in equal parts with reaction buffer and sample and allowed to incubate at 30°C for 10 min. Each well was then transferred to a 96-well plate coated with titanium-oxide (Glygen, Baltimore, MD, USA) followed by gentle shaking to allow binding of phosphorylated substrate. Finally, supernatants containing unbound peptide were then moved to a new 96-well plate and the amount of dephosphorylated peptide was determined by fluorimetry at 485 nm excitation and 528 nm emission. Calcineurin activity was then determined by extrapolating fluorescence of experimental samples from a standard curve of purified calcineurin (Sigma-Aldrich, St. Louis, MO, USA).
NFATc promoter experiments
Dissected renal cortices, outer medullae (OM) and inner medullae (IM) were homogenized and NFATc-mediated luciferase activity was measured using a commercial kit (Promega, Madison, WI, USA). Briefly, tissue sections were homogenized with 1 μl/μg lysis buffer and particulate matter separated by centrifugation. Luciferase assay reagent (100 μl) was added to 20 μl of supernatant and luminescence was measured for 10 sec. using an OptoComp luminometer (MGM Instruments, Hamden, CT, USA). Results were normalized by subtracting values obtained from identically processed samples from NFATc-luc negative littermate mice.
TGF-β ELISA
TGF-β levels in the sera of mice were determined using a commercial kit according to the manufacturer's instructions (Promega).
Histology
Kidneys were immediately immersed in formalin or snap frozen in liquid nitrogen for further analyses. (1) Morphological studies: Formalin fixed sections were embedded in paraffin and sectioned at 4 μm and then stained with haematoxylin and eosin for routine histology or silver staining for examination of matrix proteins. For quantitation of glomerular size, kidney sections from diabetic and control wild-type and β−/− mice were photographed under light microscopy at identical magnification. The sizes of glomeruli were measured using ImagePro (Media Cybernetics, Bethesda, MD, USA) software. Area sizes of at least 50 glomeruli from at least four mice from each group were measured and two-way anova was performed to determine a difference between the four groups; P < 0.05 was considered a significant difference. (2) Immunofluorescence: 6-μm-thick frozen sections were mounted on glass slides and then fixed in acetone. Sections were rehydrated in PBS-0.1% bovine serum albumin (BSA) before blocking with the appropriate IgG. Primary antibodies were added at concentrations between 10 and 20 μg/ml for 1 hr at room temperature. After incubation with primary antibodies, sections were washed three times for 5 min. each time in PBS-0.1% BSA. Fluorescence-conjugated secondary antibodies were added at dilutions of 1:100 for 45 min. at room temperature followed by washing in PBS-0.1% BSA. Sections were mounted with Crystal Mount (Dako, Denmark) and allowed to dry before viewing with fluorescence microscopy.
Western blots
β-null and wild-type fibroblasts were previously described [7]. Cells were plated in 60 mm dishes and allowed to grow to 80–90% confluence and the medium was changed to serum-free medium for 24 hrs and the cells were treated with TGF-β (1 ng/ml) for 15 min. or 1.2 mM glucose for 72 hrs as indicated. Cells were harvested with trypsin-EDTA, pelleted, washed with 1 × PBS and lysed using Tris NP-40 EDTA sodium chloride orthovanadate (TNESV) lysis buffer (50 mM Tris-HCl pH 7.4, 2 mM EDTA, 1% NP-40, 100 mM NaCl, 100 mM Na orthovanadate, 100 μg/ml leupeptin, 20 μg/ml aprotonin and 10−7 M phenylmethylsulfonyl). A total of 25 μg of protein was separated by 7.5% SDS-PAGE and proteins transferred to nitrocellulose. The membrane was incubated in 5% milk-Tris buffered saline (TBST) (20 mM Tris-HCl, pH 7.6, 137 mM NaCl, 0.1% Tween 20) and then immunoblotted with appropriate dilutions of primary antibodies as specified by the manufacturer. Total and phospho Akt, ERK1/2, mTOR, as well as actin, collagen IV and fibronectin primary antibodies were purchased from Cell Signaling Technology (Danvers, MA, USA) and SantaCruz Biotechnology (SantaCruz, CA, USA). Membranes were then incubated with horseradish peroxidase (HRP)-conjugated secondary antibody, and proteins were visualized by enhanced chemiluminescence (Pierce, Rockford, IL, USA).
Results
Induction of diabetes and renal changes
Type 1 diabetes was induced in wild-type and β−/− mice following a multiple low dose STZ protocol of administration. Glucose levels were measured 7 days following the final injection of STZ and weekly thereafter for 6 weeks. Interestingly, β−/− mice showed an increased sensitivity to STZ and glucose levels at 1 and 2 weeks were significantly higher than STZ-treated wild-type littermates (P< 0.01). However, comparable levels of hyperglycaemia were established in both wild-type and β−/− mice by 3 weeks and the two groups were not different through the end of the study period (Fig. 1A). Diabetes was well tolerated in the mice and, on average, all four groups gained weight over the course of the experiment (Fig. 1B). There were no significant differences in weight gain between any of the groups. The decline in renal function in wild-type and β−/− diabetic mice as measured by BUN was also comparable, and there was no difference in glomerular filtration rate. Urine excretion and concentration were also similar. On the other hand, β−/− diabetic mice lost significantly more albumin in the urine than diabetic wild-type mice. Likewise, total protein excretion was higher in control and diabetic β−/− mice suggesting mild renal dysfunction in the vehicle-treated β−/− mice that is exacerbated by diabetes (Table 1).
Fig 1.
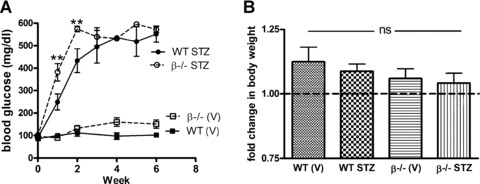
Establishment of diabetes in wild-type and β−/− mice with a multiple low dose STZ protocol. (A) Diabetes was induced in wild-type and β−/− littermate mice following the multiple low dose STZ protocol. Diabetes was confirmed 7 days following the final injection and then glucose levels were weekly for 6 weeks. Data shown are the mean ± S.E.M. of glucose levels for 8–10 mice per group at each time-point. **P< 0.01 compared to wild-type (two-way anova). (B) Body weights were determined at the start of the experimental protocol and after 6 weeks of diabetes. Data shown are the mean ± S.E.M. change in body weight of 8–10 mice per group.
Table 1.
Renal function of wild-type and β−/− mice after 6 weeks of diabetes
| Wild-type | β−/− | ||||||||||||
|---|---|---|---|---|---|---|---|---|---|---|---|---|---|
| Vehicle | STZ | Vehicle | STZ | ||||||||||
| Serum glucose (mg/dl) | 95.5 ± .5 | 559.2 ± 34.7** | 151.2 ± 18.2 | 581.5 ± 8.8** | |||||||||
| BUN (mg/dl) | 24.8 ± 1.3 | 35.5 ± 3.4* | 28.6 ± 1.3 | 37.2 ± 2.6* | |||||||||
| Glomerular filtration rate (mg/dl/min) | 5.5 ± 1.0 | 11.6 ± 2.2* | 8.5 ± 1.5 | 11.4 ± 1.4 | |||||||||
| Urine output (ml/hr) | 0.04 ± 0.006 | 0.38 ± 0.10** | 0.06 ± 0.007 | 0.45 ± 0.33** | |||||||||
| Urine osmolality | 1804 ± 9 | 1031 ± 69** | 1910 ± 170 | 1195 ± 79** | |||||||||
| U. albumin excretion (mg/ul) | 0.42 ± 0.11 | 1.67 ± .51* | 1.33±0.43## | 3.77 ± 0.55*# | |||||||||
| Urine total protein (mg/ul) | 0.71 ± 0.06 | 1.13 ± 0.43 | 1.35±0.23## | 1.99 ± 0.41 | |||||||||
After 6 weeks of diabetes, kidneys were harvested and total calcineurin activity and NFATc transactivation of a luciferase reporter were examined in renal cortices, OM and IM. First, the data show that calcineurin activity is generally similar in the cortex, OM, and IM of wild-type mice. Loss of the β isoform results in a significant decrease in the IM, consistent with previous reports that the IM is the site of highest β expression [13]. In wild-type mice, induction of diabetes did not change calcineurin activity in any kidney section. Interestingly, there was a significant increase in total calcineurin activity in the IM of β−/− mice with STZ treatment, suggesting that the remaining α isoform is activated in response to diabetes (Fig. 2A). Next, Fig. 2B shows that NFATc-mediated luciferase activity was highest in the IM (plotted on the right axis) and lowest in the cortex of wild-type mice. Loss of calcineurin β led to a significant decrease in NFATc activity in the IM, consistent with decreased activity shown in Fig. 2A. In contrast to the absence of an effect on overall calcineurin activity, diabetes reduced activity of the NFATc reporter construct in the wild-type mice. NFATc activity was slightly reduced in the cortex and OM and significantly decreased in the IM. There was no difference, however, in NFATc activity in the IM of diabetic β−/− mice.
Fig 2.
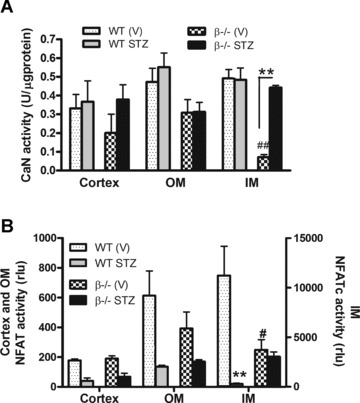
Changes in calcineurin and NFATc activity with loss of the β isoform and with diabetes. (A) After 6 weeks of diabetes, kidneys were obtained from control and diabetic wild-type and β−/− mice. Total calcineurin activity in cortex, OM, and IM was measured using a fluorimetric in vitro assay [12]. Data shown are the mean ± S.E.M. of triplicate reactions from four to six mice per group. **P< 0.01 compared to vehicle-treated; ##P< 0.01 compared to wild-type, two-way anova. (B) The remaining kidney from the same mice shown in (A) was dissected, homogenized in passive lysis buffer and NFATc-mediated luciferase production was measured. Data shown are the mean ± S.E.M. of four to six mice per group and expressed as relative luciferase units (rlu). Results for the cortex and OM are graphed on the left axis and results for the IM on the right. *P < 0.05, **P < 0.01, two-way anova.
Extracellular matrix accumulation in kidneys from wild-type and β−/− diabetic mice
Accumulation of ECM was assessed in control and diabetic wild-type and β−/− mice by Western blot analysis for fibronectin and collagen IV in whole kidney lysates. Figure 3A and B indicate that both fibronectin and collagen expression increased significantly in wild-type and β−/− diabetic mice. There was no significant difference in basal levels of fibronectin or collagen IV in control wild-type and β−/− mice. However, diabetic β−/− mice demonstrated significantly greater accumulation of fibronectin compared to STZ-treated wild-types.
Fig 3.
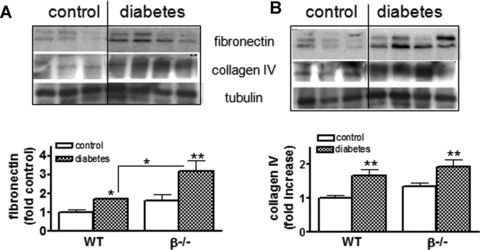
Matrix accumulation in the diabetic kidney is unchanged with loss of CnAβ. (A) Whole kidney lysates were prepared from wild-type and β−/− mice and expression of fibronectin was determined by Western blotting using specific antibodies. Results from six control and eight diabetic mice were then semi-quantitated and graphed. *P< 0.05, **P < 0.01 two-way anova. (B) Whole kidney lysates were prepared and expression of collagen IV determined by Western blotting using a specific antibody. Results from six to eight mice per group were then semi-quantitated and graphed. **P< 0.01, two-way anova.
Next, glomerular fibronectin and TGF-β expression were examined by immunofluorescence and quantitated (Fig. 4A and B). Diabetes resulted in a significant increase in both fibronectin and TGF-β in wild-type and β−/− mice. In addition, basal TGF-β levels were significantly higher in β−/− glomeruli compared to wild-types. Because TGF-β has been implicated in the up-regulation of matrix and has been shown to play an important role in diabetic nephropathy, TGF-β levels (pg/ml) in sera from both wild-type and diabetic mice were measured by ELISA. Circulating levels of TGF-β were slightly higher in β−/− mice (1282.94 ± 86.2 compared to 1045.5 ± 43.05) although the difference was not significant. Diabetes increased TGF-β levels in both groups – 1335.7 ± 52.18 in wild-types (P < 0.05 compared to wild-type control) and 1383.8 ± 67.0 β−/− diabetic mice to (ns compared to β−/− control).
Fig 4.
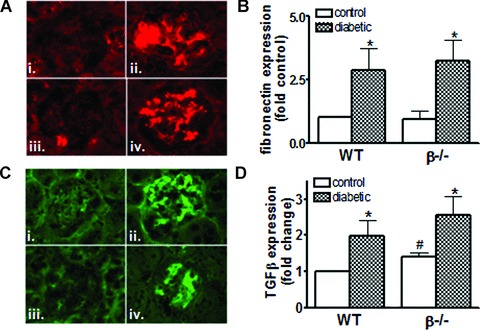
Expression of glomerular fibronectin and TGF-β are not reduced with loss of CnAβ (A) Fibronectin expression in control and diabetic wild-type (i, ii) and β−/−mice (iii, iv) was determined by immunofluorescence using Cy3-con-jugated secondary antibody to detect antifibronectin antibodies. (B) Results from four to six mice per group were then semi-quantitated and graphed. *P< 0.05, two-way anova. (C) TGF-β expression in control and diabetic wild-type (i, ii) and CnAβ−/− mice (iii, iv) was determined by immunofluorescence using fluoroscein isothiocyanate (FITC)-conjugated secondary antibody to detect anti- TGF-β antibodies. (D) Results from four to six mice per group were then semi-quantitated and graphed. *P < 0.05, **P < 0.01 compared to control; #P< 0.05 compared to wild-type, two-way anova with Bonferroni's post-test.
Renal hypertrophy of diabetic wild-type and β−/− mice
In addition to ECM accumulation, calcineurin has been implicated in regulation of hypertrophy. Therefore, we next examined whole kidney and glomerular hypertrophy in control and diabetic mice. Figure 5A shows that there was a significant increase in hypertrophy as measured by whole kidney to body weight ratio in wild-type mice as early as 1 week after the induction of diabetes. However, despite higher serum glucose levels (Fig. 1A), there was no increase in whole kidney hypertrophy in diabetic β−/− mice. Following 6 weeks of diabetes, wild-type and β−/− mice demonstrated significant whole kidney hypertrophy. However, the degree of hypertrophy was significantly less in diabetic β−/− mice compared to diabetic wild-types (Fig. 5B). Changes in kidney weight could be due to increased matrix accumulation, proliferation, or cellular hypertrophy. Figures 3 and 4 indicate that there is no difference in ECM accumulation in β−/− mice compared to wild-type. Likewise, the number of cells expressing the proliferation marker PCNA was comparable in diabetic wild-type and β−/− mice. These findings suggest that the increase in kidney to body weight ratio is due to cellular hypertrophy. To confirm this, silver stained kidney sections from each experimental group were analysed and the longitudinal area of the cortex, outer stripe of the outer medullae (OSOM), inner stripe of the outer medullae (ISOM) and IM were determined. Figure 5C shows representative longitudinal sections for each group. As expected, the majority of change with diabetes in the wild-type mice was due to increased area of the cortex and, to a lesser extent, the OSOM (Fig. 5D). In contrast, there was no increase in the size of the cortex with diabetes in β−/− mice, a significant difference from wild-type diabetic mice.
Fig 5.
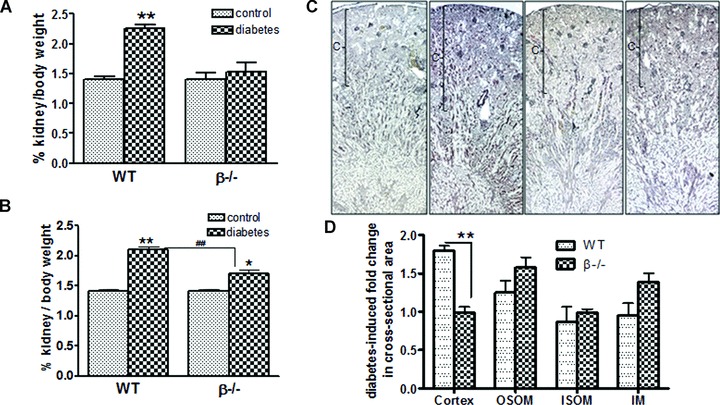
Diabetes-induced renal hypertrophy is attenuated in β−/− mice. Wild-type and β−/− control and diabetic mice were killed 1 week (A) and 6 weeks (B) after diabetes and kidney : body weight ratios determined. Data shown are the mean ± S.E.M. of six control and eight diabetic mice. *P< 0.05 and **P < 0.01 compared to control; ##P < 0.01 compared to wild-type, two-way anova with Bonferroni's post-test. (C) Control and diabetic wild-type and β−/− kidneys were sectioned and prepared with Silver stain for analyses of longitudinal axis of each major segment. Images shown are representative of each group; cortices are indicated with brackets. (D) The longitudinal axis was determined for the cortex, OSOM, ISOM and IM, and then the fold change with diabetes was calculated for wild-type and β−/− mice. Data shown are the mean ± S.E.M. fold change of four to six mice per group. **P< 0.01, two-way anova.
Next, glomerular hypertrophy was examined. As expected, the size of glomeruli significantly increased in wild-type mice after 6 weeks of diabetes (there was no change in glomerular hypertrophy after 1 week [data not shown]). Similar to results from analysis of whole kidney hypertrophy, glomerular hypertrophy was attenuated in β−/− diabetic mice (Fig. 6A and B).
Fig 6.
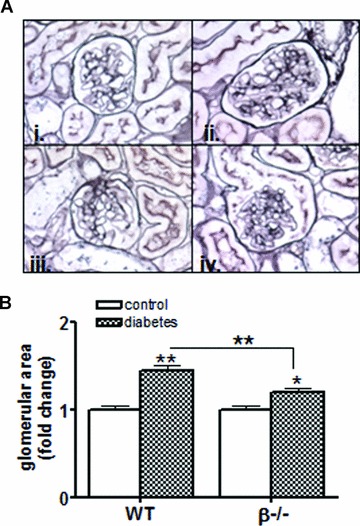
Diabetic glomerular hypertrophy is attenuated by loss of calcineurin β. (A) Kidney sections were obtained from wild-type and β−/− control and diabetic mice, fixed, sectioned and then prepared with silver stain. Sections were then imaged with light microscopy and representative images from 6 week control and diabetic wild-type (i,ii) and β−/− mice (iii, iv) are shown. (B) Glomerular sizes were quantitated from kidney sections prepared as described in (A) using ImagePro Software (Media Cybernetics). Data shown are the mean ± S.E.M. of six mice per group. *P< 0.05, **P< 0.01, two-way anova.
Finally, activation of signalling molecules implicated in cellular hypertrophy was examined in vitro in wild-type and β−/− fibroblasts. Cells were treated with TGF-β (1 ng/ml) for 15 min. and then total and phosphorylated JNK, Erk1/Erk2, mTOR and AKT were examined by Western blotting. Figure 7A shows that TGF-β treatment increased phosphorylation of JNK, Erk1/Erk2 and mTOR in wild-type cells. In contrast, β−/− cells failed to increase phosphorylation of the JNK, Erk1/Erk2 or mTOR in response to TGF-β. Finally, wild-type and β−/− cells were cultured for 48 hrs in high glucose and then hypertrophy was assessed by determination of protein and DNA content. As expected, there was a significant increase in protein/DNA ratio in wild-type renal fibroblasts. However, consistent with differences in Erk1/Erk2, JNK and mTOR signalling pathways, β−/− fibroblasts failed to undergo hypertrophy in response to 48 hrs of high glucose (Fig. 7C).
Fig 7.
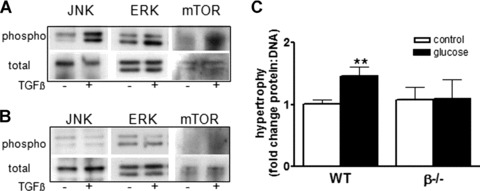
Loss of β alters activation of signalling pathways in renal fibroblasts. Total and phosphorylated JNK, Erk1/Erk2 and mTOR were examined in homogenates from wild-type (A) and β−/− (B) renal fibroblasts treated with TGF-β (1 ng/ml) for 15 min. by immunoblotting with specific antibodies. (C) Wild-type and β−/− renal fibroblasts were cultured with high glucose (1.2 mM) for 48 hrs and then hypertrophy assessed by determination of protein : ratio. Total protein was measured by the Bradford method and DNA content was determined by propidium iodide fluorescence. Data shown are the mean ± S.E.M. of three independent experiments. **P< 0.01, two-way anova.
Discussion
The role of calcineurin in the kidney is an area of growing scientific interest and clinical relevance. Inhibition of calcineurin with cyclosporine and Tacrolimus frequently result in nephrotoxicity including fibrosis and impaired renal function. Therefore, understanding the mechanisms of calcineurin action in the kidney is important for developing strategies to prevent or block calcineurin-inhibitor associated nephrotoxicity. The present study builds upon our previous observations that calcineurin is involved in renal ECM accumulation and hypertrophy [5–8]. Our findings indicated that the calcineurin/NFATc pathway was required for matrix accumulation and hypertrophy in mesangial cells [7], identifying a novel role for calcineurin in the kidney. This was in contrast to literature showing that inhibition of calcineurin in proximal tubule cells induced matrix expression [14, 15]. However, the difference between calcineurin action in mesangial cells and proximal tubule cells highlighted the complexity of calcineurin signalling specificity in different kidney cell types. One potential explanation for different actions of calcineurin is the differential roles for the isoforms of the catalytic subunit of calcineurin. Indeed, we have shown that the β isoform is sufficient for regulation of NFATc while the α is not [16]. This suggested that matrix regulation in glomeruli might be specifically regulated by the β isoform. In addition to this potential role of calcineurin β in the kidney, other groups have shown that calcineurin is a key player in cell hypertrophy [3, 4, 17–19]. More specifically, mice lacking the β isoform fail to mount a cardiac hypertrophic response following aortic banding [20]. To further examine the mechanism of calcineurin-mediated regulation of matrix accumulation and hypertrophy, we induced type I diabetes in β−/− mice and wild-type littermates and examined kidney function, ECM expression and whole kidney and glomerular hypertrophy. This study identified novel aspects of calcineurin function in all three areas.
First, we report that while overall calcineurin activity is similar in the cortex, OM and IM, loss of the β isoform significantly decreased activity only in the IM. This is consistent with previous reports showing that the IM is the region with the highest levels of β isoform expression [13, 21]. The remaining activity in the β−/− sections is attributable, therefore, to the α isoform which has been described to be expressed predominantly in the cortex and OM [13, 21]. However, it is interesting that the site of highest β activity appears to be the IM whereas the region most substantially affected by loss of β in the diabetic kidney is the cortex – the primary portion of the kidney generally responsible for compensatory hypertrophy. The most likely explanation for this is that β is involved in cellular events in multiple cells types. For example, we showed that β can play a direct role in cell hypertrophy. But this role does not exclude additional functions of β in the kidney. In addition, high expression and activity of β in the IM argues for a potential role in urine concentration, a possibility that merits further investigation.
Previously, we found that cultured cells lacking the α isoform retained NFATc regulation in response to calcium whereas cells lacking the β did not [16]. The current study provides additional evidence that the β isoform is necessary for regulation of NFATc in the kidney. First, similar to β expression, the highest site of NFATc luciferase activity is the IM. Likewise NFATc activity is dramatically reduced in β−/− kidneys. Interestingly, in wild-type kidneys, NFATc activity is reduced in diabetic animals. The changes were consistent across all three kidney segments but only reached significance in the IM. There are two possible interpretations of this result. First, β activity may be down-regulated with hyperfiltration and/or hypoosmolality and, in turn, decrease NFATc activity. If diabetes represents a state of decreased β activity, it would explain why there were no differences in glomerular function or urine production in β−/− diabetic mice compared to wild-type. However, a second possibility is that the NFATc reporter may be regulated by factors other than one of the calcineurin-dependent NFATc proteins. For example, a recent report demonstrated that the cal-cineurin-independent NFAT5, also known as tonicity enhancer binding protein (TonEBP), can also transactivate the NFATc-responsive luciferase promoter used in this study [22]. Decreased NFATc-mediated luciferase activity observed in wild-type diabetic mice could therefore be the result of down-regulation of TonEBP and would be consistent with a concentrating defect in diabetic animals. However, a lack of a similar decrease in β−/− diabetic mice argues against the latter scenario and for the former. Both possibilities are intriguing and merit further investigation.
Our previous data in vitro and in vivo strongly pointed to an important role for calcineurin in the regulation of matrix accumulation. We have also reported a connection between the β isoform and regulation of NFATc. Therefore, we suggested that β−/− mice would be protected from diabetes-induced matrix up-regulation. Data in this study, however, failed to support this model. Both whole kidney and glomerular ECM accumulation were essentially unchanged and, if anything, slightly increased in control β−/− mice. These findings occurred along with evidence for decreased NFATc activity, suggesting that calcineurin-mediated matrix regulation occurs via additional and/or p/NFATc-independent mechanisms. It is possible that although NFATc is necessary for TGF-β-mediated matrix accumulation in mesangial cells [7], additional fibrotic signals are involved in diabetic glomerular changes that do not require calcineurin β. Likewise, the ability of cyclosporine to block glomerular matrix accumulation in rats [8] may have been the result of inhibition of the α isoform or a combination of both α and β. Further experiments are necessary to fully understand the mechanism of calcineurin-mediated matrix accumulation in glomeruli.
In addition to matrix regulation, our laboratory and others have described a second important role for calcineurin in the regulation of hypertrophy. Indeed, calcineurin is well characterized to play a critical role in cardiac [19, 23–26] and skeletal muscle cell hypertrophy [3, 4]. Analyses of signalling pathways involved in these responses identified a requirement for transcriptional mediators including NFATs [19]. A particular role for the β isoform has also been described by Bueno et al. who reported that p-null mice have an impaired cardiac hypertrophic response [20]. Previously, we found that inhibition of calcineurin with cyclosporine reduced whole kidney hypertrophy and completely blocked glomerular hypertrophy in diabetic rats [8]. Consistent with these previous findings, data in the present study show that β−/− mice are protected from diabetes-induced renal hypertrophy. Whole kidney hypertrophy was assessed early in the diabetic disease process as well as after 6 weeks of hyperglycaemia. Kidney hypertrophy was absent in β−/− mice after 1 week of diabetes (despite higher glucose levels at this time-point) and significantly decreased compared to wild-type littermates after 6 weeks. Moreover, glomerular hypertrophy was also significantly attenuated in diabetic β−/− mice, suggesting that calcineurin β plays a fundamental role in regulation of hypertrophy in multiple renal cell types. This is the first demonstration that calcineurin β plays a role in hypertrophy in the kidney.
To further examine the mechanism of β-mediated renal cell hypertrophy, we examined signalling transduction pathways in wild-type and β−/− renal fibroblasts. Figure 7 shows that incubation with TGF-β resulted in increased phosphorylation of Erk1/Erk2, JNK and mTOR whereas Akt phosphorylation was unchanged. Long-term incubation in high glucose produced an increase in hypertrophy. The role of activated MAPKs such as Erk1/Erk2, JNK and p38 in the cell growth and hypertrophy is well documented [27]. In addition, recent evidence indicates that Raf-1/MEK/Erk pathways may interact with mTOR to stimulate protein synthesis and cell growth [28, 29]. We found that up-regulation of Erk1/Erk2, JNK and mTOR phosphorylation and hypertrophy were blocked in β−/− cells providing further evidence of a direct involvement of β in hypertrophic signalling in renal cells. These data also suggest that β may be involved in hypertrophy induced by mechanisms other than diabetes. Further experiments are warranted to determine if selective inhibition of β isoform prevents other forms of renal hypertrophy.
In conclusion, results from the current study build upon our previous work and demonstrate a novel role for calcineurin β in the kidney. While a lack of protection from diabetic-induced ECM accumulation suggests that β may not be necessary for regulation of matrix proteins, attenuation of hypertrophy reveals a specific requirement for the β isoform. Changes in in vitro signalling pathways in the absence of the β isoform confirm a direct role for the isoform in regulation of cellular hypertrophy. As such, these data contribute to our ongoing efforts to understand the mechanisms of calcineurin action in the kidney. In addition, these findings contribute to the growing body of literature showing that calcineurin is a critical regulator of organ hypertrophy and provide the first evidence of such a role in the kidney.
Acknowledgments
The authors acknowledge Hal Franch for helpful discussions and critica eview of the work. This project was funded by the NIH/NIDDK DK066422 J.L.G.) and DK50740 (S.R.P.).
Conflict of interests
The authors have no financial conflicts of interest to disclose.
References
- 1.Dunn S, Burns J, Michel R. Calcineurin is required for skeletal muscle hypertrophy. J Biol Chem. 1999;274:21908–12. doi: 10.1074/jbc.274.31.21908. [DOI] [PubMed] [Google Scholar]
- 2.Lim HW, De Windt LJ, Steinberg L, et al. Calcineurin expression, activation, and function in cardiac pressure-overload hypertrophy. Circulation. 2000;101:2431–7. doi: 10.1161/01.cir.101.20.2431. [DOI] [PubMed] [Google Scholar]
- 3.Musaro A, McCullagh KJ, Naya FJ, et al. IGF-I induces skeletal myocyte hypertrophy in association with GATA-2 and NF-ATc1. Nature. 1999;400:581–5. doi: 10.1038/23060. [DOI] [PubMed] [Google Scholar]
- 4.Semsarian C, Wu M-J, Ju Y-K, et al. Skeletal muscle hypertrophy is mediated by a Ca+-dependent calcineurin signalling pathway. Nature. 1999;400:576–80. doi: 10.1038/23054. [DOI] [PubMed] [Google Scholar]
- 5.Gooch JL, Tang Y, Ricono JM, et al. Insulin-like growth factor-I induces renal cell hypertrophy via a calcineurin-depend-ent mechanism. J Biol Chem. 2001;276:42492–500. doi: 10.1074/jbc.M102994200. [DOI] [PubMed] [Google Scholar]
- 6.Gooch JL, Gorin Y, Zhang BX, et al. Involvement of calcineurin in transforming growth factor-beta-mediated regulation of extracellular matrix accumulation. J Biol Chem. 2004;279:15561–70. doi: 10.1074/jbc.M308759200. [DOI] [PubMed] [Google Scholar]
- 7.Cobbs SL, Gooch JL. NFATc is required for TGFbeta-mediated transcriptional regulation of fibronectin. Biochem Biophys Res Commun. 2007;362:288–94. doi: 10.1016/j.bbrc.2007.07.186. [DOI] [PMC free article] [PubMed] [Google Scholar]
- 8.Gooch JL, Barnes JL, Garcia S, et al. Calcineurin is activated in diabetes and is required for glomerular hypertrophy and ECM accumulation. Am J Physiol Renal Physiol. 2003;284:F144–54. doi: 10.1152/ajprenal.00158.2002. [DOI] [PubMed] [Google Scholar]
- 9.Gooch JL, Toro JJ, Guler RL, et al. Calcineurin A-alpha but not A-beta is required for normal kidney development and function. Am J Pathol. 2004;165:1755–65. doi: 10.1016/s0002-9440(10)63430-x. [DOI] [PMC free article] [PubMed] [Google Scholar]
- 10.Bueno OF, Wilkins BJ, Tymitz KM, et al. Calcineurin Abeta-deficient mice. Proc Natl Acad Sci. 2002;99:4586–91. doi: 10.1073/pnas.072647999. [DOI] [PMC free article] [PubMed] [Google Scholar]
- 11.Wilkins BJ, Dai YS, Bueno OF, et al. Calcineurin/NFAT coupling participates in pathological, but not physiological, cardiac hypertrophy. Circ Res. 2004;94:110–8. doi: 10.1161/01.RES.0000109415.17511.18. [DOI] [PubMed] [Google Scholar]
- 12.Roberts B, Pohl J, Gooch JL. A fluorimet-ric method for determination of calcineurin activity. Cell Calcium. 2008;43:515–9. doi: 10.1016/j.ceca.2007.08.004. [DOI] [PMC free article] [PubMed] [Google Scholar]
- 13.Gooch JL, Pergola PE, Guler RL, et al. Differential expression of calcineurin A isoforms in the diabetic kidney. J Am Soc Neph. 2004;15:1421–9. doi: 10.1097/01.asn.0000128076.91545.bb. [DOI] [PubMed] [Google Scholar]
- 14.Wolf G, Killen PD, Neilson EG. Cyclosporin A stimulates transcription and procollagen secretion in tubulointersititial fibroblasts and proximal tubule cells. J Am Soc Neph. 1990;6:918–22. doi: 10.1681/ASN.V16918. [DOI] [PubMed] [Google Scholar]
- 15.Rocco M, Chen Y, Goldfarb S, et al. TGF-beta gene expression and bioactivity in proximal tubule. Kidney Intl. 1992;41:107–14. doi: 10.1038/ki.1992.14. [DOI] [PubMed] [Google Scholar]
- 16.Gooch JL, Roberts BR, Cobbs SL, et al. Loss of the alpha isoform of calcineurin is sufficient to induce nephrotoxicity and altered expression of TGFbeta. Transplantation. 2007;83:439–47. doi: 10.1097/01.tp.0000251423.78124.51. [DOI] [PubMed] [Google Scholar]
- 17.Sussman MA, Lim HW, Gude N, et al. Prevention of cadiac hypertrophy in mice by calcineurin inhibition. Science. 1998;281:1690–3. doi: 10.1126/science.281.5383.1690. [DOI] [PubMed] [Google Scholar]
- 18.Murat A, Pellieux C, Brunner H-R, et al. Calcineurin blockade prevents cardiac mitogen-activated protein kinase activation and hypertrophy in renovascular hypertension. J Biol Chem. 2000;275:40867–73. doi: 10.1074/jbc.M008071200. [DOI] [PubMed] [Google Scholar]
- 19.Molkentin J, Lu J, Antos C, et al. A calcineurin-dependent transcriptional pathway for cardiac hypertrophy. Cell. 1998;93:215–28. doi: 10.1016/s0092-8674(00)81573-1. [DOI] [PMC free article] [PubMed] [Google Scholar]
- 20.Bueno OF, Wilkins BJ, Tymitz KM, et al. Impaired cardiac hypertrophic response in calcineurin Abeta-deficient mice. Proc Natl Acad Sci. 2002;99:4586–91. doi: 10.1073/pnas.072647999. [DOI] [PMC free article] [PubMed] [Google Scholar]
- 21.Gooch JL. An emerging role for cal-cineurin Aalpha in the development and function of the kidney. Am J Physiol Renal Physiol. 2006;290:F769–76. doi: 10.1152/ajprenal.00281.2005. [DOI] [PubMed] [Google Scholar]
- 22.Morancho B, Minguillon J, Molkentin JD, et al. Analysis of the transcriptional activity of endogenous NFAT5 in primary cells using transgenic NFAT-luciferase reporter mice. BMC Mol Biol. 2008;9:13. doi: 10.1186/1471-2199-9-13. [DOI] [PMC free article] [PubMed] [Google Scholar]
- 23.Takeishi Y, Ping P, Bolli R, et al. Transgenic overexpression of constitutively active protein kinase C epsilon causes concentric cardiac hypertrophy. Circ Res. 2000;86:1218–23. doi: 10.1161/01.res.86.12.1218. [DOI] [PubMed] [Google Scholar]
- 24.Lim HW, De Windt LJ, MAnte J, et al. Reversal of cardiac hypertrophy in transgenic disase models by calcineurin inhibition. J Mol Cell Cardio. 2000;32:697–709. doi: 10.1006/jmcc.2000.1113. [DOI] [PubMed] [Google Scholar]
- 25.Goldspink P, McKinney R, Kimball V, et al. Angiotensin induced cardiac hypertrophy in vivo is inhibited by cyclosporin in adult rats. Mol Cell Biochem. 2001;226:83–8. doi: 10.1023/a:1012789819926. [DOI] [PubMed] [Google Scholar]
- 26.DeWindt LJ, Lim HW, Bueno OF, et al. Targeted inhibition of calcineurin attenuates cardiac hypertrophy in vivo. Proc Natl Acad Sci. 2001;98:3322–7. doi: 10.1073/pnas.031371998. [DOI] [PMC free article] [PubMed] [Google Scholar]
- 27.Schiffer M, von Gersdorff G, Bitzer M, et al. Smad proteins and transforming growth factor-beta signaling. Kidney Int Suppl. 2000;77:S45–52. doi: 10.1046/j.1523-1755.2000.07708.x. [DOI] [PubMed] [Google Scholar]
- 28.Sabatini DM. mTOR and cancer: insights into a complex relationship. Nat Rev Cancer. 2006;6:729–34. doi: 10.1038/nrc1974. [DOI] [PubMed] [Google Scholar]
- 29.Wullschleger S, Loewith R, Hall MN. TOR signaling in growth and metabolism. Cell. 2006;124:471–84. doi: 10.1016/j.cell.2006.01.016. [DOI] [PubMed] [Google Scholar]


