

Abstract
MicroRNAs (miRNAs) are a group of small non-coding RNAs with a huge impact in a wide range of biological processes, including cancer. The evidence collected to date demonstrates that miRNAs represent valid diagnostic, prognostic and predictive markers in cancer. The identification of these miRNA biomarkers in archived tissues has been facilitated by novel development and refinement of detection methodologies. Quantitative real-time reverse-transcription PCR (qRT-PCR) is one of the most common methods used to detect low levels of miRNAs with high sensitivity and specificity. However, several technical parameters should be identified and optimized in order to obtain meaningful and reproducible results. The purpose of this review is to describe some of these technical parameters and improve the validity and reliability of miRNA expression studies.
Keywords: microRNAs, quantitative real-time reverse transcription PCR, RNA isolation, cDNA synthesis, reference genes
Introduction
MicroRNAs (miRNAs) are a family of small, highly conserved non-coding RNAs that post-transcriptionally regulate gene expression. MiRNAs are transcribed by RNA polymerase II into long primary transcripts characterized by hairpin structures (pri-miRNAs), which are cleaved in the nucleus by Drosha, releasing a stem loop precursor miRNA (pre-miRNA). This pre-miRNA is transported to the cytoplasm where it is processed by Dicer yielding a double-stranded mature miRNA of approximately 19–22 nucleotides. After denaturation, the active single-stranded miRNA is incorporated into the RNA-induced silencing complex (RISC). The active miRNA-loaded RISC complex binds predominantly to the 3′-UTR of a target mRNA with partial miRNA sequence complementarity where the critical base pairing occurs through the 5′ seed (base pairs 2–8). Subsequently, it will either cleave the mRNA or repress its translation (Fig. 1) [1]. MiRNAs are of great interest because they can regulate approximately 30% of the human genes [2] and have a huge impact in a wide range of basic biological processes. Their regulatory functions also form the hallmarks of cancer, such as cellular differentiation, proliferation, migration and apoptosis. They can act as either oncogenes or tumour suppressor genes depending on the function of their target mRNA [3]. MicroRNAs are important epigenetic modulators because of their unique post-transcription function, and provide more precise data than mRNA expression profiles. To date, every tumour type has shown significantly different miRNA profiles compared with normal cells from the same tissue. However, there are common miRNAs who are differentially expressed in several tumour types, such as miR-21 [4]. miR-21 is one of the first cancer miRNAs described and has been found overexpressed using qRT-PCR analysis in a variety of malignancies: breast cancer [5], colon cancer [6], glioblastoma [7], lung [8] and more. Probably this miRNA participates in fundamental signalling pathways altered in many types of cancer. Several reports highlight miR-21 to be used as a diagnostic and prognostic biomarker for cancer. In addition, beyond the promising role of miRNAs as candidate prognostic and predictive markers, there is also considerable attendance for the use of miRNAs as a novel class of therapeutic targets.
Fig 1.
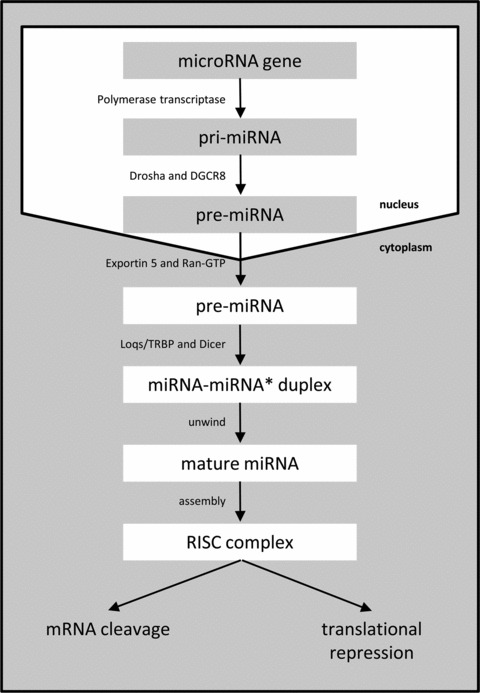
Schematic overview of the biogenesis of miRNAs.
Reliable analyses of miRNA expression are a prerequisite for further research progress. Although the small size and the sequence similarity between miRNAs create challenges for their detection, recent innovative adaptations of technologies have emerged. Four main techniques have been used to quantify miRNAs including cloning, hybridization with selective probes, PCR-based detection and sequencing [9]. Cloning techniques are time-consuming and impractical for large-scale detection. The detection range for hybridization is narrow due to the fact that there is no amplification step incorporated, which limits its use in samples that yield small amounts of RNA. The most recent emerging important tool in detecting and measuring miRNA expression is next generation sequencing. This technique is mainly used as a screening tool because of the high throughput capabilities. In contrast, quantitative real-time reverse-transcription PCR (qRT-PCR) is able to detect low levels of individual miRNAs with high sensitivity and specificity on both the precursor and the mature form and is in turn less constricted by the disadvantages of cloning techniques [10]. In comparison to next generation sequencing qRT-PCR requires less highly specialized equipment and the data analysis is less complex which in turn makes it less time consuming and less costly per sample. For this reason next generation sequencing is commonly used as a screening tool, which is subsequently followed by confirmation of the finding by qRT-PCR.
To perform qRT-PCR that provides meaningful and reproducible results several parameters such as RNA extraction from formalin-fixed paraffin-embedded (FFPE) material, RNA integrity control, cDNA synthesis, amplicon detection and data normalization must be considered. The successful outcome of qRT-PCR analysis with low variability depends upon optimization (and therefore noise reduction) of all these steps. Quantitative real-time reverse transcription PCR can produce variable results even in expert laboratories, suggesting that data are only interpretable when each processing step is carried out optimally. As miRNA analysis is a fast growing research field, a previous review [11] has addressed the technical challenges associated with qRT-PCR analysis. However, our review aims to describe the remaining pitfalls associated with the specific steps in qRT-PCR analysis in more detail. Therefore, the purpose of this review is to describe the technical parameters which are relevant in miRNA expression profiling.
RNA isolation from formalin-fixed paraffin-embedded (FFPE) tissue
The most commonly available archived material used for retrospective molecular biomarker detection is FFPE tissue. Formalin fixation is a standardized method that allows preservation of cellular proteins, easy long-term storage and conservation of tissue architecture in optimal histological conditions. Unfortunately, cross linking of RNA with proteins, enzyme degradation as well as chemical degradation occurring during the fixation process reduces the yield, quality and integrity of RNA [12]. The modification rate of RNA in fixed tissue is high, showing adducts on the bases of all nucleic acids. The formation of methylol derivates, Schiff bases and stable methylene derivates at various sites negatively affects the performance of RNA samples in downstream applications [13].
Previously it has been shown that RNA samples derived from FFPE tissues can serve as effective templates for qRT-PCR [14]. However, despite optimized RNA extraction protocols, absolute mRNA Cq values were approximately five cycles higher in FFPE tissues compared to matched fresh tissues, which indicates that only 3% of the mRNA population from FFPE tissues is accessible to cDNA synthesis and subsequent qRT-PCR analysis [15]. Even though mRNA is not stable in FFPE tissue, miRNA expression profiles do correlate well between fresh and FFPE samples [16-21]. The expression of miRNAs is preserved after routine fixation in formalin (up to 5 days) and long-term storage (10 years) [16]. MicroRNAs are less prone to degradation and modification due to their small size and close association with large protein aggregates [21]. In addition, the different miRNA types are similarly and proportionally degraded because of the uniformity in miRNA structures [14]. However, the detection of low-abundance miRNAs (not specified) might be reduced in FFPE tissue blocks stored for 7 years or longer [17]. Nevertheless, the higher extent of RNA degradation in older tissue blocks probably reduces the qRT-PCR efficiency in miRNA analysis, resulting in a higher technical variability.
There are many different isolation procedures that can be used to extract miRNAs from FFPE tissue. The different techniques rely on the subsequent steps: sample disruption and homogenization (mechanical, enzymatical, physical or chemical), lysis and purification (solution-, membrane-, magnetic bead based or by means of precipitation) [22]. These techniques have been optimized and used extensively for miRNA profiling; however, a straightforward recommendation for the optimal procedure is lacking. By comparing the performance of five commercially available kits, the RecoverAll kit (Applied Biosystems, Foster City) was identified as the preferred isolation procedure for extraction of total RNA from archived fixed tissues [18]. This protocol allows robust and reproducible isolation of high yields of total RNA, including the small miRNAs. It is recommended, in order to avoid small differences in reproducibility, to use one isolation protocol during the entire analysis.
RNA quality control
RNA quality control consists of measuring RNA yield, purity and integrity. Both RNA yield and purity can be measured photometrically. Pure RNA should have an OD260/OD280 ratio higher than 2.0 which is suitable for gene expression experiments [23]. For miRNAs the same criteria can be applied. However, when using a photometrical approach, two restrictions should be made. First, DNA and RNA are detected at the same wavelengths as miRNAs and the technique is therefore non-discriminatory for these nucleic acids. Second, no conclusions about integrity can be based upon these measurements since this technique also does not discriminate for degraded forms of DNA, RNA and miRNA. To the best of our knowledge, there is no substitute technique which can overcome these imperfections. However, if the photometrical approach is used, it is important to be sure that the sample is free of DNA contamination. The most efficient strategy for this is to perform a proper DNase step within the isolation protocol. Thereafter, the absence of DNA could be evaluated performing qRT-PCR analysis of a DNA target on the total RNA [16].
RNA is a thermodynamically stable molecule, which is rapidly digested in the presence of RNase enzymes. In order to evaluate the degree of degradation, electrophoretic methods have been applied that separate the samples according to the size of the RNA fragments. Gel images show the ribosomal RNA species, and RNA is considered of high quality when the ratio of 28S:18S bands is higher than 2.0 [23]. As this showed only a weak correlation with RNA integrity, nowadays automated capillary electrophoresis is used. The amount of measured fluorescence correlates with the amount of RNA of a given size, and the subsequent software algorithm calculates the RNA integrity number (RIN) [24]. The gradual degradation of RNA is reflected by a continuous shift towards shorter fragment size and a lower RIN number. In mammalian RNA samples a minimum RIN number of 5 is suggested for reliable mRNA experiments [25]. However, the robust stability of miRNAs enables their quantification even in degraded samples of renal and prostate biopsies [26]. In the current literature there is no minimal RIN value recommended in qRT-PCR analysis. Nevertheless, for miRNA experiments using other techniques such as microarrays, a minimal RIN number of 3 has been suggested [27]. This finding might be caused by the interference of degraded RNA in the hybridization process, which in turn does not have an effect in qRT-PCR experiments. Therefore, a minimal RIN value is not always indicative in miRNA qRT-PCR measurements. Hence it proves the necessity for a RIN number to be accompanied by information relating to the mRNA and total RNA [28]. A further pitfall of assessing the RIN number is that it only determines the quality of the intact RNA.
In conclusion, currently there is no optimal technique available which is able to determine yield, purity and integrity for miRNAs. Photometrical techniques can be used to determine both yield and purity. However, it should be taken into account that these techniques measure nucleic acid and not solely miRNA concentrations. And even though techniques are available which can give an indication of the integrity of intact miRNA, no information regarding the degree of degradation is obtained. This also raises the question on how pivotal this information is, since there is no consensus on how to interpret these indirect forms of RNA measurements.
cDNA synthesis
Transcription into cDNA is the next step after RNA isolation. Although this process is not well understood, this pivotal step will imperatively influence the end result [29]. Underestimation of the expression or even false negative PCR reactions might be the result of an inefficient reverse transcription (RT) reaction [9]. Stahlberg et al.[30] proved that the RT yield may vary up to 100-fold depending on the choice of reverse transcriptase and that this variation is also sequence dependent.
Discrimination between the detection of the mature miRNA and its precursors is established by primer design. Synthesizing cDNA of mature miRNAs can be either initiated by universal or miRNA-specific RT (Fig. 2). The former is based upon the principle of the addition of a universal tail which is used to initiate elongation [11], while the latter uses miRNA-specific primers. MicroRNA-specific primers in turn can be either linear or contain a stem-loop [31]. Both primers consist of a 3′-end which is complementary to the miRNA. The 5′-end of the stem-loop primer comprises the stem (a double-stranded part) and loop (containing a universal binding primer binding sequence) whereas the 5′-end of the linear primer consists solely of a linear primer binding sequence. Advances of the stem-loop primers are the possible enhancement of the thermal stability of the RNA–DNA heteroduplex, due to base stacking of the stem. Second, stem-loop primers prevent the binding of double-stranded genomic DNA molecules because of spatial constraint [31]. This results in a better RT efficiency and specificity as well as an increased ability to discriminate between mature miRNAs and its precursors [31]. However, when the amount of starting material is rather small and a large number of miRNAs need to be analysed, a universal RT or the use of a multiplex RT by means of pooled stem-loop primers [32] can be beneficial. In addition, pre-amplification [33] should be performed if the total amount of cDNA input in the qRT-PCR is decreased to such a degree that it will affect the accuracy.
Fig 2.
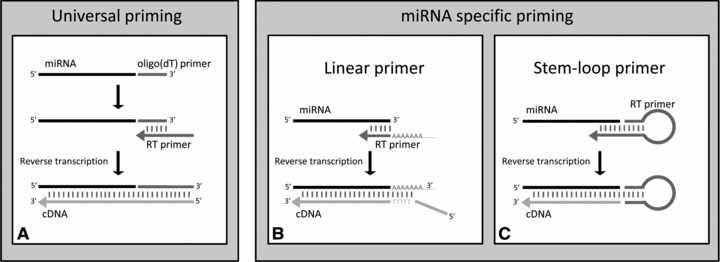
Commercially available methods of priming used in reverse transcription of miRNAs. (A) Universal priming: during the first step the oligo(dT) primer is added to the miRNA sequence. Subsequently a primer, containing a universal PCR primer sequence, anneals to the extended miRNA sequence. Finally, the cDNA is reverse transcribed. (B) MicroRNA-specific priming by means of a linear primer: a specific primer, extended with a poly(A) tail, is annealed which forms the starting point for reverse transcription of the cDNA. (C) MicroRNA-specific priming by means of a stem-loop primer: an initially annealed stem-loop primer is extended during reverse transcription. During qPCR the cDNA is either detected by a primer set, including a universal primer complementary to the 3′-end, (A and B) or by a specific probe (C).
It is essential to carefully evaluate if replicates should be incorporated at this stage. In general, it is preferred to use replicates upstream in the hierarchy of the experiment. However, the sample type is an important determinant of the timing for incorporation of replicates [34]. The qRT-PCR variation is far greater in sampling single cells and liver tissue, compared to cell culture and blood samples. Therefore, it is recommended to use sample replicates preferentially to any other replicates when working with solid tissues. In case of blood samples, it is sufficient to use RT replicates. Introducing RT replicates results in a two-fold increment of accuracy over incorporating replicates after this stage [34]. It is also more cost-effective to introduce replicates at this stage instead of including sample replicates.
Quantitative real-time reverse transcription PCR
Quantitative real-time reverse transcription is a method for determining gene expression levels which relies on the real time detection of the amount of fluorescent reporter molecules. These reporter molecules in turn correlate directly to the number of cDNA molecules present in each cycle of amplification. Even though several fluorescent reporter molecules are used in qRT-PCR (i.e. SYBR Green I, Taqman probes, Molecular Beacons, Light upon extension and Hybprobes), only SYBR Green and Taqman probes are commonly used for performing miRNA analyses. SYBR Green I (SYBR Green) is a fluorescent DNA binding cyanide dye which is able to bind to the minor groove of double-stranded DNA [35]. Importantly, since SYBR Green binds all double-stranded DNA, discrimination for non-specific products such as primer–dimers is not possible [35]. Therefore, it is essential to analyse the dissociation curve to check for the specificity of the reaction [36]. Detection of non-specific products can be eliminated by using Taqman probes instead of SYBR Green. The probes consist of a fluorescent dye on the 5′-end and a quencher on the 3′-end. Due to the ability of the quencher to reduce the fluorescence emitted by the reporter dye no signal is generated. In case the probe anneals to the target sequence, Taq DNA polymerase degrades the probe while the specific PCR product is generated. The quenching effect is relieved resulting in the emission of fluorescence, which is directly proportional to the amount of template in the mixture. In contrast to SYBR Green, a non-specific signal will not be emitted by using a Taqman probe. Nonetheless, non-specific amplification can occur and will consequently have a negative effect on both the efficiency and sensitivity as it will when using SYBR Green.
In the overall variance of the experiment, the qRT-PCR has been shown to be the smallest contributor [34]. Therefore, technical replicates at this stage will not have a huge impact on the standard deviation. The only reason to perform replicates at this stage is the detection of outliers. Furthermore, in an experiment consisting of more than one qRT-PCR run it is also important to realize that inter-plate variability could increase the standard deviation. To prevent this it is necessary to apply a correction, i.e. by including (preferably three) inter-plate calibrators on each plate. By means of these calibrators a correction factor can be calculated and applied to correct for the deviation. Such a correction is not necessary if either all miRNA assays of one sample or all samples for one miRNA assay are run on the same plate.
Reference genes
Currently, the use of endogenous control genes is the most accurate method to correct for RNA input or RT efficiency. The expression of these reference genes should remain as stable as possible in tissues or in response to experimental treatment. Many studies use well-known reference genes without proper validation of their presumed stability of expression in the tissues of interest. However, in recent years, it has also become clear that no single gene is constitutively expressed in all cell types and under all experimental conditions.
Various normalization techniques have been developed in the context of mRNA profiling methods. These approaches can in part be directly applied to miRNA data as well. However, miRNAs regulate multiple targets within the same pathway, implying that small differences in miRNA expression exhibit major biological effects. Therefore, rigorous normalization of miRNA data may be even more critical compared to other classes of RNA molecules. Additionally, multiple studies showed that the inappropriate use of reference genes can significantly alter the results of miRNA quantification [37, 38]. While reference genes for mRNA qRT-PCR studies have been well established, few miRNA qRT-PCR studies have validated reference genes for normalization to date. As a special class of RNA, miRNAs pose a significant challenge for normalization. First, miRNAs are just a very small fraction of the total RNA in a tissue sample, and this small amount can vary significantly across different samples. The normalizer of choice should therefore be capable of determining these small differences in miRNA expression. Second, a normalizer should have the same physiochemical properties as miRNAs, i.e. because the extraction efficiency of small RNAs is different compared to longer RNAs. It is therefore regarded that the best way to normalize is with reference genes belonging to the same RNA class [39]. In a previous study, specific miRNAs (miR-191, miR-103, MiR-17-5p) were identified as the most stable normalizers and statistically superior across several distinct human tissue types [37]. However, miRNA expression is highly tissue specific, and therefore it is unlikely to assume that a single universal reference gene can be applied for all tissue types. We recommend that the suitability of reference genes should be assessed in the tissue of interest before start of the analyses. It is necessary to profile multiple miRNAs in normal and the associated diseased tissue. Subsequent selection of the most stably expressed miRNAs estimates the best non-functional reference genes independent of disease stage [38].
As mentioned before in mRNA quantification experiments, the use of more than one reference gene increases the accuracy of miRNA measurements compared to the use of a single reference gene [40]. For large-scale miRNA expression profiling studies in particular, it is established that mean expression value normalization is the best normalization strategy [41].
Data analysis
Once the qRT-PCR experiment has been performed the data should be pre-processed. As incorrect pre-processing will give an inaccurate representation of the results, several recommendations should be taken into account. The particular steps and the order of the steps are dependent upon the design of the experiment. In this section we will discuss some of the most applied pre-processing steps, although it is important to realize that there are more steps which are not discussed here, but are just as important (Table 1).
Table 1.
Overview of the steps in pre-processing qRT-PCR data
| Step no. | Description |
|---|---|
| 1 | Compensate for variations between runs (inter-plate calibration) |
| 2 | Assay efficiency correction |
| 3 | Normalize with spike (efficiency variation between samples) |
| 4 | Normalize to the same amount of sample |
| 5 | Average qRT-PCR technical repeats |
| 6 | Normalize with reference genes |
| 7 | Outlier detection |
| 8 | Average other technical repeats |
| 9 | Normalize with reference samples (paired test) |
| 10 | Calculate relative quantities |
| 11 | Convert data to log scale |
Data analysis can be performed manually or by using dedicated software. The Cq values of the miRNA of interest and the reference gene are determined after setting the threshold. As mentioned earlier if samples are run in multiple plates it might be essential to correct for run-to-run variation, if not all miRNA assays of one sample or not all samples for one miRNA assay are on the same plate. Run-to-run variation is composed of instrument related variation (PCR block, lamp, filters, etc.), data analysis settings (baseline correction and threshold), reagents (polymerase, fluorophores, etc.) and optical properties of plastics. A correction can be achieved by including inter-plate calibrators. As any variation in the inter-plate calibrators will both obscure real changes and produce artifactual changes in miRNA expression data, these should be stable and validated. Under optimal condition the largest contributors to the run-to-run variation are the data analysis settings. Therefore, these conditions make it possible to restrict the correction to applying a universal baseline and threshold.
If technical qRT-PCR replicates are performed, it is necessary to identify and clear the data of any outliers within the replicate set before data analysis. As a principle, outliers should only be removed if they ensue from (technical) errors. Statistical tests for outlier detection such as the Grubb's test are available. However, the relevance of the outlier should be checked before removing it since the (repeated) application of this test can result in the loss of a substantial amount of real data. Another feasible procedure is to set a threshold that is typical for the inaccuracy of the total qRT-PCR procedure such as 0.5 cycles. Removal of replicates that deviate more than this threshold should be seriously considered. If these so-called outliers cannot be traced back to an error, qualitative agreement between analyses with and without such outliers will support the credibility of the findings.
After pre-processing the data, an appropriate method is needed to analyse and present the data. The two most commonly used methods to analyse data are absolute and relative miRNA quantification [42, 43]. In studies where the experimental objectives only require the determination of relative copy number of a target, relative quantitation is commonly used instead of the standard curve method of analysis (absolute quantification). The 2−(ΔΔCq) method can be used to calculate relative changes in miRNA expression determined from qRT-PCR. This form of analysis utilizes the equation:
where E = efficiency (1 = 100% efficiency) and ΔΔCq = (CqmiRNA of interest– Cqreference gene) sample – (CqmiRNA of interest– Cqreference gene) calibrator.
Using this method, the data are presented as the fold change in miRNA expression normalized to an endogenous reference gene and relative to the calibrator. The calibrator can be any sample to which the other samples can be compared; however, the choice of the calibrator sample is usually dedicated by the type of miRNA expression experiment (i.e. tumour tissue versus normal tissue (calibrator), treated versus untreated sample (calibrator)). The ΔΔCq method relies on two assumptions. First, any change in Cq value for the normalizer has an equivalent effect on the Cq for the miRNA of interest. This implies that the efficiency of both assays needs to be comparable or a correction factor needs to be applied in an earlier stage of the pre-processing. The second assumption is that efficiency of an assay is consistent from one run to the next [43].
Using the ΔΔCq method, it is possible to calculate the RQ value of each sample relative to the calibrator, which has a clinically interpretable value. However, when comparing two groups of samples within an experiment, statistical testing is more powerful on the ΔCq data than on the RQ data, since usually the ΔCq data are approximately normally distributed, while the RQ data are skewed. As a result, t-tests can applied to the ΔCq data which are more powerful than the Wilcoxon–Mann–Whitney tests on the RQ data. In addition, differences between the groups can be adjusted for covariates only on ΔCq scale, since multivariate methods assume normal (Gaussian) distribution.
Conclusions
Oscar Wilde once stated “No object is so beautiful that, under certain conditions, it will not look ugly.” The same holds true for qRT-PCR: even though the technique itself can provide meaningful and reproducible results, if every step is not carefully evaluated and optimized, it might result in the exact opposite. When designing qRT-PCR experiments for the analysis of miRNA expression in FFPE tissue, several steps should be taken into account. Some of these steps are generally applicable to all qRT-PCR experiments and others are specific for miRNA quantification.
For the isolation of miRNAs from FFPE material, several dedicated isolation procedures are available. Problems arise when the yield, purity and integrity of the isolated miRNA need to be determined. Currently, there is no single technique available that is able to determine all three parameters since techniques are non-discriminatory for miRNAs and other nucleic acids (i.e. determining yield by photometrical techniques). A pivotal step in the whole qRT-PCR procedure is the RT, since underestimation or even false negative PCR reactions are the result of an inefficient RT reaction. Therefore, it is essential to consider implementing replicates at this stage. Even though it is generally preferred to use replicates upstream in the hierarchy of the experiment, the decision relies also on cost management. Proper normalization is another critical aspect of miRNA qRT-PCR, and the suitability of reference genes should be assessed in the target tissue before start of the experiment. After pre-processing, the data should be represented using the right statistical methods.
This review intended to describe some of the essential technical parameters in miRNA qRT-PCR. Our information about the optimization of miRNA qRT-PCR experiments is coherent with the minimum information for publication of quantitative real-time PCR experiments (MIQE) [44]. This guideline constitutes a framework that promotes and improves the meaningfulness, reliability and reproducibility of qRT-PCR data.
Acknowledgments
We thank Joris Verheyde for revising the manuscript critically.
Author contributions
J.R.D. and L.J.M.M. wrote the manuscript and were responsible for table and figure generation. I.d.K., S.T. and I.D.N. revised the manuscript critically. S.T. focussed mainly on the statistical part of the review. All authors had final approval of the submitted manuscript.
Conflicts of interest
The authors confirm that there are no conflicts of interest.
References
- 1.Bartel DP. MicroRNAs: genomics, biogenesis, mechanism, and function. Cell. 2004;116:281–97. doi: 10.1016/s0092-8674(04)00045-5. [DOI] [PubMed] [Google Scholar]
- 2.Lewis BP, Burge CB, Bartel DP. Conserved seed pairing, often flanked by adenosines, indicates that thousands of human genes are microRNA targets. Cell. 2005;120:15–20. doi: 10.1016/j.cell.2004.12.035. [DOI] [PubMed] [Google Scholar]
- 3.Farazi TA, Spitzer JI, Morozov P, et al. miRNAs in human cancer. J Pathol. 2011;223:102–15. doi: 10.1002/path.2806. [DOI] [PMC free article] [PubMed] [Google Scholar]
- 4.Volinia S, Calin GA, Liu CG, et al. A microRNA expression signature of human solid tumours defines cancer gene targets. Proc Natl Acad Sci U S A. 2006;103:2257–61. doi: 10.1073/pnas.0510565103. [DOI] [PMC free article] [PubMed] [Google Scholar]
- 5.Yan LX, Huang XF, Shao Q, et al. MicroRNA miR-21 overexpression in human breast cancer is associated with advanced clinical stage, lymph node metastasis and patient poor prognosis. RNA. 2008;14:2348–60. doi: 10.1261/rna.1034808. [DOI] [PMC free article] [PubMed] [Google Scholar]
- 6.Schetter AJ, Leung SY, Sohn JJ, et al. MicroRNA expression profiles associated with prognosis and therapeutic outcome in colon adenocarcinoma. JAMA. 2008;299:425–36. doi: 10.1001/jama.299.4.425. [DOI] [PMC free article] [PubMed] [Google Scholar]
- 7.Chan JA, Krichevsky AM, Kosik KS. MicroRNA-21 is an antiapoptotic factor in human glioblastoma cells. Cancer Res. 2005;65:6029–33. doi: 10.1158/0008-5472.CAN-05-0137. [DOI] [PubMed] [Google Scholar]
- 8.Markou A, Tsaroucha EG, Kaklamanis L, et al. Prognostic value of mature microRNA-21 and microRNA-205 overexpression in non-small cell lung cancer by quantitative real-time RT-PCR. Clin Chem. 2008;54:1696–704. doi: 10.1373/clinchem.2007.101741. [DOI] [PubMed] [Google Scholar]
- 9.Koshiol J, Wang E, Zhao Y, et al. Strengths and limitations of laboratory procedures for microRNA detection. Cancer Epidemiol Biomarkers Prev. 2010;19:907–11. doi: 10.1158/1055-9965.EPI-10-0071. [DOI] [PMC free article] [PubMed] [Google Scholar]
- 10.Derveaux S, Vandesompele J, Hellemans J. How to do successful gene expression analysis using real-time PCR. Methods. 2010;50:227–30. doi: 10.1016/j.ymeth.2009.11.001. [DOI] [PubMed] [Google Scholar]
- 11.Benes V, Castoldi M. Expression profiling of microRNA using real-time quantitative PCR, how to use it and what is available. Methods. 2010;50:244–9. doi: 10.1016/j.ymeth.2010.01.026. [DOI] [PubMed] [Google Scholar]
- 12.Lewis F, Maughan NJ, Smith V, et al. Unlocking the archive-gene expression in paraffin-embedded tissue. J Pathol. 2001;195:66–71. doi: 10.1002/1096-9896(200109)195:1<66::AID-PATH921>3.0.CO;2-F. [DOI] [PubMed] [Google Scholar]
- 13.Masuda N, Ohnishi T, Kawamoto S, et al. Analysis of chemical modification of RNA from formalin-fixed samples and optimization of molecular biology applications for such samples. Nucleic Acids Res. 1999;27:4436–43. doi: 10.1093/nar/27.22.4436. [DOI] [PMC free article] [PubMed] [Google Scholar]
- 14.Klopfleisch R, Weiss AT, Gruber AD. Excavation of a buried treasure-DNA, mRNA, miRNA and protein analysis in formalin fixed, paraffin embedded tissues. Histol Histopathol. 2011;26:797–810. doi: 10.14670/HH-26.797. [DOI] [PubMed] [Google Scholar]
- 15.Godfrey TE, Kim SH, Chavira M, et al. Quantitative mRNA expression analysis from formalin-fixed, paraffin-embedded tissues using 5′ nuclease quantitative reverse transcription-polymerase chain reaction. J Mol Diagn. 2000;2:84–91. doi: 10.1016/S1525-1578(10)60621-6. [DOI] [PMC free article] [PubMed] [Google Scholar]
- 16.Xi Y, Nakajima G, Gavin E, et al. Systematic analysis of microRNA expression of RNA extracted from fresh frozen and formalin-fixed paraffin-embedded samples. RNA. 2007;13:1668–74. doi: 10.1261/rna.642907. [DOI] [PMC free article] [PubMed] [Google Scholar]
- 17.Szafranska AE, Davison TS, Shingara J, et al. Accurate molecular characterization of formalin-fixed, paraffin-embedded tissues by microRNA expression profiling. J Mol Diagn. 2008;10:415–23. doi: 10.2353/jmoldx.2008.080018. [DOI] [PMC free article] [PubMed] [Google Scholar]
- 18.Doleshal M, Magotra AA, Choudhury B, et al. Evaluation and validation of total RNA extraction methods for microRNA expression analyses in formalin-fixed, paraffin-embedded tissues. J Mol Diagn. 2008;10:203–11. doi: 10.2353/jmoldx.2008.070153. [DOI] [PMC free article] [PubMed] [Google Scholar]
- 19.Li J, Smyth P, Flavin R, et al. Comparison of miRNA expression patterns using total RNA extracted from matched samples of formalin-fixed paraffin-embedded (FFPE) cells and snap frozen cells. BMC Biotechnol. 2007;7:36. doi: 10.1186/1472-6750-7-36. [DOI] [PMC free article] [PubMed] [Google Scholar]
- 20.Glud M, Klausen M, Gniadecki R, et al. MicroRNA expression in melanocytic nevi: the usefulness of formalin-fixed, paraffin-embedded material for miRNA microarray profiling. J Invest Dermatol. 2009;129:1219–24. doi: 10.1038/jid.2008.347. [DOI] [PubMed] [Google Scholar]
- 21.Liu A, Tetzlaff MT, Vanbelle P, et al. MicroRNA expression profiling outperforms mRNA expression profiling in formalin-fixed paraffin-embedded tissues. Int J Clin Exp Pathol. 2009;2:519–27. [PMC free article] [PubMed] [Google Scholar]
- 22.Nelson PT, Wang WX, Wilfred BR, et al. Technical variables in high-throughput miRNA expression profiling: much work remains to be done. Biochim Biophys Acta. 2008;1779:758–65. doi: 10.1016/j.bbagrm.2008.03.012. [DOI] [PMC free article] [PubMed] [Google Scholar]
- 23.Sambrook J, Fritsch EF, Maniatis T. Molecular cloning: a laboratory manual. 2. New York: Cold Spring Harbor Laboratory Press; 1989. [Google Scholar]
- 24.Schroeder A, Mueller O, Stocker S, et al. The RIN: an RNA integrity number for assigning integrity values to RNA measurements. BMC Mol Biol. 2006;7:3. doi: 10.1186/1471-2199-7-3. [DOI] [PMC free article] [PubMed] [Google Scholar]
- 25.Fleige S, Walf V, Huch S, et al. Comparison of relative mRNA quantification models and the impact of RNA integrity in quantitative real-time RT-PCR. Biotechnol Lett. 2006;28:1601–13. doi: 10.1007/s10529-006-9127-2. [DOI] [PubMed] [Google Scholar]
- 26.Jung M, Schaefer A, Steiner I, et al. Robust microRNA stability in degraded RNA preparations from human tissue and cell samples. Clin Chem. 2010;56:998–1006. doi: 10.1373/clinchem.2009.141580. [DOI] [PubMed] [Google Scholar]
- 27.Yu SL, Chen HY, Yang PC, et al. Unique MicroRNA signature and clinical outcome of cancers. DNA Cell Biol. 2007;26:283–92. doi: 10.1089/dna.2006.0555. [DOI] [PubMed] [Google Scholar]
- 28.Becker C, Hammerle-Fickinger A, Riedmaier I, et al. mRNA and microRNA quality control for RT-qPCR analysis. Methods. 2010;50:237–43. doi: 10.1016/j.ymeth.2010.01.010. [DOI] [PubMed] [Google Scholar]
- 29.Stahlberg A, Hakansson J, Xian X, et al. Properties of the reverse transcription reaction in mRNA quantification. Clin Chem. 2004;50:509–15. doi: 10.1373/clinchem.2003.026161. [DOI] [PubMed] [Google Scholar]
- 30.Stahlberg A, Kubista M, Pfaffl M. Comparison of reverse transcriptases in gene expression analysis. Clin Chem. 2004;50:1678–80. doi: 10.1373/clinchem.2004.035469. [DOI] [PubMed] [Google Scholar]
- 31.Chen C, Ridzon DA, Broomer AJ, et al. Real-time quantification of microRNAs by stem-loop RT-PCR. Nucleic Acids Res. 2005;33:e179. doi: 10.1093/nar/gni178. [DOI] [PMC free article] [PubMed] [Google Scholar]
- 32.Lao K, Xu NL, Yeung V, et al. Multiplexing RT-PCR for the detection of multiple miRNA species in small samples. Biochem Biophys Res Commun. 2006;343:85–9. doi: 10.1016/j.bbrc.2006.02.106. [DOI] [PubMed] [Google Scholar]
- 33.Mestdagh P, Feys T, Bernard N, et al. High-throughput stem-loop RT-qPCR miRNA expression profiling using minute amounts of input RNA. Nucleic Acids Res. 2008;36:e143. doi: 10.1093/nar/gkn725. [DOI] [PMC free article] [PubMed] [Google Scholar]
- 34.Tichopad A, Kitchen R, Riedmaier I, et al. Design and optimization of reverse-transcription quantitative PCR experiments. Clin Chem. 2009;55:1816–23. doi: 10.1373/clinchem.2009.126201. [DOI] [PubMed] [Google Scholar]
- 35.Zipper H, Brunner H, Bernhagen J, et al. Investigations on DNA intercalation and surface binding by SYBR Green I, its structure determination and methodological implications. Nucleic Acids Res. 2004;32:e103. doi: 10.1093/nar/gnh101. [DOI] [PMC free article] [PubMed] [Google Scholar]
- 36.Whitman DF, Dunbar SA. Real-time polymerase chain reaction detection methods. Recent Pat DNA Gene Seq. 2008;2:20–6. doi: 10.2174/187221508783406558. [DOI] [PubMed] [Google Scholar]
- 37.Peltier HJ, Latham GJ. Normalization of microRNA expression levels in quantitative RT-PCR assays: identification of suitable reference RNA targets in normal and cancerous human solid tissues. RNA. 2008;14:844–52. doi: 10.1261/rna.939908. [DOI] [PMC free article] [PubMed] [Google Scholar]
- 38.Chang KH, Mestdagh P, Vandesompele J, et al. MicroRNA expression profiling to identify and validate reference genes for relative quantification in colorectal cancer. BMC Cancer. 2010;10:173. doi: 10.1186/1471-2407-10-173. [DOI] [PMC free article] [PubMed] [Google Scholar]
- 39.Vandesompele J, De Preter K, Pattyn F, et al. Accurate normalization of real-time quantitative RT-PCR data by geometric averaging of multiple internal control genes. Genome Biol. 2002;3 doi: 10.1186/gb-2002-3-7-research0034. : RESEARCH0034. [DOI] [PMC free article] [PubMed] [Google Scholar]
- 40.Meyer SU, Pfaffl MW, Ulbrich SE. Normalization strategies for microRNA profiling experiments: a ‘normal’ way to a hidden layer of complexity? Biotechnol Lett. 2010;32:1777–88. doi: 10.1007/s10529-010-0380-z. [DOI] [PubMed] [Google Scholar]
- 41.Mestdagh P, Van Vlierberghe P, De Weer A, et al. A novel and universal method for microRNA RT-qPCR data normalization. Genome Biol. 2009;10:R64. doi: 10.1186/gb-2009-10-6-r64. [DOI] [PMC free article] [PubMed] [Google Scholar]
- 42.Bissels U, Wild S, Tomiuk S, et al. Absolute quantification of microRNAs by using a universal reference. RNA. 2009;15:2375–84. doi: 10.1261/rna.1754109. [DOI] [PMC free article] [PubMed] [Google Scholar]
- 43.Schmittgen TD, Livak KJ. Analyzing real-time PCR data by the comparative C(T) method. Nat Protoc. 2008;3:1101–8. doi: 10.1038/nprot.2008.73. [DOI] [PubMed] [Google Scholar]
- 44.Bustin SA, Benes V, Garson JA, et al. The MIQE guidelines: minimum information for publication of quantitative real-time PCR experiments. Clin Chem. 2009;55:611–22. doi: 10.1373/clinchem.2008.112797. [DOI] [PubMed] [Google Scholar]