Abstract
Tendons are composed of longitudinally aligned collagen fibrils arranged in bundles with an undulating pattern, called crimp. The crimp structure is established during embryonic development and plays a vital role in the mechanical behaviour of tendon, acting as a shock absorber during loading. However, the mechanism of crimp formation is unknown, partly because of the difficulties of studying tendon development in vivo. Here we used a 3D cell culture system in which embryonic tendon fibroblasts synthesize a tendon-like construct comprised of collagen fibrils arranged in parallel bundles. Investigations using polarized light microscopy, scanning electron microscopy and fluorescence microscopy showed that tendon-constructs contained a regular pattern of wavy collagen fibrils. Tensile testing indicated that this superstructure was a form of embryonic crimp producing a characteristic toe region in the stress-strain curves. Furthermore, contraction of tendon fibroblasts was the critical factor in the buckling of collagen fibrils during the formation of the crimp structure. Using these biological data, a finite element model was built that mimics the contraction of the tendon fibroblasts and monitors the response of the ECM. The results show that the contraction of the fibroblasts is a sufficient mechanical impulse to build a planar wavy pattern. Furthermore, the value of crimp wavelength was determined by the mechanical properties of the collagen fibrils and inter-fibrillar matrix. Increasing fibril stiffness combined with constant matrix stiffness led to an increase in crimp wavelength. The data suggest a novel mechanism of crimp formation, and the finite element model indicates the minimum requirements to generate a crimp structure in embryonic tendon.
Keywords: Finite Element Modeling, Chick Embryonic Tendon, Crimp, Collagen, Tension, Extracellular Matrix
Introduction
Tendon tissue is comprised of an extracellular matrix (ECM) that is abundant in collagen fibrils arranged in bundles that are parallel to the tendon long axis. In relaxed tendons, the bundles are buckled into an undulating pattern, called crimp. Unbuckling of the crimped collagen bundles during longitudinal loading acts as a natural shock-absorber on initial loading as well as being important in elastic recoil (Diamant et al. 1972; Hansen et al. 2002; Sasaki and Odajima 1996; Franchi et al. 2007a) (reviewed by (Benjamin et al. 2008) and (Ker 2002)). The existence of the crimp explains the ‘toe’ region of the tendon stress-strain curve in which the tendon extends in length upon low levels of load. Once the crimp has been removed the stress-strain curve is linear, to a close approximation, until the tendon tissue fails. Crimp first appears during embryonic tendon development (e.g. embryonic day 14 in the chick) (Shah et al. 1982) when the tissue is rapidly increasing in length and collagen content. However, the mechanism of crimp formation remains unknown, largely because of the impracticalities of studying its formation in vivo. In a previous study we showed that embryonic tendon cells synthesize a tendon-like construct when cultured in fixed-length fibrin gels (Kapacee et al. 2008). Furthermore, the constructs have similar mechanical properties to chick embryonic tendon (Kalson et al. 2010). During earlier investigations it was noted that tendon constructs displayed a crimp structure when examined by plane polarised light microscopy (PPLM). The motivation for our present study was to study the mechanism of crimp formation in the tendon-like construct and to model this process using finite element modelling (FEM).
FEM is a powerful tool to investigate the mechanical behaviour of biological composite materials, such as tendons. Previous studies to use FEM to explain the biological properties of tendon considered ‘fibers only’ (Freed and Doehring 2005), ‘fibers and matrix’ (Reese et al. 2010; Chan et al. 2008), and ‘cells, fibers and matrix’ (Lavagnino et al. 2008). FEM has been used to model the mechanical response of tendon as a helical spring (Freed and Doehring 2005) or as a single fiber embedded in a block of inter-fibrillar matrix with longitudinal loading (Chan et al. 2008). These findings show that the Young’s modulus increases with increasing fibril volume/matrix ratio and fibril diameter/crimp wavelength ratio. Lavagnino and co-workers included fibers, matrix and cells into their model, and used the approach of Freed and co-workers to model the crimp structure as a spring. Reese and co-workers modelled tendon to explain the high Poisson’s ratios that occur in tendons. Their results suggest that a wavy pattern combined with a helical arrangement – a so-called super-helical arrangement – provides the best pattern to achieve the tendon mechanical response to longitudinal loading. These studies provide novel insights into the mechanical response of tendon to longitudinal loading but information on how the crimp is formed is lacking.
In this study we demonstrate that crimp is initially generated by cellular contractile-forces. A finite element model was then developed with fibroblasts, collagen fibrils and inter-fibrillar matrix represented as simple geometries, to show how cellular contractile forces are able to produce an organised crimp pattern in the tissue.
1 Experimental Methods
1.1 Cell isolation and tendon-construct formation
Tendon-like constructs were assembled as previously described (Kapacee et al. 2008). Briefly, day 14 embryonic chick metatarsal tendon (ECMT) cells were propagated (not exceeding passage 7) in monolayer in ‘complete medium’ (DMEM4 culture medium (Sigma) supplemented with penicillin (100 U/mL), streptomycin (100 μg/mL; Lonza), L-glutamine (2 mM; Lonza), and fetal calf serum (10%; Sigma)) until sufficient numbers of cells were available to form constructs. Cells were removed from tissue culture flasks using trypsin-EDTA (Lonza). Each well of a six well plate was lined with 2 ml of Sylgard (type 184 silicone elastomer, Dow Chemical, Midland, MI, USA) and incubated at 55 °C for 15 hours. Two 0.1 mm minutien pins (Austerlitz, Czech Republic) were each put through one 0.25 cm length of suture (Ethicon) and inserted with a 1 cm gap in the Sylgard. Plates were sterilised by immersion for one hour in 100% ethanol under UV light. Cells (6.15 × 10⁵) were suspended in 400 μl of complete medium plus 83 μl of 20 mg/ml fibrinogen and 10 μl of 200 U/ml thrombin (both bovine; Sigma, St Louis, MO, USA), deposited in each well and incubated at 37°C in humidified air containing 5% CO2. After five minutes setting time, cell-matrix layers were ‘scored’ with a fine pipette tip to prevent adhesion to the side of the well, then incubated with 5 ml complete medium (as above) supplemented with L-ascorbic acid 2-phosphate (200 μM; Lonza). The gel was scored every two days until, at approximately seven days post seeding, it had contracted to form a linear construct between the pinned sutures. The time point of ‘contraction’ was defined as T0.
1.2 Cell inactivation with Triton X-100
Ten constructs per group were used. Triton solution was prepared from 0.5% Triton-X-100 solution (Sigma) in 40 ml PBS with 2 protease inhibitor tablets (Sigma). Constructs were washed with PBS twice, incubated with Triton solution for 20 minutes (2 ml per construct), washed with PBS, and incubated with fresh Triton solution for 20 minutes. Constructs were washed with PBS, and incubated in complete medium as above at 37 °C and 5% CO2. In control samples, constructs were treated similarly but without the addition of Triton to the PBS.
1.3 Crimp identification using polarized light microscopy (PLM)
Tendon-constructs treated with Triton or PBS (10 constructs in each group) were imaged with a dissecting microscope equipped with polarizing filters. Constructs were then released from their anchor pins to allow contraction to occur. Thirty minutes after release from the pins constructs were imaged again. ECMT extracted from day 14 embryos were placed in pre-warmed PBS (37°C) and immediately taken for examination by PPLM. Crimp wavelength was determined from PPLM images by calculating the distance separating two consecutive light (or dark) bands as described previously (Diamant et al. 1972). Twenty measurements were made on consecutive crimps in each sample.
1.4 Crimp identification using SEM
Preparation for SEM was performed as previously described (Nation 1983; Araujo et al. 2003). Briefly, tendon-constructs and ECMT were fixed for 5 minutes in 1% glutaraldehyde in 0.1M cacodylate buffer before being dehydrated in graded ethanol solutions. Tissues were immersed in hexamethyldisilazane (Sigma) for 5 minutes, air-dried at room temperature and mounted on aluminium stubs with double sticky tabs. Tissues were immediately coated using an EM Scope SC 500 sputter coater (EM Scope) with 20 nm gold and taken for examination using an FEI Quanta 200 ESEM. Imaging was performed in high vacuum at 15kV.
1.5 Cell staining and fluorescence microscopy
Cell shape was investigated by light microscopy. Pinned tendon-constructs were incubated with Calcein-AM (10 μM for 2 hours; Sigma). Images were collected on a Leica TCS SP2 AOBS inverted confocal microscope using a 20x HCX PL Fluotar objective. Constructs were allowed to contract (after removal of the anchor pins) and imaged again. The confocal settings were pinhole 1 airy unit, scan speed 1000 Hz unidirectional, format 1024 × 1024. Images were collected using the following detection mirror settings; excitation 496 nm (20%), emission 500-540 nm. Fluorescence microscopy results were analyzed using the ImageJ software package (National Institute of Health; Bethesda, USA, http://rsbweb.nih.gov/ij/).
2 Finite Element Modelling
2.1 Model geometry
A number of simplifying assumptions were made about the tendon to create a finite element model of sufficient complexity that it could test the hypothesis that cellular contraction generates the crimp structure. These assumptions were:
Three structures in the tendon play a role in the formation of the crimp and must be represented: cells, collagen fibril bundles and inter-fibrillar matrix.
The longitudinal fibril bundles are the most significant type of fibril bundle in terms of the mechanical response being investigated. Therefore perpendicular cross-links were not included in the finite element models.
The fibril bundles were connected directly to the inter-fibrillar matrix. The fibril bundles and inter-fibrillar matrix were not permitted to slide past one another.
The crimp is a planar structure and can therefore be represented by using a two dimensional model.
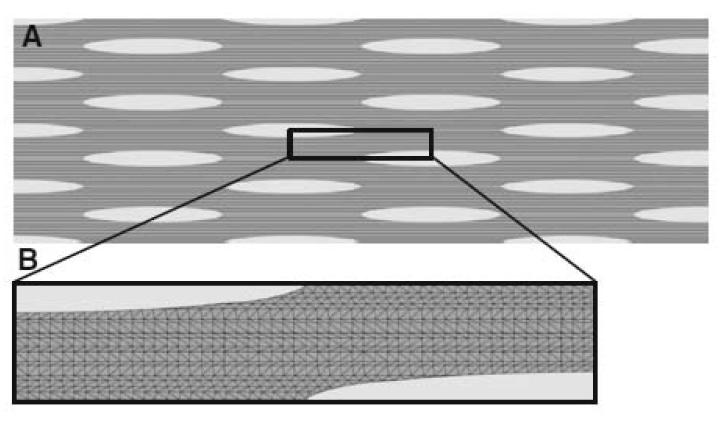
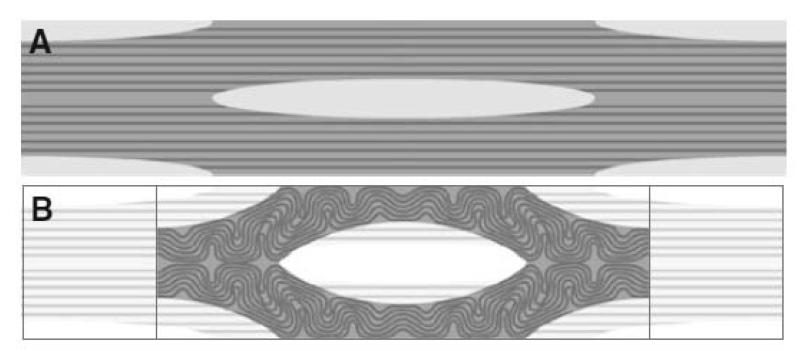
Fig. 1A shows a two dimensional slice through tendon tissue with a number of cells arranged schematically in a regular pattern. The geometry of the tissue was defined using morphometric data obtained by light and electron microscopy (see Figs. 4-6). The cells (light grey) were simplified as an elliptical shape with dimensions of 50 × 5 μm. The fibril bundles (dark grey) were represented by rods with a diameter of 4 μm. The rods occupied approximately one third of the ECM (medium grey).
Figure 1.
Finite element model. A. A two-dimensional model of a tendon including fibroblasts (grey ellipses), collagen fibrils (black rods) and inter-fibrillar matrix (dark grey matter). B. The reduced “unit cell” model, using planes of symmetry
Figure 4.
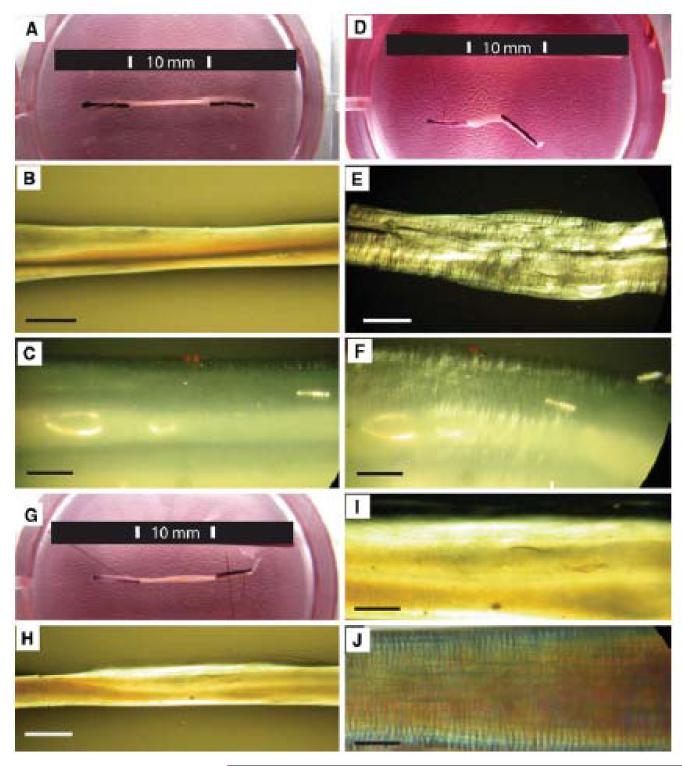
Tendon constructs contract and develop crimp when released from pinned anchors. The process is dependent on viable cells.
A. Tendon-construct (10 mm in length) anchored in a culture dish by pinned sutures.
B, C. Pinned construct viewed with PPLM.
D. The same construct 30 minutes after release has contracted to 3 mm length.
E, F. PPLM of the contracted construct demonstrates crimp with mean wavelength of 10.4 ± 2.8 μm.
G. Tendon construct treated with Triton solution and viewed 30 minutes after being released from the anchoring pins. The construct did not contract.
H, I. The same construct did not show a crimp structure when viewed by PPLM.
J. Day 14 ECMT has a crimp structure (mean crimp length = 11.5 ± 2.5 μm) when viewed by PPLM.
Scale bar 1 mm (B, E, H), 100 μm (C, F, I, J).
Figure 5.
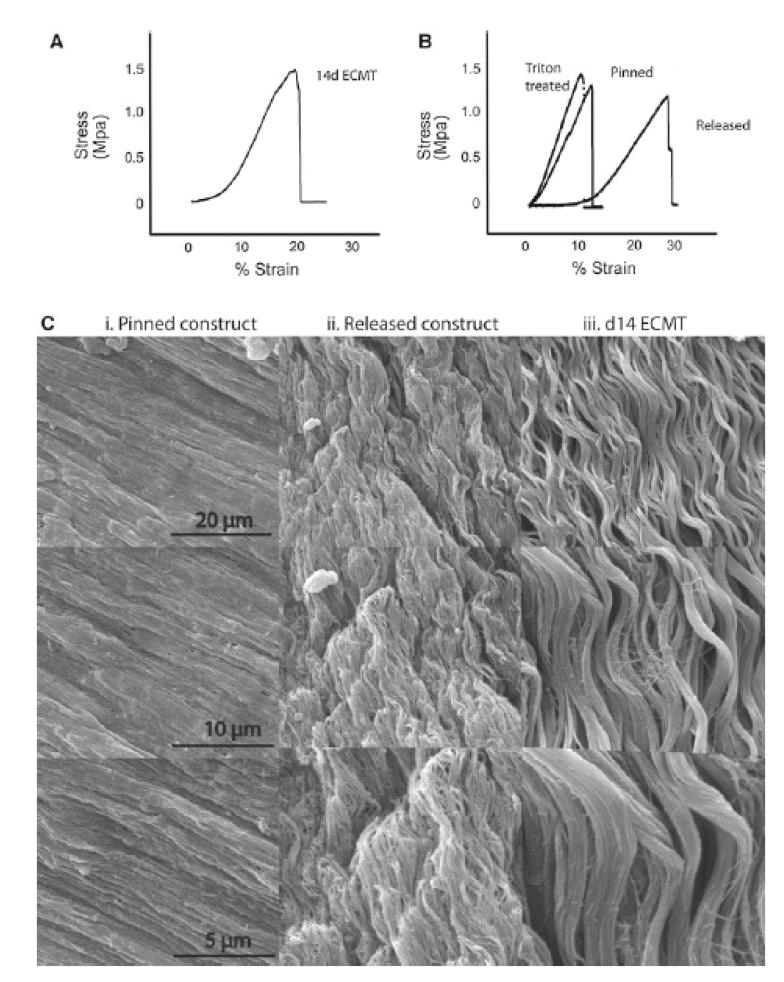
SEM and mechanical testing demonstrates embryonic crimp in ECMT and contracted tendon-constructs.
A. Stress-strain curve of 14d ECMT shows toe-region corresponding to straightening of crimped collagen fibril bundles.
B. Stress-strain curves of the tendon-construct demonstrate a toe-region characteristic of embryonic crimp in the released constructs but not in the pinned construct or in constructs treated with Triton X-100 before release.
C. SEM of the pinned construct (i) demonstrated straight parallel bundles of collagen fibrils. After contraction these fibril bundles show a wavy crimp structure (ii), comparable with that seen in day 14 ECMT (iii).
Figure 6.
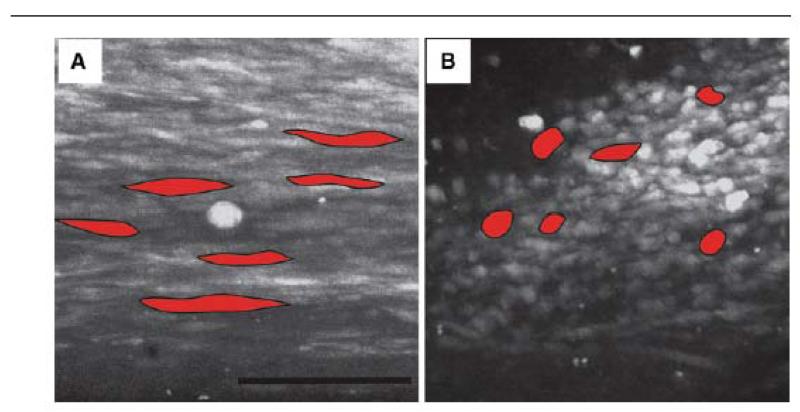
Confocal light microscope images of cells in the tendon construct in pinned (A) and contracted (B) state. Cells under tension are longitudinal with an average length of 50 μm and width of 4 μm. After contraction the cells are more spherical with an average length of 20 μm and width of 8 μm. Five cells in each image are outlined and coloured (red) to illustrate the shape of the cells. Scale bar 100 μm
Assuming that the tendon tissue is a regular structure, symmetry can be employed to reduce the model down to a unit “computational cell”. Immunofluorescence studies of tendon have shown that cells are aligned in rows separated by bundles of collagen fibrils (for example see (McNeilly et al. 1996)). Therefore the schematic shown in Fig. 1A is, to a close approximation, representative of the arrangement of cells in tendon. The unit cell approach is a technique used for modelling composites (Farooqi and Sheikh 2006) and is suitable for studying the composite structure of tendon. Fig. 1B shows the unit cell used. It comprises two quarters of two separate fibroblasts separated by a region containing fibril bundles and inter-fibrillar matrix. The geometry was converted into a finite element mesh comprising 6-noded modified quadratic plain stress triangles (Abaqus code CPS6M) using the commercial finite element package Abaqus (version 6.9-2; Simulia, Providence, RI, USA). As the contraction of the two fibroblasts could be simulated by moving the fibroblast cell walls, the actual fibroblasts did not need to be meshed.
2.2 Constitutive Model
Here, the fibril bundles and inter-fibrillar matrix are assumed to behave like Neo-Hookean solids. The Neo-Hookean constitutive model is a special class of hyperelasticity. Hyperelastic models describe the stress-strain response for a perfectly elastic material over large deformations (typically strains greater than 10%). In Neo-Hookean solids, the relationship between stress and strain starts off as linear and then curves, reaching a plateau. Using a hyperelastic constitutive model is a common way to model large deformations in biological tissues (Reese et al. 2010).
2.3 Values for the Mechanical Properties
The constitutive model requires input values for Young’s modulus and Poisson’s ratio for both the inter-fibrillar matrix and the fibril bundles. For the finite element analyses presented in this paper, the authors sought values from the literature. Unfortunately, published values are not in good agreement, as indicated below. A value of 0.1 MPa has been reported for the Young’s modulus of the inter-fibrillar matrix (Leahy and Hukins 2001) whereas other workers have reported a value of 0.25 MPa (Ault and Hoffman 1992). The Poisson’s ratio of the inter-fibrillar matrix was stated to be 0.49 (Goh et al. 2004). Bendjaballah and co-workers modelled the human knee and used a modulus of 8 MPa for the matrix combined with a Poisson’s ratio of 0.45 (Bendjaballah et al. 1995). The Young’s modulus for the fibers was given a value of 60 MPa, which seems to be low compared to 5 GPa proposed by others (Chan et al. 2008). Furthermore, a mean value for the Young’s modulus of 2 GPa has been calculated based on several studies (Redaelli et al. 2003). Van der Rijt and co-workers measured the mechanical properties of individual bovine Achilles tendon collagen fibrils using atomic force microscopy (van der Rijt et al. 2006). Their measurements provided a range of values for the Young’s modulus of the fibrils from 200 MPa to 500 MPa. Other workers adapted this method and investigated the mechanical properties of adult human patellar tendon collagen fibrils (Svensson et al. 2010a; Svensson et al. 2010b). Their findings show that dried fibrils with a diameter of ~122 nm have a Young’s modulus of 89 MPa and hydrated fibrils reach up to 500 MPa. Wenger et al. used atomic force microscopy combined with nanoindentation to determine the value for Young’s modulus in the range 5-11.5 GPa for collagen fibrils derived from a rat-tail tendon (Wenger et al. 2007).
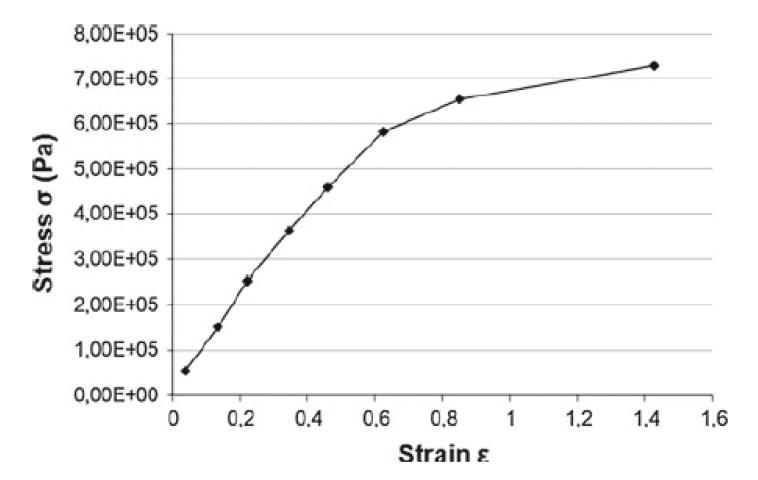
As there is a wide range of reported values in the literature, we decided to use the curve provided in the Abaqus manual to define the Young’s modulus of the inter-fibrillar matrix (see Fig. 2) as these data lie within the range of the figures found in the literature. The value of Young’s modulus for the fibril bundles was derived from the inter-fibrillar matrix data by multiplying by a factor that made the fibrils between 10x and 750x stiffer than the inter-fibrillar matrix. The larger difference (750x) reflects the observation that the Young’s modulus of the fibrils is generally reported as being two to three orders of magnitude higher than the inter-fibrillar matrix (see the citations listed earlier). The Poisson’s ratio for the ECM was given a value of 0.49, which makes it incompressible like a fluid. The Poisson’s ratio for the fibril bundles was 0.4.
Figure 2.
Mechanical test data of a typical neo-Hookean solid. This was used to define the mechanical properties of the inter-fibrillar matrix. To define the mechanical properties of the fibrils, this set of test data was multiplied by a factor.
2.4 Finite Element Analyses
The finite element analyses carried out here concern geometrically nonlinear behaviour where the materials experience rotations, translations and local deformation. In this type of analysis, the initial and final boundary conditions can be defined. The solution process in the finite element software then proceeds towards the final state in a sequence of approximately linear steps. Generally, the internal configuration of the structure being analyzed is the desired solution and here, the purpose is to determine if a crimp structure forms.
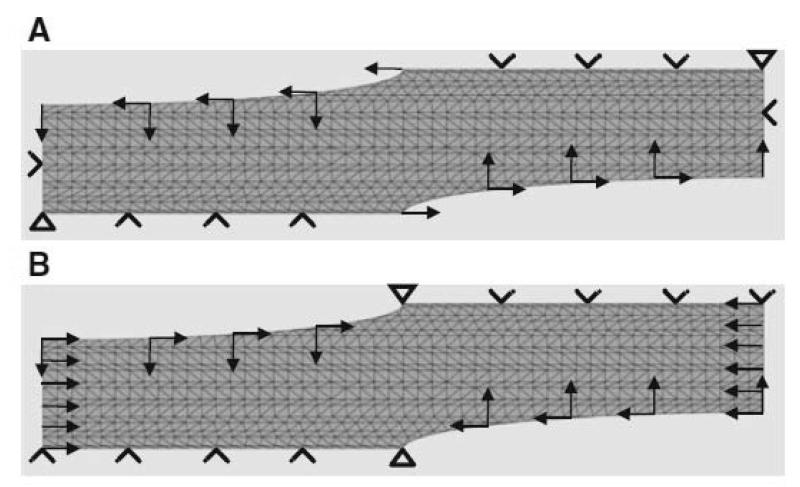
A pilot analysis was carried out to test the basic principles. The sides of the unit cell were not permitted to move. The top and bottom of the model were permitted to move horizontally to preserve the planes of symmetry implied by the unit cell approach. A displacement boundary condition was applied to the internal surface of the fibroblast, changing its shape from an ellipse (at the beginning of the analysis) to a circle (at the end of the analysis). The elliptical cell dimensions of 50 μm × 5 μm were estimated from images represented by the samples in Fig. 6. During cell contraction the cell volume was assumed to remain constant which led to a circle with the radius of 7.9 μm. The boundary conditions for the model are illustrated in Fig. 3A.
Figure 3.
Boundary conditions for the finite element modeling. A. In a pilot study, the top and bottom of the mesh were not permitted to move vertically. The lateral sides of the mesh were fixed in place. A displacement was applied to the wall of the fibroblasts in order to change the shape of the fibroblast from an ellipse to a circle. B. In the full analyses, the only modification to (A) was that the lateral sides of the mesh were allowed to move, simulating the contraction of the tendon
In the full analyses (Fig. 3B), the only difference was that the sides of the model were moved towards each other horizontally to mimic the shrinkage of the tendon. The travelling distance was determined by the cell deformation from the elliptic shape to a perfect circle, which results in a final size of only 31.6% of the model’s initial width. As in the pilot analysis, vertical movement of the sides of the model was not permitted, to preserve symmetry.
The commercial finite element modeling software package Abaqus (version 6.9-2; Simulia, Providence, RI, USA) was used to build the models and run the analyses.
3 Results
3.1 Crimp formation by the tendon construct requires active cells
Tendon-like constructs appear as a translucent tissue between the anchoring pins when examined by plain light (Fig. 4A). The unreleased construct is 10 mm in length and shows no evidence of crimp when visualized by PPLM (Fig. 4B and C). When the securing pins are removed from the Sylgard base, the constructs contract to ~3 mm during 30 minutes (Fig. 4D). The contraction is accompanied by the formation of a crimp-like pattern, which is visible by PPLM (Fig. 4E and F). The mean crimp length was 10.4 ± 2.8 μm compared with 11.5 ± 2.5 μm for 14-day ECMT that has been removed from the embryo (Fig. 4J). The observation that constructs contract and develop crimp when released from the culture plate led us to investigate if crimp formation was a property of the ECM or if cellular activity was required. Therefore, cell membranes were removed using Triton-X-100 solution (as previously described (Kalson et al. 2010)) and the constructs examined by plain light and PPLM. Protease inhibitors were added to the Triton solution to prevent proteolytic degradation of the constructs (as previously described (Kalson et al. 2010)). The results showed that the treated constructs did not shrink (compare Fig. 4G with Fig. 4A and 4D) and did not exhibit a crimp either prior to or after release from the Sylgard base (compare Fig. 4H and 4I with Fig. 4E). A 14 day ECMT, with crimp wavelength 11.5 ± 2.5 μm, is shown for comparison (Fig. 4J).
3.2 Mechanical testing and SEM shows embryonic crimp in embryonic tendon and in contracted tendon-like constructs
Metatarsal tendons dissected from 14-day chick embryos showed the expected toe-linear-fail features in the stress-strain curve. A typical curve is shown in Fig. 5A. As shown in Fig. 5B, tendon-like constructs that were released from the Sylgard culture dishes and mechanically-tested to failure showed the same features in the stress-strain curve as tendons removed from chick embryos. However, tendon-like constructs that were not allowed to contract prior to mechanical testing showed an almost absence of the ‘toe’ region in the stress-stress curve (see Fig. 5B ‘pinned’). Therefore, the toe region was explained by the requirement to stretch the tendon-like constructs to their pre-contracted length prior to near-linear extension of the tissue in response to the applied force. To determine if cellular activity was required to contract the tendon-like constructs, we treated constructs with Triton X-100 solution prior to unpinning the constructs. As shown in Fig. 5B, treatment of the constructs with Triton X-100 solution prior to release abolished the toe region in the stress-strain curve, thereby demonstrating that active cells are required for the contraction of the constructs when resistive force is removed. Scanning electron microscopy (SEM) confirmed the presence of wavy patterns of collagen fibrils in the released constructs but not the pinned constructs (see Fig. 5C).
3.3 Measurement of cellular contraction during crimp formation
The finding that the shortening and crimp formation of untensioned tendon constructs was dependent on cells led us to ask if shortening was accompanied by changes in cell morphology. Calcein AM was used to detect live cells when imaged using a confocal microscope. In the pinned construct the cells were arranged in longitudinal arrays and had an average length of 50.4 ± 6.3 μm and width of 4.3 ± 0.8 μm (Fig. 6A). In contrast, cells in the relaxed construct were more rounded (Fig. 6B) with an average length of 20.4 ± 5.3 μm and width 8.3 ± 0.7 μm. Therefore cells shorten and become wider during crimp formation.
3.4 Pilot finite element analysis
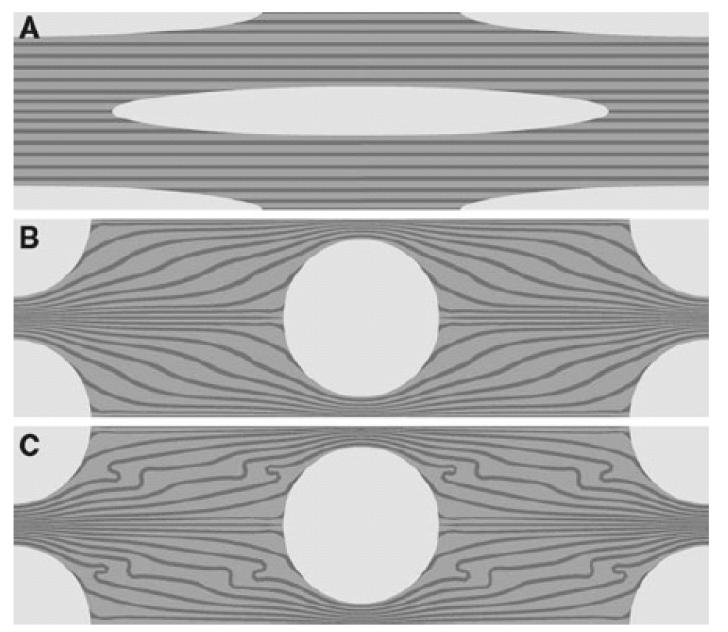
We performed finite element analysis to obtain insights into the mechanism of crimp formation. The results of the pilot finite element analyses are shown in Fig. 7. Fig. 7A shows the starting geometry of the model. The unit cell has been mirrored about the planes of symmetry to show one fibroblast in the centre of the model. Figs. 7B and 7C show the final geometry obtained after the analyses have finished. The main condition enforced on the model is the contraction of the fibroblasts, from an elongated shape to a circle. The results showed that contraction of the fibroblasts distorted the fibril bundles. Distortion is greater in Fig. 7C than Fig. 7B because the difference in stiffness between the fibril bundles and the ECM is greater in the former. In Fig. 7B, the fibril bundles are ten times stiffer than the inter-fibrillar matrix and in Fig. 7C, the fibril bundles are fifty times as stiff. The distortion increases as the ratio between the stiffness of the fibril bundles and the stiffness of the inter-fibrillar matrix increases.
Figure 7.
The pilot analyses. A shows the original mesh at the same scale as the results in (B) and (C). The fibrils in (B) and (C) are 10 times and 50 times as stiff as the matrix, respectively. This leads to a more distorted fibril orientation during cell contraction in C.
3.5 Full finite element analyses
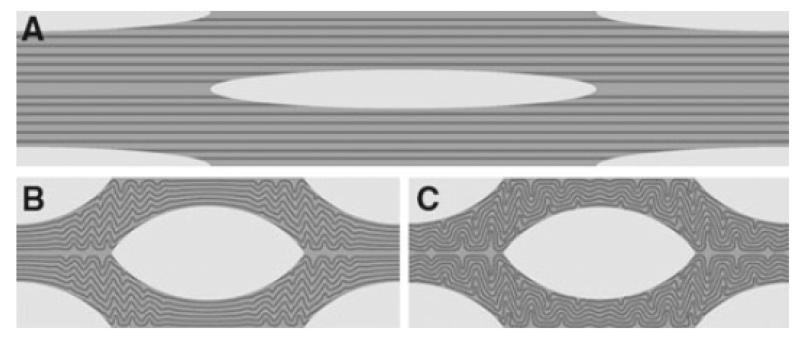
A selection of images for the full finite element analyses are shown in Figs. 8 and 9. Fig. 8A shows the starting geometry of the model. Figs. 8B and 8C show the geometry obtained at the end of the respective simulations. There are two features to note when comparing Figs. 8 and 9 with Fig. 7. Firstly, here the tendon was allowed to contract, as evidenced by the difference in image width (compare Fig. 8A with Fig. 8B). Secondly, the fibroblasts have not contracted to form the perfect circle seen in Figs. 7B and 7C. The latter feature is due to the finite element modelling process terminating early. As stated in Section 2, the Analyst defines the starting geometry and the desired end point of the simulation. The Solver then proceeds towards the desired end point in a series of approximately linear steps. Here, those steps can be thought of as the fibroblast changing shape in small increments from an ellipse to a circle. Intermediate steps are shortened ellipses. If the Solver encounters numerical difficulties at one of the steps, the simulation stops. The final output generated when the Solver stops is the last valid solution possible with that finite element mesh.
Figure 8.
The full analyses. A. The original mesh at the same scale as the results in (B) and (C). b. Fibrils 10x as stiff as the inter-fibrillar matrix. After contraction of the cells the fibrils arrange in a localized wavy pattern with a wavelength of 2.3 μm. C. Fibrils 100x as stiff as than the inter-fibrillar matrix. The crimp forms over the entire model, with a wavelength of 4.87 μm
Figure 9.
The full analyses. A. The original mesh at the same scale as the results in (B). B. The analysis where the fibrils are 750x as stiff as than the inter-fibrillar matrix. Here, the results are superimposed with the initial state of the model. After contraction of the cells the fibrils arrange in a wavy pattern with a wavelength of 8.57 μm
So here, the fibroblasts do not contract to form a perfect circle because the finite elements have become so distorted that it is not possible to proceed with the analysis. Despite this simulation detail, the results obtained do support the hypothesis that cell contraction leads to a crimp structure. They are also consistent with the experimental observations in Section 3.2 where the cells shorten and become wider during crimp formation.
The finite element study indicates that the wavelength of the crimp structure is dependent on the difference in mechanical stiffness of collagen fibers and inter-fibrillar matrix. For example, when the fibril bundles were ten times as stiff as the matrix, a crimp wavelength of 2.3 μm was obtained. This coincided with a tendon contraction of 100 μm to 52 μm (Fig. 8B). In comparison, when the fibril bundles were one hundred times as stiff as the matrix, a larger crimp wavelength of 4.9 μm was obtained. Here, the tendon had contracted from 100 μm to 62 μm (Fig. 8C). Another observation is that the geometry of the crimp structure is dependent upon the difference in stiffness. In Fig. 8B, the crimp structure was not distributed equally over the model but was concentrated between the cells. In contrast, figure Fig. 8C, with stiffer fibril bundles, shows a more evenly distributed crimp structure.
Fig. 9B shows the result of an analysis in which the fibril bundles were seven hundred and fifty times as stiff as the ECM. The visualization of the completed analysis (Fig. 9B) is superimposed on the initial state of the model (Fig. 9A). The crimp wavelength here was 8.6 μm for a tendon contraction from 100 μm to 64 μm. Note that the differences in tendon contractions for each of these models (52 μm, 62 μm and 64 μm) are due to the differences in where the finite element Solver decided to stop. This difference is consistent with the differing levels of crimp formation in the finite element models. The higher the stiffness of the fibrils, the tighter the crimp structure and the more distorted the finite elements.
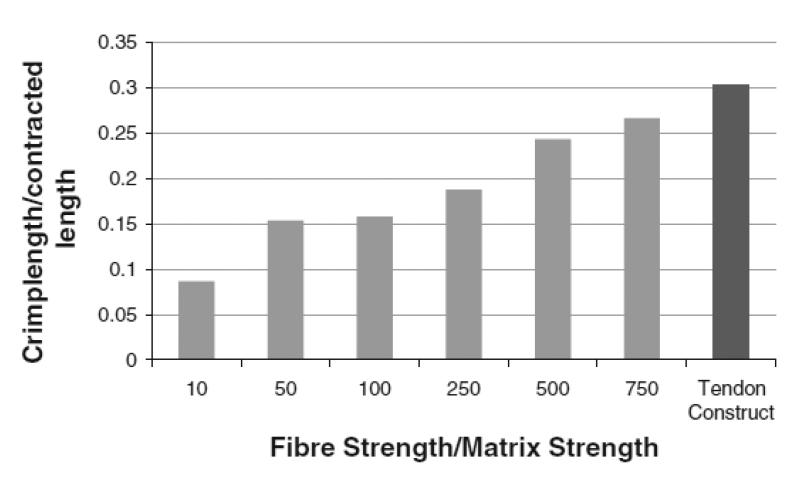
To investigate the relationship between stiffness and crimp length, a number of different model simulations were executed where the fibril bundles were 10x, 50x, 100x, 250x, 500x and 750x as stiff as the matrix. The difference in stiffness is plotted against the ratio of crimp wavelength to tendon contraction in Fig. 10. Values are given in Table 1. The ratio essentially normalizes the values for crimp wavelength to enable comparison. Fig. 10 shows a positive trend; as the stiffness of the fibril bundles increases with respect to the matrix, the crimp wavelength increases. Fig. 10 compares these simulated results with the experimental results. Dark grey bars are simulations and the final bar (coloured black) is for the tendon construct. The experimental construct has an initial length of 10 mm and contracts to a final length of approximately 6.6 mm. Here, a crimp wavelength of approximately 10 μm was measured. This leads to a crimp wavelength/contracted length ratio of 0.303, which is consistent with the trend predicted by the modelling.
Figure 10.
Crimp wavelength-to-contracted length ratio of models with differing stiffness of the collagen fibrils. The ratio increases with increasing fibril stiffness. The experimental tendon construct is compared with the simulations. The former has a value of 0.303, which is close to the value where the fibrils are 750x as stiff as the inter-fibrillar matrix (0.266).
Table 1.
| Bundle/matrix stiffness | Crime wavelength (μm) |
Tendon contraction (%) |
|---|---|---|
| 10 | 2.30 | 46.80 |
| 50 | 4.23 | 45.00 |
| 100 | 4.87 | 38.40 |
| 250 | 5.36 | 42.92 |
| 500 | 7.50 | 38.40 |
| 750 | 8.57 | 35.68 |
| Tendon construct | 10.00 | 33.33 |
Movies showing the progress of the finite element analyses are available as supplementary data files. The contraction of the different models can be monitored and a distinct difference in runtimes can be observed. This is due to the fact that the algorithm required more time to solve the models with a higher difference in stiffness between collagen fibrils and inter-fibrillar matrix.
4 Discussion
This study proposes that the formation of crimp in untensioned embryonic tendon is a consequence of cells actively pulling on the fibril bundles in the inter-fibrillar matrix in conjunction with a difference in stiffness between the fibril bundles and the inter-fibrillar matrix. A tendon-like construct, which shows similar structural and mechanical properties to embryonic tendon, was used to provide the quantitative data for a finite element model of crimp formation. A pilot model highlighted how a difference in stiffness between the fibril bundles and interfibrillar matrix leads to a wavy structure when the cell contracts. This wavy arrangement is caused by shear stresses that develop on the interface between the fibril bundles and the inter-fibrillar matrix. These shear stresses cause the stiffer fibril bundles to buckle and displace the less stiff inter-fibrillar matrix. As the ratio between the stiffness increases (i.e. fibril bundle stiffness/inter-fibrillar matrix stiffness), the shear stresses increase, leading to more pervasive buckling and an increase in crimp wavelength.
The full finite element analyses, with the additional condition of tendon shortening, predicted the development of the crimp structure with approximately the correct crimp length when the fibril bundles were 750 times stiffer than the matrix. It has been reported that, under increasing mechanical strain, both the crimp angle and the crimp wavelength increase in tendons (Jarvinen et al. 1999). This is in line with our findings and highlights the relevance of the finite element approach to studies of crimp formation.
Several theories have been proposed to explain the crimp structure. The collagen fibrillar matrix in tendon has been compared to a liquid crystal and that crimp formation is a spontaneous transition from an isotropic to a cholesteric phase (Giraud-Guille and Besseau 1998). Raspanti and co-workers report a loss of the D-period banding pattern (where D = 67 nm, the periodic structure of collagen fibrils) at the location of fibril crimps in rat Achilles tendon, explained by an absence of regular molecular packing (Raspanti et al. 2005). The exact organization of the collagen fibrils within the crimp structure is still under debate. Diamant and co-workers initially suggested a planar zigzag pattern with distinct joints where the fibrils kink (Diamant et al. 1972). However, other studies suggested a wavy pattern without distinct hinge sites (Yahia and Drouin 1989; Kannus 2000; Rowe 1985). Further studies proposed helical arrangements of fibril bundles (de Campos Vidal 2003). Recently, crimp formation has been proposed to result from a left-handed helical arrangement of microfibrils within fibrils (Franchi et al. 2010b). The fibrils are suggested to contain, therefore, points of changing direction that are aligned transversely across the tendon (Franchi et al. 2007b; Franchi et al. 2009; Raspanti et al. 2005). These points are suggested to constitute the fulcrum of biological hinges. In these regions the fibrils show a local left-handed helical arrangement of microfibrils corresponding to a local increased flexibility of the fibrils.
Here, a tendon-like construct, which shows similar structure and mechanical properties to embryonic tendon, was used to provide the quantitative data for a finite element model of crimp formation. The model predicted the development of the crimp structure with the correct length scale. The shape of the crimp structure in this model led to the conclusion that a planar wavy pattern is a possible basis for the crimp structure. An important difference in the data obtained by us to what has been reported for mature tendon is the absence of kink regions where the orientation of the collagen fibrils and fibril bundles change abruptly. We were mindful that the crimp in embryonic tendon and in the tendon-like constructs might differ from the crimp in mature rat (Raspanti et al. 2005; Franchi et al. 2007b; Franchi et al. 2010b; Franchi et al. 2009; Franchi et al. 2010a), bovine (de Campos Vidal 2003) or human tendons (Svensson et al. 2010a; Svensson et al. 2010b). SEM studies of embryonic tendon revealed a wavy crimp structure without the presence of fibrillar knots seen in mature tendon (Franchi et al. 2010a). This wavy pattern is also found in other fibrous tissues that have a load-bearing role, such as aponeuroses and arterial walls (Franchi et al. 2008). Further studies will determine if the wavy crimp seen in embryonic tendon is a precursor to mature crimp with fibrillar knots and kinks observed in older tendon.
Crimp angle and crimp length is greater in tendon under mechanical strain than in tendons of immobilised limbs (Jarvinen et al. 1999). Furthermore, crimp morphology is grossly disturbed in tendon tissue that has been injured, and is associated with sub-optimal response to mechanical loading (Jarvinen et al. 2004). Therefore the proposal that cells actively pull on their immediate matrix has direct relevance to crimp formation and the restoration of mechanical function after injury. The observation that crimp formation requires forces generated by cells and is sensitive to the relative mechanical properties of the fibrils and inter-fibrillar material, has implications for tissue healing and regeneration. For example, myofibroblasts exert contractile forces on adherent surfaces during wound healing, scar remodelling and fibrosis (Hinz 2009; Hinz and Gabbiani 2010; Desmouliere et al. 2005)). We expect that the methods we describe here to study the formation of crimp and the contraction of tendon tissue might be of value to understanding cell-mediated contractions of scars and wounds.
5 Summary
An understanding of crimp formation is important in attempts to promote tendon healing and to engineer replacement tissues. A tendon-like construct was used as a model system to investigate the mechanism of crimp formation in tendon. Structural evidence based on PPLM and light microscopy revealed that the crimp structure was induced by a contraction of the tendon fibroblasts. Based on this information an FEM was built comprising three structural components: fibroblasts, collagen fibrils and inter-fibrillar matrix. The contraction of the cell led to a wavy arrangement of the fibrils whose wavelength was regulated by the difference in stiffness between fibrils and matrix. The final model with fibrils 750 times as stiff as the matrix developed a crimp wavelength of 8.6 μm which is close to the value of 10.4 μm observed in the tendon construct.
Acknowledgements
The authors would like to thank Zartasha Mustansar and Peter Falkingham for help with Abaqus. Further thanks go to Mary McDerby and the Research Computing Services team at the University of Manchester for providing access to a powerful workstation for the finite element modeling. The research in KK’s group is funded by the Wellcome Trust. NSK is supported by a BBSRC studentship. LM’s contribution to the work was supported by the UK Engineering and Physical Sciences Research Council.
Abbreviations used
- ECMT
embryonic chick metatarsal tendon
- FEA
finite element analysis
- FEM
finite element modelling
- SEM
scanning electron microscopy
- ECM
extracellular matrix
- PPLM
plane polarised light microscopy
Bibliography
- Araujo JC, Teran FC, Oliveira RA, Nour EA, Montenegro MA, Campos JR, Vazoller RF. Comparison of hexamethyldisilazane and critical point drying treatments for SEM analysis of anaerobic biofilms and granular sludge. J Electron Microsc (Tokyo) 2003;52(4):429–433. doi: 10.1093/jmicro/52.4.429. [DOI] [PubMed] [Google Scholar]
- Ault HK, Hoffman AH. A composite micromechanical model for connective tissues: Part II--Application to rat tail tendon and joint capsule. J Biomech Eng. 1992;114(1):142–146. doi: 10.1115/1.2895438. [DOI] [PubMed] [Google Scholar]
- Bendjaballah MZ, Shirazi-Adl A, Zukor DJ. Biomechanics of the human knee joint in compression: reconstruction, mesh generation and finite element analysis. The Knee. 1995;2(2):69–79. [Google Scholar]
- Benjamin M, Kaiser E, Milz S. Structure-function relationships in tendons: a review. J Anat. 2008;212(3):211–228. doi: 10.1111/j.1469-7580.2008.00864.x. [DOI] [PMC free article] [PubMed] [Google Scholar]
- Chan YP, Tang CY, Tsui CP, Kojic M, Ng GYF. A mechanistic study of tendon fibre using a cell model. Indian Engineering Research. 2008;5:28–37. [Google Scholar]
- de Campos Vidal B. Image analysis of tendon helical superstructure using interference and polarized light microscopy. Micron. 2003;34(8):423–432. doi: 10.1016/S0968-4328(03)00039-8. [DOI] [PubMed] [Google Scholar]
- Desmouliere A, Chaponnier C, Gabbiani G. Tissue repair, contraction, and the myofibroblast. Wound Repair Regen. 2005;13(1):7–12. doi: 10.1111/j.1067-1927.2005.130102.x. [DOI] [PubMed] [Google Scholar]
- Diamant J, Keller A, Baer E, Litt M, Arridge RG. Collagen; ultrastructure and its relation to mechanical properties as a function of ageing. Proc R Soc Lond B Biol Sci. 1972;180(60):293–315. doi: 10.1098/rspb.1972.0019. [DOI] [PubMed] [Google Scholar]
- Farooqi JK, Sheikh MA. Finite element modelling of thermal transport in ceramic matrix composites. Computational Materials Science. 2006;37(3):361–373. [Google Scholar]
- Franchi M, Fini M, Quaranta M, De Pasquale V, Raspanti M, Giavaresi G, Ottani V, Ruggeri A. Crimp morphology in relaxed and stretched rat Achilles tendon. Journal of Anatomy. 2007a;210(1):1–7. doi: 10.1111/j.1469-7580.2006.00666.x. [DOI] [PMC free article] [PubMed] [Google Scholar]
- Franchi M, Ottani V, Stagni R, Ruggeri A. Tendon and ligament fibrillar crimps give rise to left-handed helices of collagen fibrils in both planar and helical crimps. Journal of Anatomy. 2010a;216(3):301–309. doi: 10.1111/j.1469-7580.2009.01188.x. [DOI] [PMC free article] [PubMed] [Google Scholar]
- Franchi M, Quaranta M, Macciocca M, De Pasquale V, Ottani V, Ruggeri A. Structure relates to elastic recoil and functional role in quadriceps tendon and patellar ligament. Micron. 2009;40(3):370–377. doi: 10.1016/j.micron.2008.10.004. [DOI] [PubMed] [Google Scholar]
- Franchi M, Quaranta M, Macciocca M, Leonardi L, Ottani V, Bianchini P, Diaspro A, Ruggeri A. Collagen fibre arrangement and functional crimping pattern of the medial collateral ligament in the rat knee. Knee Surg Sports Traumatol Arthrosc. 2010b;18(12):1671–1678. doi: 10.1007/s00167-010-1084-6. [DOI] [PubMed] [Google Scholar]
- Franchi M, Raspanti M, Dell’Orbo C, Quaranta M, De Pasquale V, Ottani V, Ruggeri A. Different crimp patterns in collagen fibrils relate to the subfibrillar arrangement. Connect Tissue Res. 2008;49(2):85–91. doi: 10.1080/03008200801913635. [DOI] [PubMed] [Google Scholar]
- Franchi M, Triré A, Quaranta M, Orsini E, Ottani V. Collagen structure of tendon relates to function. ScientificWorldJournal. 2007b;7:404–420. doi: 10.1100/tsw.2007.92. [DOI] [PMC free article] [PubMed] [Google Scholar]
- Freed AD, Doehring TC. Elastic model for crimped collagen fibrils. J Biomech Eng. 2005;127(4):587–593. doi: 10.1115/1.1934145. [DOI] [PubMed] [Google Scholar]
- Giraud-Guille MM, Besseau L. Banded patterns in liquid crystalline phases of type I collagen: relationship with crimp morphology in connective tissue architecture. Connect Tissue Res. 1998;37(3-4):183–193. doi: 10.3109/03008209809002438. [DOI] [PubMed] [Google Scholar]
- Goh KL, Aspden RM, Mathias KJ, Hukins DWL. Finite,Äìelement analysis of the effect of material properties and fibre shape on stresses in an elastic fibre embedded in an elastic matrix in a fibre,Äìcomposite material. Proceedings of the Royal Society of London Series A: Mathematical, Physical and Engineering Sciences. 2004;460(2048):2339–2352. [Google Scholar]
- Hansen KA, Weiss JA, Barton JK. Recruitment of tendon crimp with applied tensile strain. J Biomech Eng. 2002;124(1):72–77. doi: 10.1115/1.1427698. [DOI] [PubMed] [Google Scholar]
- Hinz B. Tissue stiffness, latent TGF-beta1 activation, and mechanical signal transduction: implications for the pathogenesis and treatment of fibrosis. Curr Rheumatol Rep. 2009;11(2):120–126. doi: 10.1007/s11926-009-0017-1. [DOI] [PubMed] [Google Scholar]
- Hinz B, Gabbiani G. Fibrosis: recent advances in myofibroblast biology and new therapeutic perspectives. F1000 Biol Rep. 2010;2:78. doi: 10.3410/B2-78. [DOI] [PMC free article] [PubMed] [Google Scholar]
- Jarvinen TA, Jarvinen TL, Kannus P, Jozsa L, Jarvinen M. Collagen fibres of the spontaneously ruptured human tendons display decreased thickness and crimp angle. J Orthop Res. 2004;22(6):1303–1309. doi: 10.1016/j.orthres.2004.04.003. [DOI] [PubMed] [Google Scholar]
- Jarvinen TA, Jozsa L, Kannus P, Jarvinen TL, Kvist M, Hurme T, Isola J, Kalimo H, Jarvinen M. Mechanical loading regulates tenascin-C expression in the osteotendinous junction. J Cell Sci. 1999;112(Pt 18):3157–3166. doi: 10.1242/jcs.112.18.3157. [DOI] [PubMed] [Google Scholar]
- Kalson NS, Holmes DF, Kapacee Z, Otermin I, Lu Y, Ennos RA, Canty-Laird EG, Kadler KE. An experimental model for studying the biomechanics of embryonic tendon: Evidence that the development of mechanical properties depends on the actinomyosin machinery. Matrix Biol. 2010;29(8):678–689. doi: 10.1016/j.matbio.2010.08.009. [DOI] [PMC free article] [PubMed] [Google Scholar]
- Kannus P. Structure of the tendon connective tissue. Scandinavian Journal of Medicine and Science in Sports. 2000;10(6):312–320. doi: 10.1034/j.1600-0838.2000.010006312.x. [DOI] [PubMed] [Google Scholar]
- Kapacee Z, Richardson SH, Lu Y, Starborg T, Holmes DF, Baar K, Kadler KE. Tension is required for fibripositor formation. Matrix Biol. 2008;27(4):371–375. doi: 10.1016/j.matbio.2007.11.006. [DOI] [PubMed] [Google Scholar]
- Ker RF. The implications of the adaptable fatigue quality of tendons for their construction, repair and function. Comp Biochem Physiol A Mol Integr Physiol. 2002;133(4):987–1000. doi: 10.1016/s1095-6433(02)00171-x. [DOI] [PubMed] [Google Scholar]
- Lavagnino M, Arnoczky SP, Kepich E, Caballero O, Haut RC. A finite element model predicts the mechanotransduction response of tendon cells to cyclic tensile loading. Biomech Model Mechanobiol. 2008;7(5):405–416. doi: 10.1007/s10237-007-0104-z. [DOI] [PubMed] [Google Scholar]
- Leahy JC, Hukins DW. Viscoelastic properties of the nucleus pulposus of the intervertebral disk in compression. J Mater Sci Mater Med. 2001;12(8):689–692. doi: 10.1023/a:1011212425029. [DOI] [PubMed] [Google Scholar]
- McNeilly CM, Banes AJ, Benjamin M, Ralphs JR. Tendon cells in vivo form a three dimensional network of cell processes linked by gap junctions. J Anat. 1996;189(Pt 3):593–600. [PMC free article] [PubMed] [Google Scholar]
- Nation JL. A new method using hexamethyldisilazane for preparation of soft insect tissues for scanning electron microscopy. Stain Technol. 1983;58(6):347–351. doi: 10.3109/10520298309066811. [DOI] [PubMed] [Google Scholar]
- Raspanti M, Manelli A, Franchi M, Ruggeri A. The 3D structure of crimps in the rat Achilles tendon. Matrix Biol. 2005;24(7):503–507. doi: 10.1016/j.matbio.2005.07.006. [DOI] [PubMed] [Google Scholar]
- Redaelli A, Vesentini S, Soncini M, Vena P, Mantero S, Montevecchi FM. Possible role of decorin glycosaminoglycans in fibril to fibril force transfer in relative mature tendons-a computational study from molecular to microstructural level. Journal of Biomechanics. 2003;36:1555–1569. doi: 10.1016/s0021-9290(03)00133-7. [DOI] [PubMed] [Google Scholar]
- Reese SP, Maas SA, Weiss JA. Micromechanical models of helical superstructures in ligament and tendon fibers predict large Poisson’s ratios. J Biomech. 2010;43(7):1394–1400. doi: 10.1016/j.jbiomech.2010.01.004. [DOI] [PMC free article] [PubMed] [Google Scholar]
- Rowe RW. The structure of rat tail tendon. Connect Tissue Res. 1985;14(1):9–20. doi: 10.3109/03008208509089839. [DOI] [PubMed] [Google Scholar]
- Sasaki N, Odajima S. Elongation mechanism of collagen fibrils and force-strain relations of tendon at each level of structural hierarchy. J Biomech. 1996;29(9):1131–1136. doi: 10.1016/0021-9290(96)00024-3. [DOI] [PubMed] [Google Scholar]
- Shah JS, Palacios E, Palacios L. Development of crimp morphology and cellular changes in chick tendons. Dev Biol. 1982;94(2):499–504. doi: 10.1016/0012-1606(82)90366-9. [DOI] [PubMed] [Google Scholar]
- Svensson RB, Hassenkam T, Grant CA, Magnusson SP. Tensile Properties of Human Collagen Fibrils and Fascicles Are Insensitive to Environmental Salts. Biophysical journal. 2010a;99(12):4020–4027. doi: 10.1016/j.bpj.2010.11.018. [DOI] [PMC free article] [PubMed] [Google Scholar]
- Svensson RB, Hassenkam T, Hansen P, Magnusson SP. Viscoelastic behavior of discrete human collagen fibrils. Journal of the Mechanical Behavior of Biomedical Materials. 2010b;3(1):112–115. doi: 10.1016/j.jmbbm.2009.01.005. [DOI] [PubMed] [Google Scholar]
- van der Rijt JA, van der Werf KO, Bennink ML, Dijkstra PJ, Feijen J. Micromechanical testing of individual collagen fibrils. Macromol Biosci. 2006;6(9):697–702. doi: 10.1002/mabi.200600063. [DOI] [PubMed] [Google Scholar]
- Wenger MP, Bozec L, Horton MA, Mesquida P. Mechanical properties of collagen fibrils. Biophys J. 2007;93(4):1255–1263. doi: 10.1529/biophysj.106.103192. [DOI] [PMC free article] [PubMed] [Google Scholar]
- Yahia LH, Drouin G. Microscopical investigation of canine anterior cruciate ligament and patellar tendon: collagen fascicle morphology and architecture. J Orthop Res. 1989;7(2):243–251. doi: 10.1002/jor.1100070212. [DOI] [PubMed] [Google Scholar]


