Introduction
Microbubble contrast agents (MCAs) are nearing their second decade as a technology for enhancing blood flow imaging with ultrasound. These micron-sized gas bubbles, typically filled with a pefluorocarbon or other low-solubility gas, are stabilized with a thin shell such as a lipid, protein, or polymer, to enhance their circulation time in the bloodstream. In a clinical imaging exam, MCAs are injected into a peripheral vein and circulate for several minutes before dissolving or being cleared by the reticuloendothelial system.1 Contrast-enhanced ultrasound imaging (CEUS) is approved in the United States for delineation of the endocardial border and ventricular chamber enhancement, and it is utilized in Europe and off-label in the US for radiological applications such as breast, liver, and kidney imaging.2
One of the unique techniques which can be utilized with CEUS, which is not possible with nuclear medicine agents or computed tomography contrast, is the intentional rapid clearance of the microbubbles using the imaging system. A short high-intensity pulse of ultrasound will cause rapid fragmentation and dissolution of MCAs in the sample volume being imaged.3 This clearance pulse, followed by lower-intensity imaging which does not fragment the microbubbles, allows the observation of regional blood flow rates as the microbubbles flow back into the tissue of interest after clearance. MCA refill rate into regions of the microvasculature can be utilized to estimate microvascular blood flow and generate spatial maps of flow rate in the tissue being imaged. This technique, also called “destruction-reperfusion,” has been utilized to map blood flow in myocardium,4 the kidney,5 and tumors.6-8 Broumas et al. have demonstrated that this technique can estimate regional blood flow in tumors similar to contrast-enhanced computed tomography.6 Recently, Pollard et al. have combined destruction-reperfusion imaging with real-time motion correction to make this technique more robust in the presence of tissue motion, and have demonstrated its application in monitoring renal blood flow in response to vasoactive agents.5
One of the technologies that has facilitated reperfusion imaging is the development of contrast-specific imaging strategies which can detect microbubbles non-destructively with high contrast-to-tissue ratios. These techniques, such as Phase Inversion, Amplitude Modulation, or Cadence Pulse Sequence (CPS) imaging, utilize multiple pulse imaging and varying amplitude and/or phase transmit pulses in order to elicit non-linear microbubble responses which are differentiable from tissue.9 However, the complex nature of these contrast-specific imaging sequences has also delayed their application in 3-D ultrasound imaging. Real-time 3-D ultrasound imaging has recently become efficient on clinical ultrasound systems, and is now seeing increasing clinically in applications such as obstetrics and cardiology.10-12 However, the 2-D matrix transducers and ultrasound systems used for 3-D imaging are not yet designed to produce the multiple-pulse, variable amplitude and phase inversion imaging sequences that are required for sensitive detection of microbubbles with tissue-clutter suppression.
Thus, CEUS imaging with tissue echo suppression is primarily a 2-D modality. This limitation has recently become more of a concern with the growing population of researchers interested in utilizing CEUS as a modality for estimating tissue perfusion non-invasively because of large differences in tissue perfusion as a function of imaging region. Although Pollard et al. recently demonstrated the utility of destruction-reperfusion for quantitative parametric perfusion imaging in rodent kidneys, they also observed that even small changes to the transducer position, such as those caused by removing and reapplying the transducer, produced substantial standard deviations in measurement repeatability.5 Similarly, Sullivan et al. observed that when assessing renal perfusion with ultrasound, the degree of perfusion variability was very large and dependent on the user-defined region of interest.13 Hence, we hypothesize that in order to overcome imaging plane bias when estimating tissue perfusion, perfusion of the entire organ or tumor should be considered.
With the increasing application of ultrasound for monitoring tissue blood flow, the need for 3-D perfusion mapping is becoming more recognized. French et al. demonstrated the capability of using destruction-reperfusion techniques with a mechanically scanned system to estimate perfusion defects in mouse models of myocardial infarction.14 Chen et al. have recently demonstrated a dual-beam technique to achieve perfusion estimation using two dual planar imaging transducers; one for destruction, and one for imaging.15, 16 Chen’s method, which was validated in-vitro, is proposed as a more rapid technique than the single-transducer approach described here, however, would be more challenging to implement in vivo.
In this study, we first evaluate the consistency of perfusion rate estimation as a function of contrast agent administration rate. We then demonstrate the variability of measured perfusion estimates across different 2-D imaging planes of the rat kidney. In order to improve repeatability, a Siemens Sequoia 512 clinical ultrasound system is modified for 3-D imaging by interfacing a computer-controlled motion stage with the transducer. Our 3-D imaging system is utilized to record volumetric perfusion estimates in rat kidneys, before and after administration of a vasoactive drug. We assess the repeatability of these 3-D perfusion measurements over serial imaging studies, and compare their consistency to 2-D imaging.
Materials and Methods
Parametric imaging
Parametric blood perfusion maps were produced by using the destruction-reperfusion imaging technique as previously described.4, 7 This technique relies on a using a high mechanical index ultrasound pulse to clear contrast agents from the sample volume, followed by a series of lower mechanical index, non-destructive, pulses which allow imaging of the contrast as it reperfuses vasculature in the sample volume. Ultrasound imaging was performed with an Acuson Sequoia 512 system (Siemens Medical Solutions USA, Inc. – Mountain View, CA) using a 15L8 linear array transducer. The “CPS Capture” software tool was used to implement the destruction reperfusion algorithm, and custom software for motion correction allowed frame alignment through a real-time sum of absolute difference based search using the derived B-mode information. The non-destructive imaging was performed in CPS mode at a mechanical index of 0.18. This mode has been previously shown to be non-destructive to contrast agents produced in our lab (Streeter, unpublished results). Parametric mapping parameters utilized here have been previously described in detail by Pollard et al.5 Briefly, reperfusion rate data was displayed by mapping the colors of each pixel according to the time required for the intensity in each pixel to reach 20% of full scale from the time the destruction event was recorded, and then normalized to a user adjustable time range (10 seconds for studies described in this paper).
Volumetric data acquisition
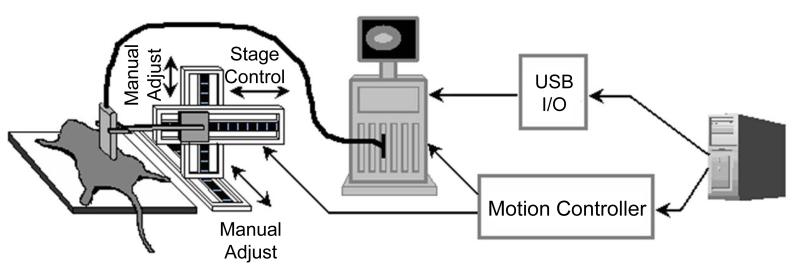
3-D perfusion images were generated by collecting a parametric destruction-replenishment image at multiple, evenly-spaced locations throughout the kidney. To accomplish this goal, a computer-controlled motion stage and motion controller (Models UTS150PP and ESP300, Newport – Irvine, CA) were interfaced through LabView (National Instruments – Austin, TX) to enable the precise positioning of the ultrasound transducer.
The LabView program on a controller desktop computer allowed the user to select step sizes and scan lengths depending on the size of the organ being imaged and the desired voxel depth. The transducer was mounted to the motion stage with the imaging plane perpendicular to the direction of motion. For 3-D perfusion capture, the PC also remotely controlled the microbubble destruction (MBD) and “Clip Store” functions of the Sequoia through a custom interface.
When the motion stage had moved the transducer to an imaging location, the PC triggered the Sequoia to output a one second microbubble destruction pulse after which MCAs were imaged non-destructively for 10 seconds. At the end of each perfusion capture sequence, the PC triggered the image store on the Sequoia system. A schematic of the system is shown in Figure 1.
Figure 1.
Diagram of 3-D ultrasound scanning system.
System calibration
In order to ensure independent image slices were taken, the elevational resolution of the transducer was measured. Contrast agents were flowed through a 75 μm polymer tube (Paradigm Optics - Vancouver, WA) angled 45 degrees from the normal of the imaging plane. The apparent length of the tube was recorded at multiple step locations and the −6 dB elevational beamwidth was found as described in Thijssen.17
Animal imaging protocol
Kidneys were chosen as the imaging target in this study because they are well vascularized and easily acoustically visible. Adult Sprague Dawley rats, ranging in size from 250 to 350 g, were imaging subjects in these studies. Anesthesia was initiated with 5% isoflurane (Halocarbon Laboratories - River Edge, NJ) in oxygen, and maintained at 2.5%. Animals were held in a supine position on a temperature controlled heating pad (THM150, VisualSonics Inc - Toronto). The imaging region was shaved and depilatory cream applied (Church & Dwight Co. - Princeton, NJ). The transducer was coupled to the skin using ultrasound transmission gel (Aquasonic, Parker Labs - Fairfield, NJ). Upon locating the kidney, the transducer was moved across the entire length of the kidney in order to ensure the organ was free from any shadowing. A 24 gauge indwelling catheter was inserted in the tail vein, and contrast administration was provided by a computer-controlled syringe pump (Harvard Apparatus - Holliston, MA). Contrast agents consisted of lipid-shelled microbubbles (mean diameter 0.9 μm, standard deviation 0.45 μm) filled with decafluorobutane gas, formulated as described previously.18 Injection concentration was approximately 3 × 10⁹ bubbles/mL after dilution in sterile saline. Animal use protocols were approved by the University Of North Carolina School Of Medicine.
Effect of contrast administration rate
To determine if contrast agent infusion rate, or equivalently, administered concentration, affected measured perfusion time in-vivo, blood perfusion estimates were acquired in a single sagittal kidney slice for several rats (N = 4) with varying infusion rates. Infusion rate was varied from 1.2 × 10⁸ to 3.9 × 10⁸ bubbles/min via the syringe pump.
Verification of repeatability
3-D scans were performed on the left kidneys of rats to investigate the repeatability of the imaging method and its sensitivity to the initial transducer location. The transducer was positioned to image the kidney parallel to the sagittal plane and parametric reperfusion images were acquired at one millimeter increments (N=7 rats). After each 3-D scan was completed, the transducer was either offset by a half step, or completely removed from the rat, and then replaced and realigned. For evaluation of repeatability as a function of scanning direction, additional imaging studies were also performed with the transducer parallel to the transverse plane, and scanned along the long axis of the kidney (N=3 rats). Each imaging scan was repeated 3-6 (average of 4) times on each rat, with larger kidneys receiving fewer scans due to time and injection volume limitations.
Vasoactive drug administration
To measure changes in perfusion caused by vasoactive drugs, and to compare these results with changes in perfusion observed as a function of imaging plane, several rats (N = 4) were imaged both before and after administration of dopamine. Two 3-D scans were taken before injection to generate a baseline perfusion rate. Dopamine was then added to the syringe containing the bubbles, to ensure no variation in bubble concentration, and injection of MCAs resumed. Dosing of dopamine was approximately 2 μg/kg/min. Three minutes were allowed to pass before imaging in order for the drug take effect, after which two more scans were completed.
Data analysis
Data was retrieved from the Sequoia at the end of imaging sessions and exported in DICOM format with JPEG compression. Images were then analyzed offline in Matlab (Mathworks - Natick, MA). Regions of interest were manually selected around the kidney for each 2D slice. Reperfusion time data was recovered for each pixel based on the colormap. These time values were then averaged separately in each slice to create mean perfusion values for each 2D section imaged. Volumetric perfusion estimates were calculated by averaging the 2D data with each slice weighted by the area of the kidney portion imaged in that section.
Results and Discussion
System calibration
The −6 dB elevational beam width was measured to be approximately 0.9 mm, which agreed with the data provided by the manufacturer. For convenience, all step sizes were chosen to be 1 mm.
Effect of contrast administration rate
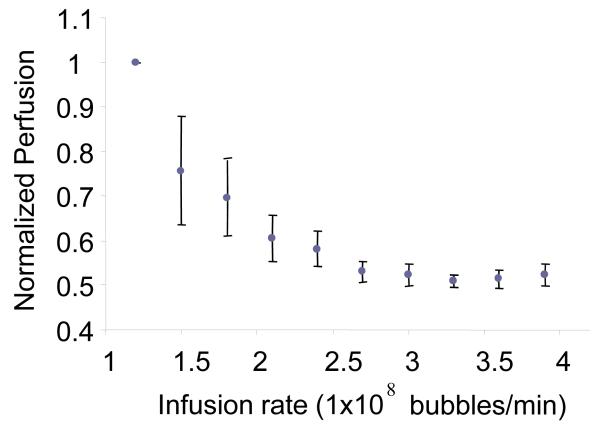
Perfusion time estimates were observed to decrease significantly as a function of contrast administration rate from 1.2 × 10⁸ bubbles/min to 2.1 × 10⁸ bubbles/min, after which the curve reached a plateau as shown in Figure 2. Contrast administration rates from 2.1 × 10⁸ and 2.7 × 10⁸ bubbles/min were observed to result in less bias (standard deviation less than 10%) on measured perfusion rate in the kidney. Contrast administration rates from 2.7 × 10⁸ and 3.9 × 10⁸ bubbles/min were very consistent – standard deviations less than 3%. To compromise between the injection volume limitations of the animals and the accuracy of higher MCA concentration, an infusion rate of 2.7 × 10⁸ bubbles/min (concentration of 3 × 10⁹ bubbles/mL) was chosen for all drug studies.
Figure 2.
Plot of measured perfusion time versus contrast administration rate for a single imaging plane. The perfusion times for each rat (N = 4) were normalized to be a percentage of the baseline perfusion time seen at an injection rate of 1.2 × 10⁸ bubbles/min. Error bars indicate standard deviation in mean perfusion times calculated for all 4 animals.
Plane to plane repeatability
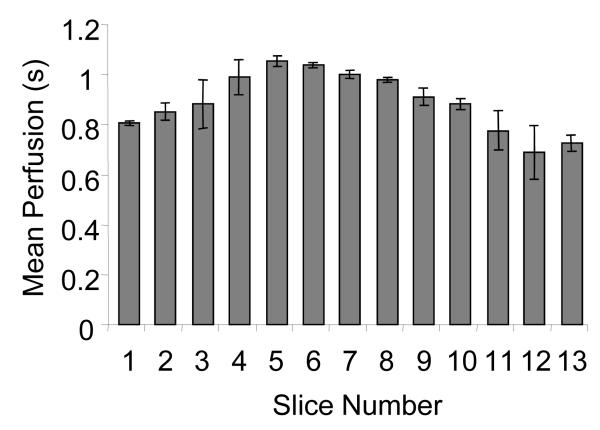
Mean perfusion rates were calculated at each 2-D imaging plane in several kidneys (N = 4). Results indicated that different imaging planes acquired from the central 5 mm in each kidney produced perfusion estimates with an average standard deviation of 10% across all 4 trials. The absolute variation in perfusion time for the middle 5 mm in some kidneys was as high as 22%. An example of mean perfusion times for individual slices in a single kidney is given in Figure 3.
Figure 3.
Slice by slice variation in perfusion throughout the volume of the kidney in a single rat averaged for 3 scans. The central slices show slower mean perfusion as the medulla is a greater proportion of the region being imaged. Error bars indicate standard deviation of perfusion time in each 2-D slice across 3 scans.
Volumetric repeatability
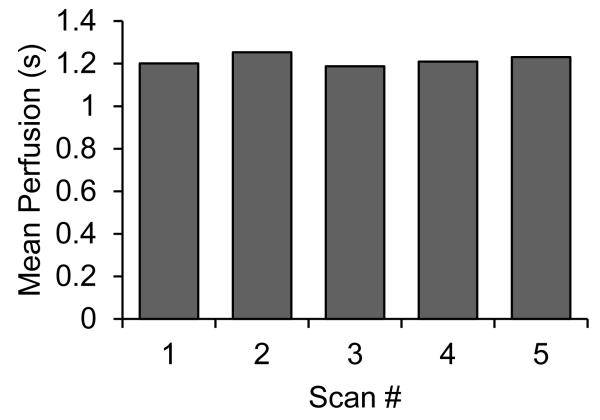
In contrast to 2-D perfusion time measurements, perfusion calculations produced by imaging the entire kidney volume showed excellent repeatability. Despite offsetting and repositioning the transducer in between scans, repeat volumetric perfusion measurements of the same kidney demonstrated an average standard deviation of only ~3%. This was true for both imaging scans where the transducer was swept across the kidney short axis (N=7), and long axis (N=3). However, the average value for kidney perfusion estimates measured by sagittal scanning differed by 8% from those created by transverse scanning. Mean volumetric perfusion times from 5 scans along the short axis of a single kidney are shown in Figure 4.
Figure 4.
Mean volumetric perfusion in a single rat kidney, as calculated during five successive imaging scans through the sagittal axis. Between each scan the transducer was manually repositioned so that each scan could be considered independent. Mean value was 1.22 s, and standard deviation across all scans was 0.03 s.
Vasoactive drug effects
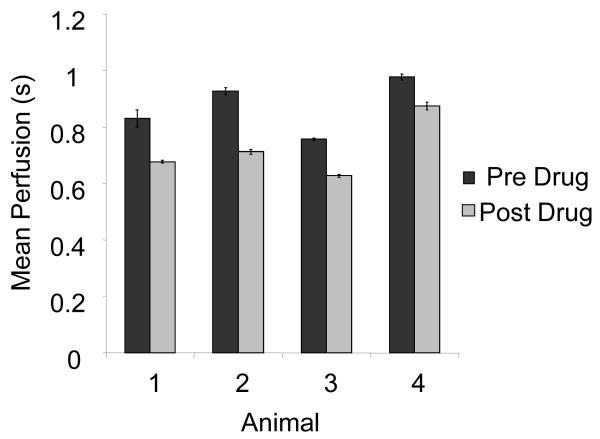
Administration of dopamine at 2 μg/kg/min resulted in a reduction in replenishment time, as expected.19 Refill rates decreased by an average of 17 ± 5 % after the injection of drug (N = 4). This change was statistically significant (p < 0.05). Perfusion rates calculated before and after administration of the drug are shown in Figure 5.
Figure 5.
Mean perfusion time for entire kidneys before and after administration of dopamine. On each animal, two scans were taken and averaged both before and after drug administration. Error bars indicate standard deviation in perfusion time between scans.
Discussion
Effects of administration rates
Although contrast agent administration rate was shown to bias perfusion rates, our results indicated that bias was most significant at low concentrations. Contrast agent administration rates above 2.7 × 10⁸ bubbles/min were observed to have minimal effect (less than 3% change in perfusion rate) within the range of infusion rates tested. Note that these measurements were based upon the contrast agents formulated in our lab. Microbubble size distribution can have a substantial effect on microbubble echogenicity in-vivo, and hence it would be important to reevaluate the optimal administration rate for different contrast agent populations.20 Additionally, it is possible that perfusion rate within the animal changed within the study time period, although our best efforts were made to maintain physiological variables, such as animal temperature and anesthesia depth, constant. It is possible that administration of the contrast agent itself affected kidney perfusion rate, although this is unlikely since the net volume of contrast and saline injected was small: 1.5 mL, or ~7% of the total blood volume of the rat.
Inconsistencies of 2-D sampling
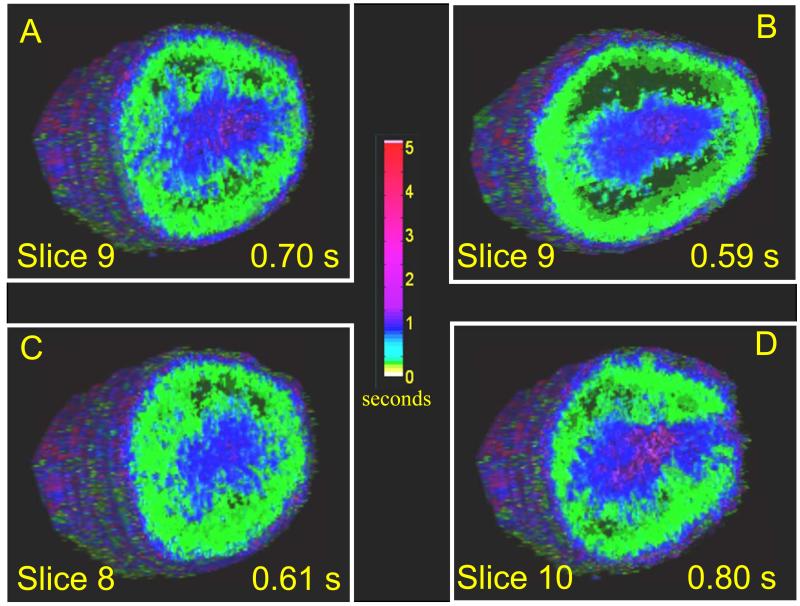
2-D parametric perfusion mapping was demonstrated to be highly dependent on the imaging plane chosen. Results indicated that the deviation in perfusion rate between individual slices in the same kidney is on the same order as the change in perfusion observed in the same imaging slice as a result of the administration of a vasoactive drug. This was true for even very small (1 mm) alterations in transducer position (Figure 6) such as those that would be incurred by manually removing and repositioning the transducer during a serial study. These results are in agreement with Pollard et al., who utilized a similar parametric imaging technique to measure changes in renal perfusion in response to different vasoactive drugs. Pollard observed that unless the transducer was mechanically fixed in the same imaging plane before and after drug administration, accurate measurements of perfusion changes induced by the vasoactive drugs dopamine and hydralazine could not be obtained.5 Similarly, Sullivan et al. observed that when assessing renal perfusion with ultrasound, the degree of perfusion variability was very large and dependent on the user-defined region of interest.13
Figure 6.
Volume parametric perfusion images of a rat kidney (A) before injection of drug, mean perfusion time of 0.70 seconds (B) The same slice shown after administration of dopamine, mean perfusion time is reduced to 0.59 seconds. (C) Slice 1 mm lateral of slice A without dopamine, perfusion time 0.61 seconds (D) Slice 1 mm medial of A without dopamine, mean perfusion of 0.80 seconds. The colorbar indicates reperfusion time in seconds for each voxel, as estimated by described algorithm.
Repeatability of the 3-D imaging method
By utilizing volumetric perfusion analysis, we have demonstrated that we could make repeatable perfusion estimates of the same kidney within 3%, even if the transducer was removed and repositioned. This alleviates the requirement of keeping the transducer mechanically fixed on the region of interest during an entire study to maintain the same imaging plane, and allows the detection of smaller changes in perfusion over serial imaging studies than would be achievable with error caused by transducer repositioning. One of the primary motivations for understanding blood perfusion in tissue is to study the response of tumors to therapy, and it is well understood that the vascular supply of many tumors is heterogeneous. Additionally, when imaging tumors that are growing or shrinking, imaging the same location through time might be impossible. In these cases, the motivation for volumetric perfusion imaging is even more apparent.
Limitations of the system
A major limitation of the current system is the imaging time required to complete a scan. For larger rats, the scanning distance needed to capture the entire kidney was generally between 2 and 2.4 cm, with CPS capture times of 10 seconds required to ensure complete reperfusion of the renal medulla. Each scan, therefore, took approximately 5 minutes. At our dilution, this meant administering on the order of several hundred microliters of contrast agent diluted in saline to the rat, and only a few repeat studies could be performed on the same animal without exceeding the injection guidelines for tail-vein introduced fluids in a rat. However, compared to other small animal imaging modalities such as MRI and CT, this time is still quite reasonable.
Another limitation of the current system is that the volumetric data is acquired by destruction-reperfusion in multiple 2-D imaging planes. Although volumetric perfusion measurements were repeatable within 3% along the same scanning axis, when estimates were acquired with a perpendicular transducer orientation, the mean estimate differed by 8%. One hypothesis for this difference is that due to varying vascular orientation in the tissue volume, a drastic change in transducer orientation might produce different perfusion time estimates, particularly in tissues with substantial vessel anisotropy. These results are in contrast to observations from Chen et al., who observed no significant differences in perfusion estimates acquired with mechanical scanning in perpendicular orientations across an ex-vivo kidney model. Therefore, it seems likely that tissue motion is responsible for the difference seen with varying transducer orientation. Our 2-D approach to acquiring data limits the motion-correction ability; respiratory and other motion can be compensated only if the motion is within plane. During transverse imaging studies, out of plane motion was observed to cause greater artifacts compared with images taken along the sagittal plane, and hence we hypothesize this may be a reason for the difference in values obtained by scanning in these orthogonal directions.
Fortunately, it is fairly easy to scan a sample volume in the same orientation in serial imaging studies, so this is not necessarily a significant limitation. However, it is anticipated that these limitations of volume-uniform destruction and multi-plane motion alignment will be alleviated with further improvements in 3-D imaging technology for contrast detection.
Finally, the perfusion time algorithm used in this study was sensitive to changes in bubble administration rate. This fact makes serial studies more difficult, and exposes problems based on bubble changes during injection (floatation, dissolution).21 Alternative algorithms for measuring perfusion time which are less prone to changes in concentration are being developed.
Conclusion
Our results indicate that 3-D CEUS imaging provides improved repeatability in measuring perfusion rates in a rat kidney model compared to traditional 2-D imaging. This is important for performing serial studies where it difficult to image the same imaging plane consistently, especially when imaging tissue with heterogeneously distributed vasculature. Additionally, we observed that perfusion estimates could be biased by the microbubble infusion rate, and thus should be carefully selected when doing serial imaging studies.
References
- 1.Dayton PA, Rychak JJ. Molecular ultrasound imaging using microbubble contrast agents. Frontiers in Bioscience. 2007;12:5124–5142. doi: 10.2741/2553. [DOI] [PubMed] [Google Scholar]
- 2.Goldberg BB, Raichlen JS, Forsberg F. Ultrasound Contrast Agents, basic principles and clinical applications. Martin Dunitz Ltd.; London: 2001. [Google Scholar]
- 3.Chomas JE, Dayton P, May D, et al. Threshold of fragmentation for ultrasonic contrast agents. J Biomed Opt. 2001;6(2):141–50. doi: 10.1117/1.1352752. [DOI] [PubMed] [Google Scholar]
- 4.Wei K, Jayaweera AR, Firoozan S, et al. Quantification of myocardial blood flow with ultrasound-induced destruction of microbubbles administered as a constant venous infusion. Circulation. 1998;97(5):473–483. doi: 10.1161/01.cir.97.5.473. [DOI] [PubMed] [Google Scholar]
- 5.Pollard RE, Dayton PA, Watson KD, et al. Motion corrected cadence CPS ultrasound for quantifying response to vasoactive drugs in a rat kidney model. Urology. 2009;74(3):675–81. doi: 10.1016/j.urology.2009.01.086. [DOI] [PMC free article] [PubMed] [Google Scholar]
- 6.Broumas AR, Pollard RE, Bloch SH, et al. Contrast-enhanced computed tomography and ultrasound for the evaluation of tumor blood flow. Invest Radiol. 2005;40(3):134–47. doi: 10.1097/01.rli.0000152833.35744.7f. [DOI] [PMC free article] [PubMed] [Google Scholar]
- 7.Chomas JE, Pollard RE, Sadlowski AR, et al. Contrast-enhanced US of Microcirculation of Superficially Implanted Tumors in Rats. Radiology. 2003;229(2):439–46. doi: 10.1148/radiol.2292020536. [DOI] [PubMed] [Google Scholar]
- 8.Pollard RE, Sadlowski AR, Bloch SH, et al. Contrast-assisted destruction-replenishment ultrasound for the assessment of tumor microvasculature in a rat model. Technol Cancer Res Treat. 2002;1(6):459–70. doi: 10.1177/153303460200100606. [DOI] [PubMed] [Google Scholar]
- 9.Pomper MG, Gelovani JG. Molecular Imaging in Oncology. Informa Healthcare USA, Inc; New York: 2008. [Google Scholar]
- 10.Mor-Avi V, Sugeng L, Lang RM. Three-dimensional adult echocardiography: where the hidden dimension helps. Curr Cardiol Rep. 2008;10(3):218–25. doi: 10.1007/s11886-008-0037-x. [DOI] [PubMed] [Google Scholar]
- 11.Sugeng L, Mor-Avi V, Lang RM. Three-dimensional echocardiography: coming of age. Heart. 2008;94(9):1123–5. doi: 10.1136/hrt.2007.133702. [DOI] [PubMed] [Google Scholar]
- 12.Kurjak A, Miskovic B, Andonotopo W, et al. How useful is 3D and 4D ultrasound in perinatal medicine? J Perinat Med. 2007;35(1):10–27. doi: 10.1515/JPM.2007.002. [DOI] [PubMed] [Google Scholar]
- 13.Sullivan JC, Wang B, Boesen EI, et al. Novel use of ultrasound to examine regional blood flow in the mouse kidney. Am J Physiol Renal Physiol. 2009;297(1):F228–35. doi: 10.1152/ajprenal.00016.2009. [DOI] [PMC free article] [PubMed] [Google Scholar]
- 14.French BA, Li Y, Klibanov AL, et al. 3D perfusion mapping in post-infarct mice using myocardial contrast echocardiography. Ultrasound Med Biol. 2006;32(6):805–15. doi: 10.1016/j.ultrasmedbio.2006.03.002. [DOI] [PubMed] [Google Scholar]
- 15.Chen NG, Fowlkes JB, Carson PL, et al. Rapid 3D imaging of contrast flow: demonstration of a dual beam technique. Ultrasound Med Biol. 2007;33(6):915–23. doi: 10.1016/j.ultrasmedbio.2006.10.017. [DOI] [PMC free article] [PubMed] [Google Scholar]
- 16.Chen NG, Fowlkes JB, Carson PL, et al. Rapid 3-D imaging of contrast flow: application in a perfused kidney phantom. Ultrasound Med Biol. 2009;35(5):813–28. doi: 10.1016/j.ultrasmedbio.2008.10.016. [DOI] [PMC free article] [PubMed] [Google Scholar]
- 17.Thijssen JM, Weijers G, de Korte CL. Objective performance testing and quality assurance of medical ultrasound equipment. Ultrasound Med Biol. 2007;33(3):460–71. doi: 10.1016/j.ultrasmedbio.2006.09.006. [DOI] [PubMed] [Google Scholar]
- 18.Zhao S, Borden MA, Bloch S, et al. Radiation-force assisted targeting facilitates ultrasonic molecular imaging. Mol Imaging. 2004;3(3):135–148. doi: 10.1162/1535350042380317. [DOI] [PMC free article] [PubMed] [Google Scholar]
- 19.Goldberg LI. Cardiovascular and renal actions of dopamine: potential clinical applications. Pharmacol Rev. 1972;24(1):1–29. [PubMed] [Google Scholar]
- 20.Streeter JE, Gessner R, Miles I, et al. Improving sensitivity in ultrasound molecular imaging by tailoring contrast agent size distribution: in vivo studies. Mol Imaging. 2010;9(2):87–95. [PMC free article] [PubMed] [Google Scholar]
- 21.Kaya M, Gregory TS, Dayton PA. Changes in microbubble contrast agent population during continuous infusion and methods to maintain consistency. Ultrasound Med Biol. 2009;35(10):1748–55. doi: 10.1016/j.ultrasmedbio.2009.04.023. [DOI] [PMC free article] [PubMed] [Google Scholar]


