

Abstract
Interleukin (IL)-8 plays the critical role in the initiation of micro-environmental inflammation responsible for tumour growth and patient prognosis. This study aimed at investigating the molecular mechanisms of IL-8 production from human hepatocellular carcinoma (HCC) cells. The levels of IL-8 and phosphorylation of p38 mitogen-activated protein kinase (MAPK), ERK1/2 and Akt in MHCC-97H cells were measured by ELISA, Western blot and immunofluorescence. NF-κB p65 protein nuclear translocation was determined by non-radioactive NF-κB p50/p65 transcription factor activity kit and cell bio-behaviours were detected by the real-time cell-monitoring system. Tumour necrosis factor-α (TNF-α) significantly induced phosphorylation of p38 MAPK, ERK, Akt and production of IL-8 from HCC cells, which were prevented by SB203580 (p38 MAPK inhibitor), PD98059 (ERK inhibitor), LY294002 and Wortmannin (PI3K inhibitor) and SB328437 (CCR3 inhibitor). TNF-α could significantly increase the translocation of NF-κB p65 protein into the nucleus in a dose-dependent manner, while SB203580 partially inhibited. In inflammatory micro-environment, HCC auto-produced IL-8 through p38 MAPK, ERK and PI3K/Akt signalling pathways, where the p38 MAPK is a central factor to activate the NF-κB pathway and regulate the expression of IL-8 production. There was a potential cross-talking between receptors.
Keywords: Hepatocellular carcinoma, Interleukin-8, MAPK pathway, PI3K/Akt pathway, NF-κB, CCR3
Introduction
The inflammatory micro-environment, consisting of inflammatory cells and mediators, has been suggested to play the critical and important role in tumour growth, progression and susceptibility to therapies. The inflammatory process is inherently associated with many different cancer types, including hepatocellular carcinoma (HCC) [1-3]. However, the driving forces of the migration and infiltration of leucocytes into the HCC tissue remain unclear, although the tissue consists of macrophages, fibroblasts and endothelial cells. Tumour cells per se may secrete various chemokines, responsible for the infiltration of leucocytes, for example tumour-associated macrophages, which produce growth or angiogenic factors to stimulate cancer progression and spreading [4-6].
The chemokines represent a large group of small chemotactic proteins characterized as four families (C, CC, CXC and CX3C) based on the spacing of key cysteine residues near the N terminus of these proteins. Chemokines can direct the migration of leucocytes, in particular during infection and inflammation [7, 8]. Cancer cell-derived chemokines may play an important role in tumour micro-environment, of which interleukin (IL)-8 is one of the major mediators of the inflammatory response [9]. IL-8 could primarily target a number of cells, for example endothelial cells, macrophages, mast cells, keratinocytes, neutrophil granulocytes and monocytes [8, 10], and contribute to tumour progression through the chemoattractive function in the regulation of angiogenesis, cancer cell growth and survival, as well as tumour cell motion [9].
The expression of IL-8 was found in various human cancers [11], including HCC [12-14], and regulated by various tumour micro-environment factors, such as hypoxia, tumour necrosis factor-α (TNF-α) and IL-1β. Expression of IL-8 was detected in human malignant liver tumour tissue where the endothelial cell contained the most, responsible for lymphocyte recruitment to HCC [15]. TNF-α is a key cytokine involved in inflammation, immunity, cellular homeostasis and tumour progression [16, 17], mainly produced by tumour cells and macrophages, but also by others [18]. The IL-8 gene expression is regulated by transcriptional activation of NF-κB, activation of the ERK, p38 mitogen-activated protein kinase (MAPK) and PI3K pathway [19, 20]. This study hypothesized that HCC per se could play the critical role in production of IL-8 through which HCC may dominate the development of inflammatory micro-environment. We evaluated potential mechanism of HCC-produced IL-8 production and regulation in HCC. Our results demonstrate that TNF-α could induce the production of IL-8 from HCC cells, through the activation of NF-κB, p38, ERK, PI3K and CCR3 signalling pathways, of which the p38 was a critical factor to activate the NF-κB.
Materials and methods
Reagents
TNF-α, CCR1, CCR2 and CCR3 inhibitors RS504393, UCB35625, SB328437 were purchased from Tocris Bioscience (Ellisville, MO, USA). Anti-p44/p42 MAPK, anti–phospho-p44/p42 MAPK (Thr202/Tyr204), anti-p38 MAPK, anti–phospho-p38 MAPK (Thr180/Tyr182), Akt antibody and phospho-Akt (pSer473) antibody, p65 antibody were from Cell Signaling Technology (Boston, MA, USA). The p38 MAPK inhibitor SB203580, ERK-1/2 inhibitor PD98059, PI3K inhibitor LY294002 and Wortmannin were obtained from Calbiochem (Darmstadt, Germany). Human HCC cell-line with high metastatic potential (MHCC-97H) was established at the Liver Cancer Institute, Fudan University, Shanghai, China [21], and maintained in Dulbecco’s Modified Eagle Medium with 10% foetal bovine serum (FBS, Hyclone), 2 mM l-glutamine, 50 units/ml penicillin and 50 mg/ml streptomycin.
Evaluation of NF-κB DNA binding activity
The nuclear cell extracts and DNA-binding activity of NF-κB in MHCC-97H cells were prepared according to the introduction from Active Motif (Carlsbad, CA, USA). Briefly, MHCC-97H cells were cultured with or without SB203580 (30 μM) for 1 hr, and then treated with or without TNF-α (1 ng/ml) for 1 hr. At then, the cells were washed, collected in ice-cold PBS with phosphate inhibitors and centrifuged at 500 rpm for 5 min. The pellets were then resuspended, treated with detergent and centrifuged at 14,000 × g for 30 sec. After the collection of cytoplasmic fraction, the nuclei were lysed and nuclear proteins were harvested from the lysing buffer with the protease inhibitor cocktail. The binding of NF-κB to DNA was measured in nuclear extracts with a specific TransAMTM NF-κB p65 assay kit.
Western blot
Protein samples (50 μg) were mixed with an equal volume of 2 × SDS sample buffer, boiled for 5 min., and then separated through 8–15% SDS-PAGE gels. After electrophoresis, proteins were transferred to nylon membranes by electrophoretic transfer. Membranes were blocked in 5% dry milk (1 hr), rinsed and incubated with primary antibodies (diluted at 1:500 or 1:1000) in TBS at 4°C overnight. Primary antibody was then removed by washing in TBS thrice, and labelled by incubating with 0.1 mg/ml peroxidase-labelled secondary antibodies (against mouse and rabbit) for 1 hr. Following three washes in TBS, bands were visualized by electrochemiluminescence (ECL) and exposed to X-ray film.
Measurements of IL-8 production
IL-8 in cell supernatants was determined using ELISAs in accordance with the protocol provided by the manufacturer. Briefly, primary antibody was placed on plates and incubated at room temperature overnight. Samples and standards were added and incubated for 2 hrs, the plates were washed, and a biotinylated secondary antibody was added and incubated for 2 hrs. After a further wash, tetramethylbenzidine was added for colour development, and the reaction was terminated with 2M H2SO4. Absorbance was measured at 450 nm.
Immunofluorescence assay
Cells were fixed with 4% paraformaldehyde (PFA) for 30 min., and permeabilized with wash buffer (0.5% Triton X-100, 0.01% sodium azide in PBS). Cells were blocked with 1% bovine serum albumin for 30 min. and incubated in primary antibodies for 1 hr. After washing, cells were incubated with secondary antibody anti-Cy3–conjugated IgG. Following washing, slips were placed with mounting medium and scanned with an Olympus confocal microscope and fluorescence microscope. The image enhancement was performed by using ImageJ 1.43.
Measurements of cell bio-behaviours
Cell proliferation was determined by methyl-thiazolyl-tetrazolium (MTT) assay. Briefly, about 4 × 10³ cells per well were plated on 96-well plates. After 6 hrs, cells were treated with LY294002 (5 μM), Wortmannin (5 μM), SB203580 (5 μM) and PD98059 (5 μM) with or without TNF-α (1 ng/ml) for 24 hrs. Ten microlitres of MTT was then added and the absorbance was read at 490(570) nm in a microplate reader. All assays were performed in triplicate and were repeated three times.
The cell bio-behaviours including total cell number, cell differentiation, stable and death cells were measured by the real-time cell-monitoring system, using a Cell-IQ cell culturing platform (Chip-Man Technologies, Tampere, Finland), equipped with a phase-contrast microscope (Nikon CFI Achromat phase contrast objective with 10 × magnification) and a camera. The equipment was controlled by Imagen software (Chip-Man Technologies). Images were captured at 5 min. intervals for 24 hrs. Analysis was carried out with a freely distributed Image software (McMaster Biophotonics Facility, Hamilton, ON, Canada), using the Manual Tracking plugin created by Fabrice Cordeliéres (Institut Curie, Orsay, France).
Statistical analysis
All results were expressed as mean ± S.E.M. Statistical significance was compared between groups by the Student’s t-test, after ANOVA analyses. Percentage of inhibition was calculated as the following: Inhibition% = [(average of vehicle-treated and TNF-α–challenged group − average of vehicle-treated group) − (average of inhibitor-treated and TNF-α–challenged group − average of vehicle-treated group)]/(average of vehicle-treated and TNF-α–challenged group − average of vehicle-treated group) × 100. Increased rate of total cell number, stable cell number, differentiated cell number and dead cell number were calculated as the following: Rate (%) = (value at each time point − value of primary seeding cells)/value of primary seeding cells × 100. Each experiment was repeated at least thrice and values with P < 0.05 were considered significant.
Results
TNF-α–induced IL-8 production
The effect of TNF-α on IL-8 production was evaluated in three studies, including duration effects, dose-related effects and every 6-hr effects. MHCC-97H cells were stimulated with TNF-α at the concentrations of 1, 5 and 10 ng/ml for 6 and 24 hrs. The levels of IL-8 in the supernatant from MHCC-97H cells significantly increased at all doses of TNF-α at post-TNF 6 and 24 hrs, whereas the levels of IL-8 at 24 hrs were significantly higher than that at 6 hrs (Fig. 1A). A dose-dependent effect of TNF-α on IL-8 production was noted when the levels of IL-8 were measured 24 hrs after the challenge with or without TNF-α. The duration effects of TNF-α at the dose of 1 ng/ml on IL-8 production were evaluated interval 3 hrs within 24 hrs. Figure 1B demonstrated that TNF-α–stimulated IL-8 production from HCC in a time-dependent pattern (P < 0.05 or 0.01, respectively), when the accumulate levels of IL-8 were measured. Six-hour effects of TNF-α on IL-8 production from HCC were evaluated by measuring IL-8 concentrations every 6 hrs after the culture medium was fully replaced with the fresh medium with TNF-α at the dose of 1 ng/ml. The peak of TNF-α–induced IL-8 production was at the first 6 hrs and decreased by time, although levels of IL-8 were significantly higher within 24 hrs after stimulation of TNF-α (Fig. 1C).
Fig 1.
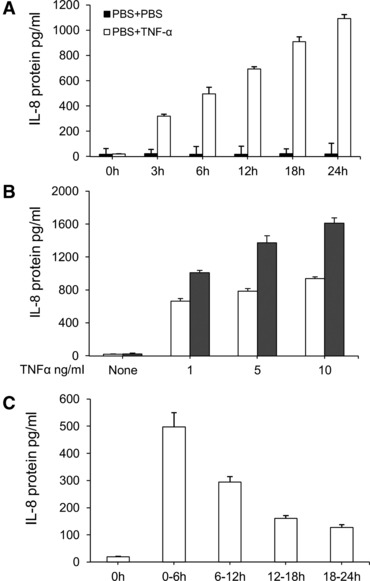
TNF-α–induced overproduction of IL-8 in HCCs. (A) The levels of IL-8 in the supernatant harvested from HCCs challenged with PBS (None) or TNF-α at doses of 1, 5 and 10 ng/ml at 6 and 24 hrs. (B) The levels of IL-8 in the supernatant harvested from HCCs challenged with PBS or TNF-α at the dose of 1 ng/ml at 3, 6, 12, 18 and 24 hrs, respectively. Fifty ml of the supernatant was harvested and the same volume was added to measure the accumulative production of IL-8. (C) The levels of IL-8 in the supernatant harvested from HCCs challenged with PBS or TNF-α at the dose of 1 ng/ml during the period of 0–6, 6–12, 12–18 and 18–24 hrs. During every 6-hr period, the full supernatant was harvested and the same volume of fresh solution were added to evaluate every 6-hr production of IL-8.
The role of p38 MAPK, ERK1/2 and Akt activation
Although TNF-α stimulates the activation of the PI3K and MAPK pathways in other cell types, it remains unclear if TNF-α could activate those signal pathways during the overproduction of IL-8 in MHCC-97H cells. Cells were cultured without serum for 24 hrs and treated with TNF-α at doses of 1, 5 and 10 ng/ml for 1 hr. The phosphorylation of p38 MAPK (Fig. 2A) and Akt (Fig. 2B) increased after the stimulation of TNF-α at 5 and 10 ng/ml, whereas ERK1/2 phosphorylation increased from 1 ng/ml of TNF-α (Fig. 2C). Of them, the relative degree of P38 phosphorylation was higher than ERK1/2 and AKT, as shown in Figure 2.
Fig 2.
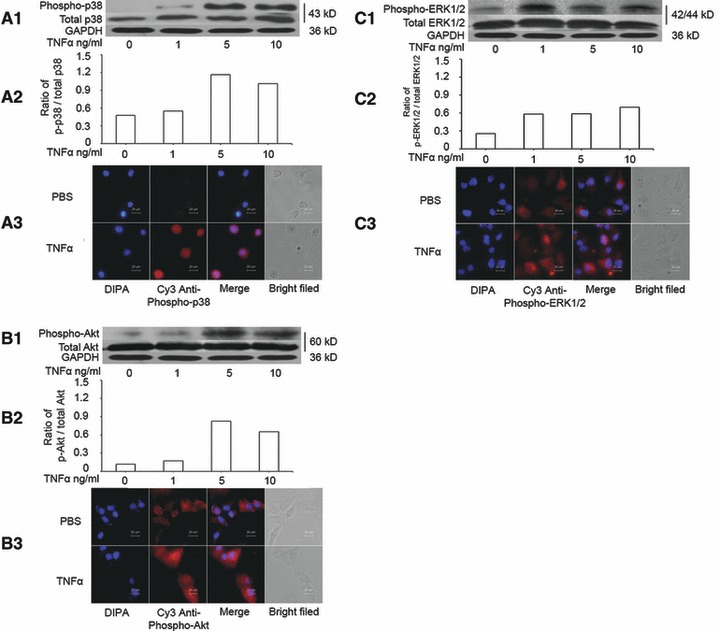
Activation of p38 MAPK, ERK1/2 and Akt induced by TNF-α. (A) The levels of total p38 MAPK and phosphorylated p38 MAPK (phospho-p38) measured by Western blot (A1), the average level of three identical experiments (n = 3 each, A2) and immunofluorescence staining of Phospho-p38 MAPK, including DIPA, Cys anti-phospho-p38, merge and bright field (A3). (B) The levels of total Akt and phosphorylated Akt (phospho-Akt) measured by Western blot (B1), the average level of three identical experiments (n = 3 each, B2) and immunofluorescence staining of Phospho-Akt, including DIPA, Cys anti-phospho-Akt, merge and bright field (B3). (C) The levels of total ERK1/2 and phosphorylated ERK1/2 (phospho-ERK1/2) measured by Western blot (C1), the average level of three identical experiments (n = 3 each, C2) and immunofluorescence staining of Phospho-ERK1/2, including DIPA, Cys anti-phospho-ERK1/2, merge and bright field (C3). Starved cells were challenged without (0) or with TNF-α at doses of 1, 5 and 10 ng/ml.
To further evaluate the role of those signal pathway in TNF-α–induced IL-8 production, the p38 MAPK inhibitor (SB203580), ERK-1/2 inhibitor (PD98059), PI3K inhibitor (LY294002 and Wortmannin) were selected and pre-incubated with MHCC-97H cells for 1 hr, followed by the stimulation with TNF-α at 1 ng/ml for 24 hrs. The treatment with SB203580, LY94002 and Wortmannin at 5 and 15 μM significantly prevented TNF-α–induced IL-8 production in a dose-dependent pattern, as shown in Figure 3 (P < 0.01, respectively, as controls). The PD98059 at 5 and 15 μM had the similar effects on the inhibition of IL-8 production (P < 0.01 versus controls). The percentage of inhibitory effects of SB203580 at 5 and 15 μM was 40% and 86%, LY94002 45% and 90%, Wortmannin 30% and 72%, and PD98059 39% and 45%, respectively.
Fig 3.
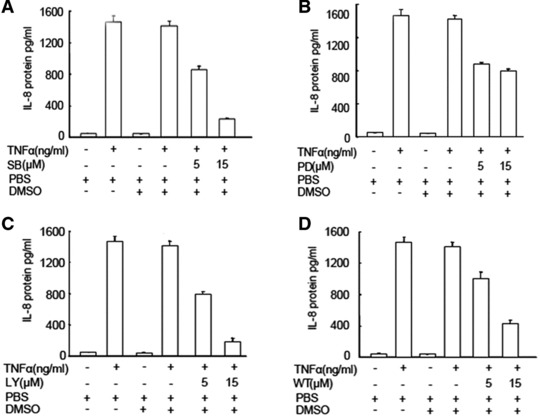
Effects of p38, ERK1/2 and PI3K inhibitors on TNF-α–induced IL-8 production. The levels of IL-8 in the supernatant were measured in HCCs pre-treated with SB203580 (SB, A), LY294002 (LY, B), PD98059 (PD, C) and Watmannin (Wt, D) at doses of 5 and 15 μM for 1 hr followed by the challenge with PBS or TNF-α at the dose of 1 ng/ml for 24 hrs.
CC chemokine receptors role in TNF-α-induced IL-8 production
To investigate the potential involvement of CC Chemokine Receptors (CCRs) in TNF-α–induced IL-8 production, the cells were incubated with CCR1, CCR2 and CCR3 inhibitors (10 ng/ml) for 1 hr, followed by the challenge with TNF-α at 1 ng/ml for 24 hrs. Of those, CCR3 inhibitor SB328437 significantly prevented TNF-α–induced IL-8 production by 40%, as compared with cells pre-treated with vehicle, although still higher than controls (P < 0.01, respectively, Fig. 4A). Furthermore, three doses of CCR3 inhibitor at 2.64 nM (1 ng/ml), 13.21 nM (5 ng/ml) and 26.42 nM (10 ng/ml) were used and prevented TNF-α–induced IL-8 production in a dose-related pattern, of which the inhibitory effects were 24%, 30% and 46%, respectively, but still significantly higher than controls (P < 0.01, respectively, Fig. 4B).
Fig 4.
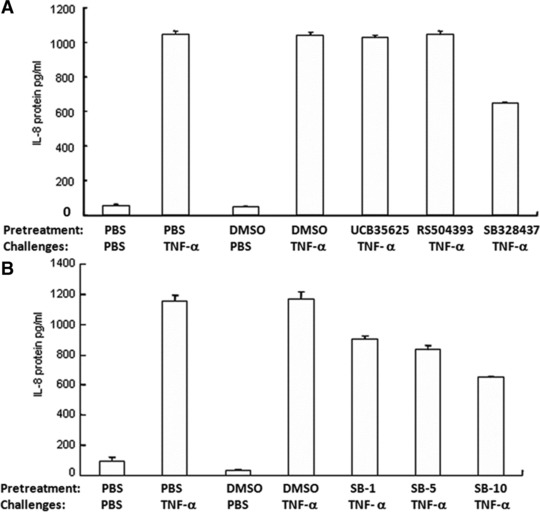
Effects of CCRs inhibitors on TNF-α–induced IL-8 production. (A) The levels of IL-8 were measured in the supernatant of HCCs pre-treated with CCR1, CCR2 and CCR3 inhibitors, UCB35625, RS504393 and SB328437, respectively, at the dose of 15.26 nM (10 ng/ml), 23.95 nM (10 ng/ml) and 26.424 nM (10 ng/ml) for 1 hr followed by the challenge with TNF-α at the dose of 1 ng/ml for 24 hrs. (B) The levels of IL-8 were measured in the supernatant of HCCs pre-treated with CCR3 inhibitor SB328437 at doses of 2.64 nM (1 ng/ml), 13.21 nM (5 ng/ml) and 26.42 nM (10 ng/ml) for 1 hr followed by the challenge with PBS or TNF-α at the dose of 1 ng/ml for 24 hrs.
The involvement of p38 in TNF-α–induced IL-8 production through NF-κB activation
We found that TNF-α at doses of 1, 5 and 10 ng/ml significantly increased the total amount of p65 proteins of NF-κB in a dose-dependent pattern (P < 0.01 versus Controls, respectively, Fig. 5A). When the cells were pre-treated with SB203580 at doses of 5, 15 and 30 μM for 1 hr and challenged with TNF-α at the dose of 1 ng/ml, SB203580 at 30 μM showed significantly inhibitory effects, as compared to the group pre-treated with vehicle (P < 0.01), while still higher than controls (P < 0.01, Fig. 5B). Immunohistological staining showed that the nuclear localization of NF-κB (p65) protein was increased by TNF-α (Fig. 5C), which was prevented by the pre-treatment with SB203580.
Fig 5.
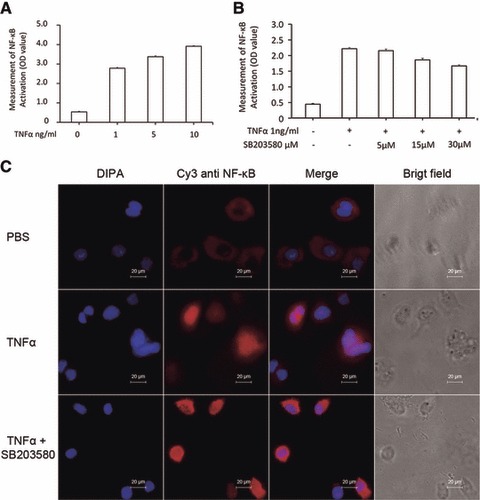
Effects of p38 inhibitor on TNF-α–induced activation of NF-κB. (A) The p65 activation (Optimal Density, OD) of NF-κB was measured in the nuclei of HCCs challenged with PBS or TNF-α at doses of 1, 5 and 10 ng/ml for 1 hr. (B) The p65 activation (OD) of NF-κB was measured in the nuclei of HCCs pre-treated with SB203580 at 5, 15 and 30 μM for 1 hr and challenged with PBS or TNF-α at the dose of 1 ng/ml for 1 hr. (C) Immunofluorescence staining of NF-κB p65 protein in HCCs pre-treated without or with SB203580 30 μM for 1 hr and challenged with PBS or TNF-α at the dose of 1 ng/ml for 1 hr.
Influence in cell proliferation
The cell proliferation measured by MTT significantly decreased about 40–55% as compared with controls, 24 hrs after cells were cultured with TNF-α at 1 ng/ml, LY294002, Wortmmanin, SB203580 and PD98059 at 5 μM, separately (P < 0.01, respectively, Fig. S1). The cell proliferation was also measured when cells were pre-treated with LY294002, Wortmmanin, SB203580 and PD98059 at 1 and 5 μM for 1 hr, respectively, and challenged with TNF-α at 1 ng for 24 hrs (Fig. 6A). The cell proliferation was decreased in a dose-dependent pattern, for example 57% and 95% at LY294002 (Fig. 6B), 66% and 96% at Wortmmanin (Fig. 6C), 52% and 70% at SB203580 (Fig. 6D) and 68% and 83% at PD98059 (Fig. 6E), respectively. Pre-treatment with those inhibitors at 5 μM and challenge with TNF-α significantly decreased the cell proliferation, as compared with the pre-treatment with vehicle and challenge with TNF-α (P < 0.05 or 0.01, respectively).
Fig 6.
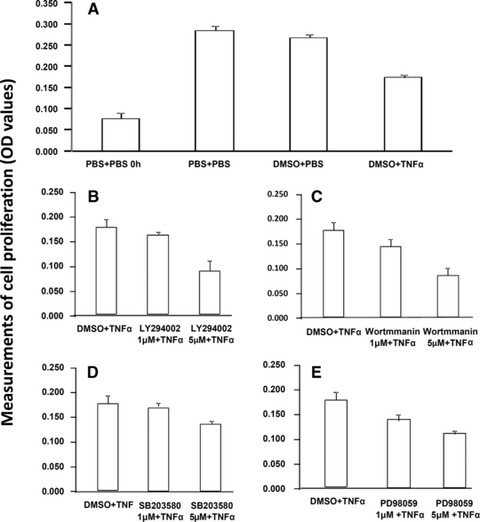
Effect of TNF-α, PI3K/Akt, P38 MAPK and ERK1/2 inhibitors on cell proliferation. Cell proliferation was measured MTT 24 hrs after cells were pre-treated with vehicle (A), LY294002 (B), Wortmannin (C), SB203580 (D) and PD98059 (E) at 1 and 5 μM for 1 hr, respectively, followed by the challenge with TNF-α at 1 ng/ml.
Dynamic alternations of total, stable, differentiated and dead cell number were measured and recorded every 5 min. for 24 hrs after a 24 hrs pre-treatment with those inhibitors at 5 μM and TNF-α at 1 ng/ml, respectively, or 1 hr pre-treatment with those inhibitors 5 μM followed by the challenge with TNF-α at 1 ng/ml. The increased rate of total cell number was significantly higher at SB203580 alone and lower at PD98059 alone as compared with controls, whereas the decreased rate of differentiated cell number was conversed (P < 0.05 or 0.01, respectively, in Fig. S2). The increased rate of dead cell number in control was significantly higher than that with TNF-α or inhibitors, of which the group with LY294002 had significantly higher rate than that with TNF-α, Wortmmanin, SB203580 or PD98059 (Fig. 7). The increased rate of total cell number in groups with TNF-α and LY294002 or TNF-α and SB203580 was significantly higher than that in controls or TNF-α alone (P < 0.05 or 0.01, respectively), whereas the decreased rate of differentiated cell number showed opposite. The increased rates of stable or dead cell number in groups with TNF-α alone or TNF-α and PD98059 were higher. IL-8 induced a significant increase of cell proliferation at 48 and 72 hrs (Fig. S3), whereas TNF-α reduced cells proliferation from 24 hrs (Fig. S4).
Fig 7.
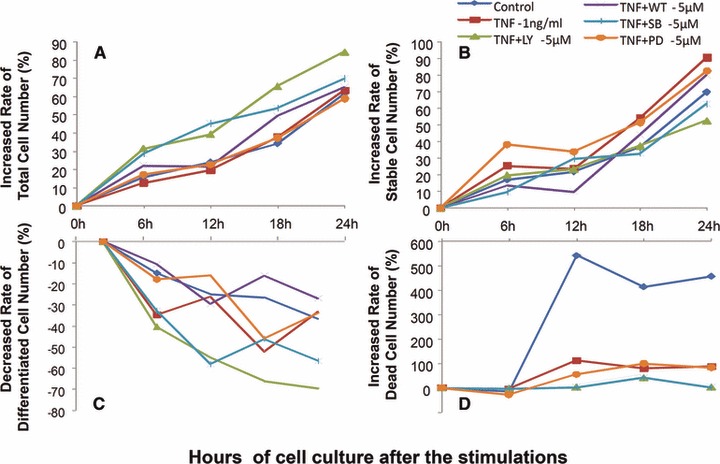
Bio-behaviours of hepatocellular cancer cells. Dynamic alterations in increased rate (%) of total cell number (A), stable cell number (B) and dead cell number (D) and decreased rate (%) of differentiated cell number (D) were measured by the real-time cell monitoring system, every 5 min. with 24 hrs after a 24 hrs culture of MHCC-97H cells pre-treated with vehicle (control), LY294002 (LY-5 μM), Wortmannin (WT-5 μM), SB203580 (SB-5 μM) and PD98059 (PD-5 μM) alone at the dose of 5 μM for 1 hr followed by the challenge with PBS or TNF-α at the dose of 1 ng/ml (TNF-α-1 ng/ml).
Discussion
This study initiated a concept that the human HCC cells per se play an important role in the formation of the micro-environmental inflammation, which was seen in many other types of cancer [22]. TNF-α was suggested to act as a master switch in establishing an intricate link between inflammation and cancer. Constitutive production of TNF-α from the tumour micro-environment is a characteristic of many malignant tumours [23, 24] and associated with poor prognosis. TNF-α could directly facilitate the tumour growth by regulating the proliferation and survival of tumour cells and/or indirectly by stimulating endothelial cells and other inflammatory cells presented at the tumour micro-environment [23]. Our results demonstrated that TNF-α could play an initial role in the development of the tumour micro-environmental inflammation, directly by stimulating HCCs.
IL-8 plays an initial and important role in leucocyte recruitment and cancer angiogenesis, migration and metastasis in tumour micro-environment [11, 25, 26]. IL-8 expression was found to be regulated by TNF-α in other tumours [27-29], although this study showed the direct evidence that TNF-α could stimulate the overproduction of IL-8 from HCCs. We found that TNF-α–induced IL-8 production through the activation of MAP kinase pathway like other cells [18, 28-30]. Our data demonstrated that the intracellular activation of p38, ERK1/2 and PI3K/Akt pathways was involved in the mechanism by which TNF-α induced the overproduction of IL-8. Of them, it seemed that p38 and PI3K signal pathways might play more dominate role, because the blockage of them could inhibit about 90% of TNF-α–induced IL-8 production. The transcription factor NF-κB is critical in the regulation of immune and inflammatory responses [20, 31], and p38MAPK is required for NF-κB–dependent gene expression [20, 32-34]. We found that translocation and activation of NF-κB increased after the challenge with TNF-α, which could be partially prevented by p38MAPK inhibitor.
LY 294002 is a potent and reversible inhibitor of PI3k activity by inhibiting ATP binding site of the enzyme and casein kinase II. Wortmannin is a specific, covalent and irreversible inhibitor of the classes I, II and III PI3K members, and other PI3K-related enzymes such as mTOR, DNA-PK, some phosphatidylinositol 4-kinases, myosin light chain kinase and MAPK at high concentrations [35]. We found that PI3K could play the critical role in the TNF-α–induced IL-8 production in HCCs, demonstrated by the inhibitory effects of two PI3K inhibitors. In this particular case, LY294002 showed more effective in the inhibition of TNF-α–induced IL-8 production, about 20% higher than Wortmannin. Previous studies demonstrated that the activation of PI3K/Akt was required for IL-8 production [36, 37], although the exact mechanism remains unclear. There may be a correlation of IL-8 inhibition and target-kinase inhibition, if all kinase activities and/or phosphorylation were also measured. We have simultaneously measured IL-8 production and targeting kinase activities in lung cancer cells stimulated with EGF and with or without those inhibitors [38]. There was no clear correlation between them, indicating partial effects of individual targeting kinase in tumour cell IL-8 production. Our data showed that Erk phsphorylation was significantly stimulated by TNF-α at a dose of 1 ng/ml rather than those of p38 and Akt. It indicates that the Erk pathway in HCC may be one of main signal routes.
The CC chemokines generally attract leucocytes, including monocytes, macrophages, T cells, B cells, basophiles, eosinophils, dendritic cells, mast cells and nature killer cells, to sites of the inflammation [39]. Of CCR1, CCR2 and CCR3, our data showed that CCR3 was involved in TNF-α–induced IL-8 production, although the mechanism is still poorly understood. CCR3 binds and responds to a variety of chemokines, including eotaxin, eotaxin-3, monocyte chemoattractive protein-3 and -4 and RANTES (regulated-on-activation, normal T cell expressed and secreted). CCR3 was known as a principal mediator of eosinophil chemotaxis and is expressed on a variety of inflammatory cells associated with allergic responses, including basophiles, mast cells, T-helper-2 lymphocytes and resident tissue cells such as airway epithelium [7, 8, 40]. It was found that the robust expression of CCR3 on primary hepatocytes by using semi-quantitative PCR and virus-induced IL-8 production might be mediated through p38 MAP kinase and SH2 domain-containing protein-tyrosine phosphatase in an NF-κB-independent manner, while through the transcription factor AP-1–driven processes [41]. Our previous studies demonstrated that LPS increased the expression of CCR3 on airway epithelial cells and IL-8 production, which was prevented by the CCR3 inhibitor [42]. CCR3 downstream signalling was proposed to be involved in the activation of PI3K, ERK and p38 signalling pathways [43-45]. We found that CCR3 rather than CCR1 and CCR2 were involved in TNF-α–induced IL-8 production in HCCs in a dose-dependent pattern. We believe that there might be a cross-talking between CCR3 and TNF-α receptors. It is also possible that TNF-α–induced IL-8 through the activation of CCR3. The signal pathway of NF-κB-p38-ERK-PI3K is a common one responsible for intracellular signalling. We found that those might play a critical and dependent role in the regulation of IL-8 production, of which some were partially involved in the signal such as ERK1/2. This is the first time to show the potential of cross talking between TNF receptor (TNFR) and CCRs. We should clarify the communication and interaction between TNFR and CCRs within the cell, the biological behaviour of TNFR in the lack of CCRs and the phosphorylation of kinases to investigate the potential mechanism behind in our future studies.
TNF-α was first identified as an anti-tumour cytokine accompanied by serious toxicity involving in the innate and adaptive immune system. Recent studies demonstrated that TNF-α–induced proliferation of tumour cells (e.g. C4HD and T47D cells) through the activation of p42/p44 MAPK, JNK, PI3-K/Akt pathways and NF-κB transcriptional activation [46]. However, TNF-α has the apparently paradoxical effect on tumour growth, for example high doses of TNF-α could induce haemorrhagic tumour necrosis, whereas low dose, chronic TNF-α has angiogenic activity of total, stable, differentiated and dead cells. However, our results indicate that TNF-α–induced overproduction of IL-8 may be hardly associated with the cell proliferation, because the production of IL-8 increased by more than 1000% after the cell was challenged with TNF-α, whereas the cell proliferation rate decreased by 50%, as compared with controls. We found IL-8 per se stimulated HCC proliferation in a dose-dependent pattern.
In addition to the role of TNF-α, it is also important to remember that other potential factors derived from HCC might be also involved in and/or influence on the development of micro-environmental inflammation in liver tumour. Data of cell bio-behaviours measured in Cell-IQ showed that each factor or inhibitor stimulated the cells alone and furthermore TNF-α with its vehicle and inhibitors stimulated the cells. The results show different effects provided by inhibitors, with or without TNF-α, indicating that the inhibitors could influence the cells in a variety of different ways depending on the actual cell status. However, our studies are just the mechanism-oriented one, so more investigations on the optimal effect dose and minimum toxicity as well as other potentials should be considered and explored. There is a potential that the doses per se used might not be high enough to get maximum effect in this study.
In conclusion, we found that TNF-α could directly induce the overproduction of IL-8 and an increased translocation NF-κB in HCCs. The inhibition of p38 MAPK, ERK and PI3K/Akt signalling pathways and CCR3 receptor could prevent from TNF-α–induced IL-8 production. Our data indicate that TNF-α from either HCCs per se or micro-environmental leucocytes may stimulate tumour cells to produce IL-8 which might chemoattract and recruit the influx of circulating leucocytes. Those infiltrated leucocytes and/or HCCs may interact together, leading to the secondary production of inflammatory mediators and the formation of inflammatory environment as summarized in Figure 8. Inhibition of HCCs-driven inflammation may be a new potential and therapeutic strategy for liver cancer.
Fig 8.
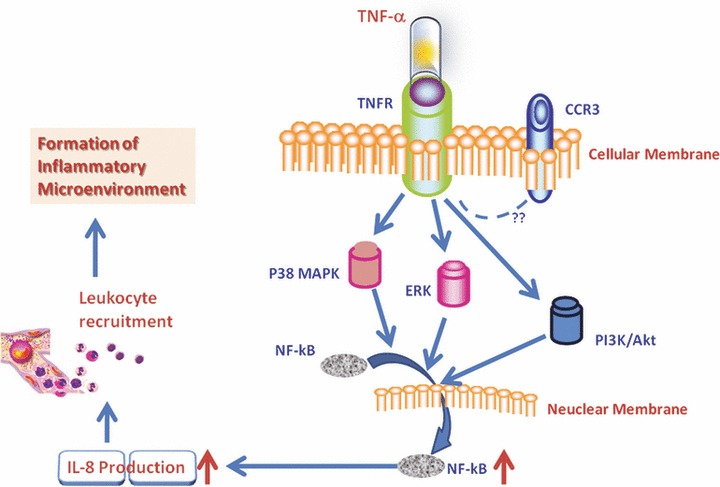
Hypothesis of TNF-α–induced IL-8 production in HCCs. TNF-α from either HCCs per se or micro-environmental leucocytes may stimulate tumour cells through TNFR to produce IL-8, probably through p38, ERK1/2 and PI3K which activated the translocation of NF-κB into the nuclei. HCCs-driven IL-8 overproduction could chemo-attract and recruit the influx of circulating leucocytes to the tumour tissue. Those infiltrated leucocytes and/or HCCs may interact together, leading to the secondary production of inflammatory mediators and the formation of inflammatory environment.
Acknowledgments
The work was supported by Shanghai Leading Academic Discipline Project (Project Number: B115), Fudan University (Distinguished Professor Grant) and Shanghai Science & Technology Committee (08PJ1402900, 9540702600, 08DZ2293104). The authors thank Drs Jiefeng Cui, Yaoli Wang and Xun Wang for their excellent technical and secretarial assistance.
Conflict of interest
All authors have no conflict of interest statement.
Authors’ contributions
Yaohui Wang: make study plan, perform studies and data analyses, as well as writing paper.
Weimin Wang: perform immunostaining and measure kinase activities.
Lingyan Wang: perform studies on Cell-IQ.
Xiangdong Wang and Jinglin Xia: make study plan and write the manuscript.
Supporting Information
Effect of TNF-α, PI3K/Akt, P38 MAPK andERK1/2 inhibitors alone on cell proliferation.
Dynamic alterations in increased rate (%) oftotal cell number (A), stable cell number (B) anddead cell number (D) and decreased rate (%) ofdifferentiated cell number (D) were measured by thereal-time cell monitoring system, every 5 min. with 24 hrs after a24 hrs culture of MHCC-97H cells pre-treated with vehicle(control), LY294002 (LY-5 μM), Wortmannin (WT-5 μM), SB203580(SB-5 μM) and PD98059 (PD-5μM) alone at the dose of 5 μMor TNF-α at the dose of 1 ng/ml (TNF-1 ng), respectively.
Effect of interleukin (IL)-8 on cell proliferation.
Effect of TNF-α on HCC cells proliferation.
References
- 1.Coussens LM, Werb Z. Inflammation and cancer. Nature. 2002;420:860–7. doi: 10.1038/nature01322. [DOI] [PMC free article] [PubMed] [Google Scholar]
- 2.Parkin DM, Bray F, Ferlay J, et al. Global cancer statistics, 2002. Ca-a Cancer J Clin. 2005;55:74–108. doi: 10.3322/canjclin.55.2.74. [DOI] [PubMed] [Google Scholar]
- 3.Budhu A, Wang XW. The role of cytokines in hepatocellular carcinoma. J Leukoc Biol. 2006;80:1197–213. doi: 10.1189/jlb.0506297. [DOI] [PubMed] [Google Scholar]
- 4.Rollins BJ. Inflammatory chemokines in cancer growth and progression. Eur J Cancer. 2006;42:760–7. doi: 10.1016/j.ejca.2006.01.002. [DOI] [PubMed] [Google Scholar]
- 5.Koizumi K, Hojo S, Akashi T, et al. Chemokine receptors in cancer metastasis and cancer cell-derived chemokines in host immune response. Cancer Sci. 2007;98:1652–8. doi: 10.1111/j.1349-7006.2007.00606.x. [DOI] [PMC free article] [PubMed] [Google Scholar]
- 6.Muller-Hubenthal B, Azemar M, Lorenzen D, et al. Tumour biology: tumour-associated inflammation versus antitumour immunity. Anticancer Res. 2009;29:4795–805. [PubMed] [Google Scholar]
- 7.Kim CH. Chemokine-chemokine receptor network in immune cell trafficking. Curr Drug Targets Immune Endocr Metabol Disord. 2004;4:343–61. doi: 10.2174/1568008043339712. [DOI] [PubMed] [Google Scholar]
- 8.Lazennec G, Richmond A. Chemokines and chemokine receptors: new insights into cancer-related inflammation. Trends Mol Med. 2010;16:133–44. doi: 10.1016/j.molmed.2010.01.003. [DOI] [PMC free article] [PubMed] [Google Scholar]
- 9.Yuan A, Chen JJ, Yao PL, et al. The role of interleukin-8 in cancer cells and microenvironment interaction. Front Biosci. 2005;10:853–65. doi: 10.2741/1579. [DOI] [PubMed] [Google Scholar]
- 10.Olson TS, Ley K. Chemokines and chemokine receptors in leukocyte trafficking. Am J Physiol Regul Integr Comp Physiol. 2002;283:R7–28. doi: 10.1152/ajpregu.00738.2001. [DOI] [PubMed] [Google Scholar]
- 11.Xie K. Interleukin-8 and human cancer biology. Cytokine Growth Factor Rev. 2001;12:375–91. doi: 10.1016/s1359-6101(01)00016-8. [DOI] [PubMed] [Google Scholar]
- 12.Harimoto N, Shirabe K, Abe T, et al. Interleukin-8 producing hepatocellular carcinoma with pyrexia. HPB Surg. 2009;2009:461–92. doi: 10.1155/2009/461492. [DOI] [PMC free article] [PubMed] [Google Scholar]
- 13.Kubo F, Ueno S, Hiwatashi K, et al. Interleukin 8 in human hepatocellular carcinoma correlates with cancer cell invasion of vessels but not with tumour angiogenesis. Ann Surg Oncol. 2005;12:800–7. doi: 10.1245/ASO.2005.07.015. [DOI] [PubMed] [Google Scholar]
- 14.Akiba J, Yano H, Ogasawara S, et al. Expression and function of interleukin-8 in human hepatocellular carcinoma. Int J Oncol. 2001;18:257–64. doi: 10.3892/ijo.18.2.257. [DOI] [PubMed] [Google Scholar]
- 15.Yoong KF, Afford SC, Jones R, et al. Expression and function of CXC and CC chemokines in human malignant liver tumours: a role for human monokine induced by γ-interferon in lymphocyte recruitment to hepatocellular carcinoma. Hepatology. 1999;30:100–11. doi: 10.1002/hep.510300147. [DOI] [PubMed] [Google Scholar]
- 16.Chen G, Goeddel DV. TNF-R1 signaling: a beautiful pathway. Science. 2002;296:1634–5. doi: 10.1126/science.1071924. [DOI] [PubMed] [Google Scholar]
- 17.Wu Y, Zhou BP. TNF-α/NF-κB/Snail pathway in cancer cell migration and invasion. Br J Cancer. 2010;102:639–44. doi: 10.1038/sj.bjc.6605530. [DOI] [PMC free article] [PubMed] [Google Scholar]
- 18.Wajant H, Pfizenmaier K, Scheurich P. tumour necrosis factor signaling. Cell Death Differ. 2003;10:45–65. doi: 10.1038/sj.cdd.4401189. [DOI] [PubMed] [Google Scholar]
- 19.Hoffmann E, Dittrich-Breiholz O, Holtmann H, et al. Multiple control of interleukin-8 gene expression. J Leukoc Biol. 2002;72:847–55. [PubMed] [Google Scholar]
- 20.Ghosh S, Hayden MS. New regulators of NF-κB in inflammation. Nat Rev Immunol. 2008;8:837–48. doi: 10.1038/nri2423. [DOI] [PubMed] [Google Scholar]
- 21.Tian F, Tang ZY, Ye SL, et al. New human hepatocellular carcinoma (HCC) cell line with highly metastatic potential (MHCC97) and its expressions of the factors associated with metastasis. Br J Cancer. 1999;81:814–21. doi: 10.1038/sj.bjc.6690769. [DOI] [PMC free article] [PubMed] [Google Scholar]
- 22.Mantovani A, Allavena P, Sica A, et al. Cancer-related inflammation. Nature. 2008;454:436–44. doi: 10.1038/nature07205. [DOI] [PubMed] [Google Scholar]
- 23.Balkwill F. Tumour necrosis factor and cancer. Nat Rev Cancer. 2009;9:361–71. doi: 10.1038/nrc2628. [DOI] [PubMed] [Google Scholar]
- 24.Sethi G, Sung B, Aggarwal BB. TNF: a master switch for inflammation to cancer. Front Biosci. 2008;13:5094–107. doi: 10.2741/3066. [DOI] [PubMed] [Google Scholar]
- 25.Sakamoto K, Masuda T, Mita S, et al. interleukin-8 is constitutively and commonly produced by various human carcinoma cell-lines. Int J Clin Lab Res. 1992;22:216–9. doi: 10.1007/BF02591427. [DOI] [PubMed] [Google Scholar]
- 26.Waugh DJ, Wilson C. The interleukin-8 pathway in cancer. Clin Cancer Res. 2008;14:6735–41. doi: 10.1158/1078-0432.CCR-07-4843. [DOI] [PubMed] [Google Scholar]
- 27.Xie KP. Interleukin-8 and human cancer biology. Cytokine Growth Factor Rev. 2001;12:375–91. doi: 10.1016/s1359-6101(01)00016-8. [DOI] [PubMed] [Google Scholar]
- 28.Li J, Kartha S, Iasvovskaia S, et al. Regulation of human airway epithelial cell IL-8 expression by MAP kinases. Am J Physiol Lung Cell Mol Physiol. 2002;283:L690–9. doi: 10.1152/ajplung.00060.2002. [DOI] [PubMed] [Google Scholar]
- 29.Lee HJ, Cho JW, Kim SC, et al. Roles of p38 and ERK MAP kinases in IL-8 expression in TNF-alpha- and dexamethasone-stimulated human periodontal ligament cells. Cytokine. 2006;35:67–76. doi: 10.1016/j.cyto.2006.07.009. [DOI] [PubMed] [Google Scholar]
- 30.Parhar K, Ray A, Steinbrecher U, et al. The p38 mitogen-activated protein kinase regulates interleukin-1beta-induced IL-8 expression via an effect on the IL-8 promoter in intestinal epithelial cells. Immunology. 2003;108:502–12. doi: 10.1046/j.1365-2567.2003.01603.x. [DOI] [PMC free article] [PubMed] [Google Scholar]
- 31.Wu H. Assembly of post-receptor signaling complexes for the tumour necrosis factor receptor superfamily. Adv Protein Chem. 2004;68:225–79. doi: 10.1016/S0065-3233(04)68007-7. [DOI] [PubMed] [Google Scholar]
- 32.Liu F, Feng G, Wang GL, Liu GJ. p38MAPK inhibition attenuates LPS-induced acute lung injury involvement of NF-kappaB pathway. Eur J Pharmacol. 2008;584:159–65. doi: 10.1016/j.ejphar.2008.02.009. [DOI] [PubMed] [Google Scholar]
- 33.Kaur J, Woodman RC, Kubes P. P38 MAPK: critical molecule in thrombin-induced NF-κB-dependent leukocyte recruitment. Am J Physiol Heart Circ Physiol. 2003;284:H1095–103. doi: 10.1152/ajpheart.00016.2002. [DOI] [PubMed] [Google Scholar]
- 34.Liu RY, Fan C, Liu G, et al. Activation of p38 mitogen-activated protein kinase is required for tumour necrosis factor-alpha-supported proliferation of leukemia and lymphoma cell lines. J Biol Chem. 2000;275:21086–93. doi: 10.1074/jbc.M001281200. [DOI] [PubMed] [Google Scholar]
- 35.Vanhaesebroeck B, Leevers SJ, Ahmadi K, et al. Synthesis and function of 3-phosphorylated inositol lipids. Annu Rev Biochem. 2001;70:535–602. doi: 10.1146/annurev.biochem.70.1.535. [DOI] [PubMed] [Google Scholar]
- 36.Fernandes AF, Bian Q, Jiang JK, et al. Proteasome inactivation promotes p38 mitogen-activated protein kinase-dependent phosphatidylinositol 3-kinase activation and increases interleukin-8 production in retinal pigment epithelial cells. Mol Biol Cell. 2009;20:3690–9. doi: 10.1091/mbc.E08-10-1068. [DOI] [PMC free article] [PubMed] [Google Scholar]
- 37.Kim KS, Rajagopal V, Gonsalves C, et al. A novel role of hypoxia-inducible factor in cobalt chloride- and hypoxia-mediated expression of IL-8 chemokine in human endothelial cells. J Immunol. 2006;177:7211–24. doi: 10.4049/jimmunol.177.10.7211. [DOI] [PubMed] [Google Scholar]
- 38.Mackay CR. Chemokines: immunology’s high impact factors. Nature Immunology. 2001;2:95–101. doi: 10.1038/84298. [DOI] [PubMed] [Google Scholar]
- 39.Zhang Y, Wang L, Zhang M, et al. Potential mechanism of interleukin-8 production from lung cancer cells: an involvement of EGF-EGFR-PI3K-Atk-Erk pathway. J Cell Physiol. 2011 doi: 10.1002/jcp.22722. ; doi: 10.1002/jcp.22722. [DOI] [PubMed] [Google Scholar]
- 40.Lloyd CM, Delaney T, Nguyen T, et al. CC chemokine receptor (CCR)3/eotaxin is followed by CCR4/monocyte-derived chemokine in mediating pulmonary T helper lymphocyte type 2 recruitment after serial antigen challenge in vivo. J Exp Med. 2000;191:265–74. doi: 10.1084/jem.191.2.265. [DOI] [PMC free article] [PubMed] [Google Scholar]
- 41.Balasubramanian A, Ganju RK, Groopman JE. Hepatitis C virus and HIV envelope proteins collaboratively mediate interleukin-8 secretion through activation of p38 MAP kinase and SHP2 in hepatocytes. J Biol Chem. 2003;278:35755–66. doi: 10.1074/jbc.M302889200. [DOI] [PubMed] [Google Scholar]
- 42.Li B, Dong C, Wang G, et al. Pulmonary epithelial CCR3 promotes LPS-induced lung inflammation by mediating release of IL-8. J Cell Physiol. 2010 doi: 10.1002/jcp.22577. ; doi: 10.1002/jcp.22577. [DOI] [PubMed] [Google Scholar]
- 43.Bandeira-Melo C, Phoofolo M, Weller PF. Extranuclear lipid bodies, elicited by CCR3-mediated signaling pathways, are the sites of chemokine-enhanced leukotriene C4 production in eosinophils and basophils. J Biol Chem. 2001;276:22779–87. doi: 10.1074/jbc.M101436200. [DOI] [PubMed] [Google Scholar]
- 44.Yamamura K, Adachi T, Masuda T, et al. Intracellular protein phosphorylation in eosinophils and the functional relevance in cytokine production. Int Arch Allergy Immunol. 2009;149:45–50. doi: 10.1159/000210653. [DOI] [PubMed] [Google Scholar]
- 45.Jamaluddin MS, Wang X, Wang H, et al. Eotaxin increases monolayer permeability of human coronary artery endothelial cells. Arterioscler Thromb Vasc Biol. 2009;29:2146–52. doi: 10.1161/ATVBAHA.109.194134. [DOI] [PMC free article] [PubMed] [Google Scholar]
- 46.Rivas MA, Carnevale RP, Proietti CJ, et al. TNF-α acting on TNFR1 promotes breast cancer growth via p42/P44 MAPK, JNK, Akt and NF-κB-dependent pathways. Exp Cell Res. 2008;314:509–29. doi: 10.1016/j.yexcr.2007.10.005. [DOI] [PubMed] [Google Scholar]
Associated Data
This section collects any data citations, data availability statements, or supplementary materials included in this article.
Supplementary Materials
Effect of TNF-α, PI3K/Akt, P38 MAPK andERK1/2 inhibitors alone on cell proliferation.
Dynamic alterations in increased rate (%) oftotal cell number (A), stable cell number (B) anddead cell number (D) and decreased rate (%) ofdifferentiated cell number (D) were measured by thereal-time cell monitoring system, every 5 min. with 24 hrs after a24 hrs culture of MHCC-97H cells pre-treated with vehicle(control), LY294002 (LY-5 μM), Wortmannin (WT-5 μM), SB203580(SB-5 μM) and PD98059 (PD-5μM) alone at the dose of 5 μMor TNF-α at the dose of 1 ng/ml (TNF-1 ng), respectively.
Effect of interleukin (IL)-8 on cell proliferation.
Effect of TNF-α on HCC cells proliferation.