

Abstract
Cathepsins are involved in a variety of physiological processes including antigen processing and presentation and extracellular matrix degradation. In the present study, we evaluated whether expression levels of cathepsins S and B and their inhibitors cystatins B and C are affected by multiple sclerosis (MS) disease state (relapse and remission) and therapies (interferon-β[IFN-β] and the glucocorticoid [GC] methylprednisolone), and whether they are associated with the IFN-β response phenotype. Real-time PCR was employed to compare RNA expression levels in peripheral blood leucocytes (PBLs) and ELISA to determine serum protein levels of MS patients and matched healthy individuals. Cathepsin S RNA was higher in MS patients in the relapse state compared to controls (by 74%, P= 3 × 10⁻⁵, n= 30 versus n= 18) with a similar increase observed in serum (66%, P= 0.002, n= 18 versus n= 20). GC treatment reduced cathepsin S levels in PBL RNA (by 44%, P= 6 × 10⁻⁶, n= 27) and serum proteins (by 27%, P= 1 × 10⁻⁵, n= 26), reduced the serum protein levels of pro-cathepsin B (by 8%, P= 0.0007, n= 23), and in parallel increased the serum levels of their inhibitor cystatin C (by 82%, P= 8 × 10⁻⁶, n= 26). IFN-β therapy significantly elevated the RNA levels (n= 16) of cathepsin B (by 16%, P= 0.03), cystatin B (44%, P= 0.004) and cystatin C (48%, P= 0.011). In the serum, only cathepsin S levels were reduced by IFN-β (16%, P= 0.006, n= 25). Interestingly, pre-treatment serum cathepsin S/cystatin C ratio was higher in ‘good responders’ to IFN-β therapy compared to patients without a good response (by 94%, P= 0.003). These results suggest that cathepsin S and cystatin C may contribute to disease activity in MS, specifically in a subgroup of patients that are responsive to IFN-β therapy, and that these proteins should be further evaluated as biomarkers in MS.
Keywords: biomarker, cystein protease, glucocorticoids, interferon-β, multiple sclerosis
Introduction
Multiple sclerosis (MS) is a central nervous system (CNS) disease characterized by inflammation, demyelination and neurodegeneration. Autoimmune activity directed against components of the myelin sheath is considered to be the major process underlying MS pathology [1, 2]. MS is a heterogeneous disease, which is characterized in most cases by an initial relapsing-remitting (RR) course, followed by gradual accumulation of disability.
The auto-reactive immune response, which includes processing and presentation of the self-antigen by the antigen-presenting cells, and the massive infiltration of activated leucocytes through the blood–brain barrier (BBB) into the CNS, are critical events in MS pathogenesis [2]. Proteolytic activity is involved in both these processes: in generation of myelin-derived epitopes and in degradation of the extracellular matrix (ECM) components, required for the extravazation process. In addition, as demonstrated for matrix metalloproteinases (MMPs), proteolytic activity also contributes to regulation of cytokine activity which is part of the inflammatory response and autoimmunity [3, 4]. MS treatments, such as glucocorticoids (GCs) and interferon-β (IFN-β), reduce BBB permeability, down-regulate the expression of proteins involved in antigen presentation [such as major histocompatibility complex (MHC) class II molecules] and down-regulate MMPs [5–9].
The cathepsin family of papain-like cysteine proteases is mainly involved in metabolic degradation of peptides and proteins in the lysosome [10]. In immune cells, cathepsins, such as cathepsins S and L, play a key role contributing to antigen presentation by the MHC class II molecules, thorough their role in processing of antigenic peptides, and their participation in the stepwise degradation of the invariant chain (Ii) [11–13]. Regulation of Ii levels by cathepsin S can also affect the migration of immune cells, such as dendritic cells [14]. The retained activity of some cathepsins at physiological PH [10], and their ability to degrade ECM components, such as laminin, fibronectin and collagen [15], may contribute to their effects on cell invasiveness and motility [16–18]. The involvement of cathepsins, particularly cathepsin B, in thymocyte and mature T-cell apoptosis is another path of activity by which cathepsins affect immune functions [19]. Accordingly, cathepsin activity has been implicated in a variety of immune-mediated disorders, such as experimental autoimmune myasthenia gravis [20], Sjögren syndrome [21, 22], atherosclerosis and rheumatoid arthritis [15, 23, 24].
Several observations suggest that cysteine cathepsins may also play a role in MS. Predominant autoantigens in MS, the myelin basic protein (MBP) and the myelin oligodendrocyte glycoprotein are targets for processing by cathepsin S in antigen-presenting cells [11, 25] and increased cathepsin B activity was observed in MS lesions, CSF and PBMCs [26–28]. Additional evidence from a study using an animal model of demyelination complements these findings by demonstrating the abnormal expression of several cathepsins and cystatins [29]. Finally, pharmacogenetics studies of our team and others identified single nucleotide polymorphisms within the CTSS gene (encoding cathepsin S) that were associated with the clinical response to the approved immunotherapies for relapsing MS – glatiramer acetate [30] and IFN-β[31].
The present study aimed to characterize the expression pattern of cathepsin S, cathepsin B and their inhibitors cystatins C and B (encoded by the CTSS, CTSB, CSTC and CSTB genes, respectively) in leucocytes and serum of MS patients in different disease states, and in comparison to healthy controls. An additional aim was to assess the effect of IFN-β, used as a disease-modifying drug, and of the immunosuppressive GC therapy, used for treatment of acute MS relapses, on these proteolytic enzymes.
Materials and methods
Study population
Patients with clinically and laboratory definite RR MS according to McDonald’s criteria [32] (n= 73), and healthy controls (n= 23), were recruited at the MS Center at Carmel Medical Center, Haifa. The study was approved by the local Helsinki Ethics Committee of Carmel Medical Center, and all participants gave their written informed consent. Demographic and clinical data were recorded from all participants (Table 1). Blood samples were collected from treatment naïve (that had never received any immunomodulatory therapy for MS, e.g. IFN-β or glatiramer acetate) patients in remission prior to initiation of standard immunomodulatory treatment of IFN-β (IFN-β-1a or IFN-β-1b), and only if GC therapy was not used in the prior month (n= 29). A second blood sample was obtained from this group of patients following 3–6 month of IFN-β therapy. From patients presenting in a confirmed acute relapse (as defined in [5]), blood samples were obtained immediately prior to treatment with GCs, and on day 7 following initiation of intravenous GC therapy for duration of 6 days, as previously described [33]. The acute relapse group included two subgroups: treatment-naïve patients (n= 21) and patients under treatment with IFN-β at the time of relapse (n= 23). Control volunteers were healthy individuals without MS or other autoimmune or neurological disease, and without any known relatives (up to third degree) diagnosed with MS. Participants were excluded if infectious or inflammatory conditions were present at the time of recruitment.
Table 1.
Demographic and clinical characteristics of the study participants at enrolment
| Participant group | Gender F (%)/M | Age – years mean ± S.D. [range] | Disease Duration –years, mean ± S.D.; median [range] | EDSS* median [range] |
|---|---|---|---|---|
| RR-MS patients in relapse, under IFN-β therapy | 16 (70%)/7 | 35.8 ± 10.5 [21–57] | 3.8 ± 2.7; 3 [1–14] | 4.0 [1–7]† |
| RR-MS patients in relapse, without immunomodulatory therapy | 14 (67%)/7 | 30.5 ± 7.5‡[18–44] | 5.2 ± 5.2; 2 [0.4–17] | 2.5 [0–5]† |
| RR-MS patients in remission$ | 22 (76%)/7 | 38.9 ± 10.8 [19–57] | 6.0 ± 6.6; 5 [0–27] | 1.5 [0–6] |
| Healthy control individuals | 16 (70%)/7 | 35.4 ± 11.6 [20–59] |
EDSS: expanded disability status scale.
EDSS score at the remission period prior to the relapse. EDSS differed between IFN-β treated MS patients in relapse versus treatment-naïve MS patients in relapse (P= 0.03), and also between IFN-treated MS patients in relapse and patients in remission prior to treatment (P= 0.002).
The participants’ age is lower in the relapse group compared to the remission group (P= 0.03).
Data recorded prior to IFN-β treatment initiation.
Blood samples were processed for serum and leucocyte isolation for RNA preparation (described below). For some participants, only one type of biological specimen was available, either RNA or serum.
Patients treated with IFN-β were classified as ‘good responders’ if no relapses and no increase in their expanded disability status scale (EDSS) scores were recorded over the 2 years follow-up period since treatment initiation [34]. All other patients not matching the criteria for ‘good responders’ were grouped as ‘others’. Within the ‘others’ group, 7/11 had a relapse in the 2 year follow-up period and 8/11 had an increase in EDSS of ≥1.
Relative quantitative analysis of RNA expression
Peripheral blood leucocytes (PBLs) were prepared from blood samples and RNA extracted as previously described [5]. Following DNAse treatment (Ambion, Austin, TX, USA), cDNA synthesis was performed with Moloney murine leukemia virus (M-MLV) reverse transcriptase (Promega, Madison, WI, USA) with random hexamer primers (Amersham Biosciences, Piscataway, NJ, USA), according to the manufacturers’ protocols.
Relative RNA expression levels were evaluated by real-time PCR (RT-PCR) with TaqMan reagents and protocols on an ABI 7000 sequence detection system (Applied Biosystems, Austin, TX, USA). Primer-probe sets were obtained from Applied Biosystems. Glyceraldehyde 3-phosphate dehydrogenase (GADPH) was used as a reference gene. All reactions were performed in duplicates, analysed blindly to the sample origin. Relative mRNA expression was quantified by the comparative CT method [35]: The relative quantification value of target gene, normalized to the reference gene and relative to a calibrator (e.g. a sample from a patient prior to drug treatment), was expressed as 2−ΔΔCT where ΔCT=CT(test gene) – CT(reference gene). Expression levels of independent groups (e.g.: control and patient groups) were compared by the 2−ΔCT values of the target gene, a value that is proportional to the amount of RNA in the samples tested. Fold changes for comparison of independent groups were calculated as ratios of medians, and for paired data calculated as medians of fold changes.
Serum protein quantification
ELISA kits were used to evaluated serum proteins levels of pro-cathepsin B, total cathepsin S (R&D Systems, Minneapolis, MN, USA) and cystatin C (Alexis Corporation/Enzo Life Sciences, Lausen, Switzerland). All samples were analysed in duplicates.
Statistical analyses
Statistical analyses were performed with SPSS v. 15 (SPSS, Inc., Chicago, IL, USA). Continuous variables were tested for normality by the one sample Kolmogorov–Smirnov test. Baseline demographic and clinical variables were evaluated by anova or Kruskal–Wallis tests between participant groups, excepting gender which was compared using chi-square test. For independent group comparisons of RNA and serum levels (e.g. comparison between control and patient groups) we used the Kruskal–Wallis test, followed by the Mann-Whitney test with application of the Bonferroni correction for multiple testing. Analyses of the relapse group regarded IFN-β treatment as a co-variable, and where treatment effect was not significant, data of IFN-β-treated and treatment-naïve patients at relapse were pooled. The Wilcoxon signed rank two-tailed test was used to compare pre- and during-treatment values of RNA or serum protein levels, or changes in ratios of protease levels to inhibitor levels. Pre-treatment values of IFN-β response groups were evaluated by the Mann-Whitney test. The Spearman’s rank correlation was used to evaluate correlation between expression levels of the different RNAs or proteins. Outliers, where present, were always included in the analyses; however, we also evaluated the effect of excluding them to verify they did not change the significance of the tests performed. Receiver operating characteristic curve analysis was used to evaluate the classifying accuracy of serum protein levels or protein ratios for IFN-β response and to select optimal cut-off points for calculation of sensitivity and specificity. In every test, significant differences were inferred when P < 0.05.
Results
Patients and control groups (Table 1) were matched for gender and age. Age distribution was similar between participant groups except for patients that had not yet received any immunomodulatory treatment, where the relapse group had a lower average age compared to the remission group (P= 0.03). Disease duration was similar between patient groups. Disability (EDSS) was higher in the relapse group treated with IFN-β compared to the remission group (P= 0.002) and to the group of treatment-naïve patients at relapse (P= 0.03), likely representing a more advanced disease state in the IFN-β-treated group.
Expression analysis of cathepsins S and B, and their inhibitors, cystatins C and B, in patients with MS
To evaluate whether cathepsin and cystatin expression levels are associated with the MS disease state, RNA expression analyses were performed in PBLs, and protein expression in sera, using samples from MS patients and healthy individuals as controls. Whereas RNA expression levels of all four genes were correlated (Spearman’s ρ= 0.530–0.696, P < 2 × 10⁻⁶), the serum protein levels were not, likely reflecting differences in transcription regulation versus the regulation of protein levels from translation through secretion by various cell types to the blood. We therefore included in all the analyses also the ratio of protease to inhibitor in the serum protein level, as a measure of the overall functional proteolytic potential.
CTSS RNA expression levels were significantly higher in PBLs from MS patients compared to healthy controls (n= 18) both at remission (n= 24, 31% increase, P= 0.03) and even more at relapse state (n= 30, 74% increase, P= 3 × 10⁻⁵, Fig. 1A). RNA levels of CTSS in the group at relapse were also moderately elevated in comparison to the group at remission (32% increase, P= 0.02). RNA expression levels of CTSB did not differ between MS patients and controls. The levels of the transcripts for the inhibitors CSTC and CSTB were significantly higher in PBLs from the MS relapse group, compared to controls (for CSTB 52% increase, P= 0.01; for CSTC 39% increase, P= 0.02, data not shown) and in the relapse group compared to the remission group (for CSTB 22% increase, P= 0.02; for CSTC 79% increase, P= 0.001, data not shown).
Fig 1.
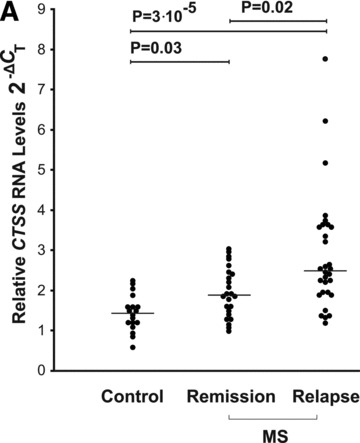
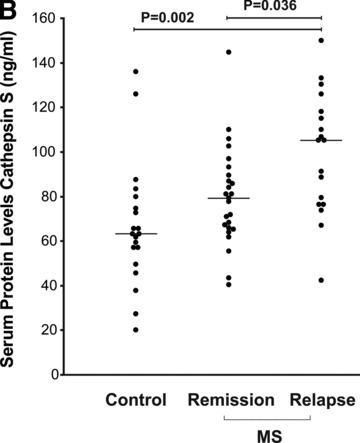

Cathepsin S levels in RNA from PBLs and sera of MS patients compared to healthy controls. (A) CTSS mRNA levels in healthy controls (n= 18); MS patients in remission (n= 24) and patients in relapse (n= 30) were assessed by real-time PCR. The 2−ΔCT values shown are relative to GAPDH as a reference gene. (B) ELISA analysis of cathepsin S serum protein levels in healthy controls (n= 20), MS patients in remission (n= 25) or relapse (n= 18) (both groups without immunomodulatory treatment). (C) Ratio of serum cathepsin S/cystatin C in healthy controls (n= 20), MS remission (n= 25) and MS relapse (n= 18) groups. Medians are depicted by horizontal bars.
Comparative analysis of serum protein levels detected higher (66% increase) levels of cathepsin S in MS patients in the relapse group (treatment naïve, n= 18) compared to controls (n= 20; P= 0.002), and also elevated (by 33%) in the relapse group in comparison to the MS remission group (n= 25, P= 0.036) (Fig. 1B). The levels of serum cathepsin S in the MS remission group did not differ significantly from those recorded in the controls group. No significant changes were observed in the serum protein levels of pro-cathepsin B and cystatin C in MS patients when compared to healthy controls (data not shown).
The ratios of serum cathepsin S to cystatin in the MS relapse group were significantly increased compared to the remission and control groups, paralleling the differences observed for the cathepsin S protein itself (56% and 59% increase; P= 0.027 and P= 0.01, respectively) (Fig. 1C).
GC effects on cathepsins and cystatins expression at relapse
Following the observation that in the relapse state, cathepsin S RNA and serum protein levels are higher, we evaluated the effects of GC therapy, which reduces the relapse severity and duration in MS, on expression levels of cathepsin S, cathepsin B, cystatin C and cystatin B.
GC treatment led to a significant reduction in the RNA levels for all four genes (44% decrease, P= 6 × 10⁻⁶ for CTSS; 16% decrease, P= 0.03 for CTSB; 27% decrease, P= 0.0001 for CSTC; and 36% decrease, P= 2 × 10⁻⁵ for CSTB) (Fig. 2A).
Fig 2.


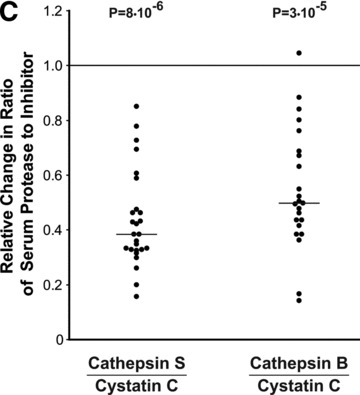
Modulation of cathepsin and cystatin expression by GC therapy in PBLs and serum during the MS relapse. (A) Relative RNA expression levels before and at day 7, following a 6 day IV course of GC treatment were quantified by 2−ΔΔCT values, n= 27 (except for CSTB n= 26). (B) Serum protein levels in day 7 following therapy initiation are depicted relative to pre-treatment values at relapse for cathepsin S (n= 26), pro-cathepsin B (n= 23), cystatin C (n= 26). (C) Changes in the ratios between the proteases and the inhibitor cystatin C in the serum following GC treatment. Horizontal bars: median of fold changes of post-treatment relative to pre-treatment ratios.
Following GC treatment, serum protein levels (Fig. 2B) of cathepsin S were significantly reduced by 27% (n= 26; P= 1 × 10⁻⁵), pro-cathepsin B serum protein levels reduced by 8% (n= 23; P= 0.0007), whereas a significant increase of 82% was detected for the protease inhibitor cystatin C (n= 26; P= 8 × 10⁻⁶). The net effect of GC was reduction of the overall proteolytic activity potential in the serum as can be seen from the decrease in the ratio of cathepsins S and B to cystatin C proteins following treatment (62% decrease for cathepsin S/cystatin C, P= 8 × 10⁻⁶; 50% decrease for cathepsin B/cystatin C; P= 3 × 10⁻⁵) (Fig. 2C).
IFN-β-mediated modulation of cathepsins and cystatins expression
IFN-β therapy led to a significant but mild increase in the RNA levels of CTSB (16% increase, P= 0.03), and a much more prominent and significant increase in the cystatin genes CSTC (48% increase, P= 0.011) and CSTB (44% increase, P= 0.004) in PBLs (n= 16) (Fig. 3A). CTSS RNA levels did not change significantly following IFN-β treatment; however, paired analysis revealed a decrease in serum cathepsin S protein levels following IFN-β treatment in the majority of patients (19/25 patients displayed decreased levels, overall 16% decrease of median, P= 0.006) (Fig. 3B). Notably, IFN-β treatment did not affect significantly either pro-cathepsin B or cystatin C serum protein levels. Thus, the overall effect of IFN-β therapy was a small but significant decrease of the cathepsin S to cystatin C ratio in the serum by 16% (a decrease was observed in 21/25 treated patients, P= 0.0008) (Fig. 3C).
Fig 3.


IFN-β effects on cathepsins and cystatins expression in PBLs and sera from MS patients in remission. (A) Expression levels of cathepsins and cystatins following a 3–6 month period of IFN-β treatment and relative to pre-treatment levels, quantified by 2−ΔΔCT values; n= 16. (B) Cathepsin S serum protein levels before and following a 3–6 month period of IFN-β treatment were analysed by ELISA (n= 27). (C) Ratios between the serum levels of the proteases and the cystatin C inhibitor. Horizontal bars: median of fold changes of during treatment relative to pre-treatment ratios.
IFN-β response phenotype and cathepsin S expression levels
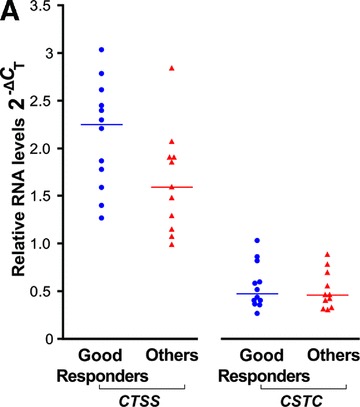
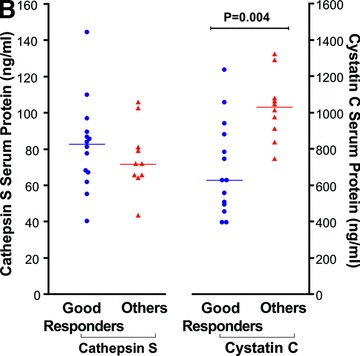
Following the pharmacogenetics study which reported association of the CTSS gene with IFN-β response in MS [31], and our observation that IFN-β seems to reduce cathepsin S serum protein levels (above), we assessed cathepsin S and its inhibitors’ expression with respect to the IFN-β treatment response phenotype in the patient cohort. Pre-treatment levels of cathepsin S were higher in RNA from PBLs of patients classified as ‘good responders’ (n= 12) compared to the ‘others’ group (n= 11), shown in Figure 4A; however, this trend did not reach statistical significance. Differences for CTSB, CSTB (not shown) and CSTC (Fig. 4A), or any of the ratios of the proteases to their inhibitors, were not significant. Interestingly, the pre-treatment serum protein levels of the inhibitor cystatin C were correlated with response status, and were significantly lower in the ‘good responders’ group (64% higher levels in the ‘others group versus the ‘good responder’ group, n= 10 and n= 14, respectively, P= 0.004, Fig. 4B). The sensitivity and specificity for detecting a good responder was 71% and 90%, respectively, using 809 ng/ml as a cut-off value [Area under curve (AUC) = 0.850 ± 0.079, P= 0.004]. The protein ratio cathepsin S/cystatin C in the serum, reflecting the balance of the proteolytic activity for cathepsin S, was significantly higher in ‘good responders’ prior to treatment initiation (by 94%, P= 0.003) (Fig. 4C).
Fig 4.
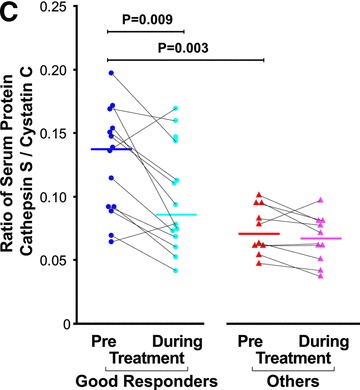
Response phenotype to IFN-β treatment and cathepsin S and cystatin C expression levels. IFN-β treated MS patients were stratified according to their response phenotype. (A) CTSS and CSTC pre-treatment levels relative RNA levels depicted as 2−ΔCT values, compared between ‘good responders’ (blue circles, n= 12) and ‘others’ patient groups (red triangles, n= 11). (B) Serum cathepsin S and cystatin C pre-treatment levels assessed by ELISA in ‘good responders’ (n= 14) and the ‘others’ patient groups (n= 10). (C) Serum cathepsin S to cystatin C ratios in ‘good responders’ (n= 14) and ‘others’ patient groups (n= 10); values prior to IFN-β therapy and 3–6 months after therapy initiation are connected by lines.
Notably, the effect of IFN-β treatment of reducing the cathepsin S/cystatin C ratio, which we observed in the whole cohort analysis, upon stratification of the cohort by IFN-β response phenotype, appears to be confined mainly to the ‘good responder’ phenotype group (P= 0.009). Cathepsin B levels were not associated with IFN-β response and neither was its ratio to cystatin C (data not shown).
Discussion
In the present study we analysed the modulation of expression of cathepsins S and B and their inhibitors cystatins C and B in patients with MS. We report higher levels of the protease cathepsin S in MS patients during the relapse state, in RNA from PBLs and in serum proteins, in comparison with healthy individuals. RNA levels of the endogenous cathepsin inhibitors cystatins B and C were also increased in the relapse state. Therefore, although the transcript levels of cathepsin S increased in PBLs in MS patients, their biological effects may be kept in check by the concomitant increase of the cystatin inhibitors’ transcripts. In the serum, however, the balance between the cathepsin S and cystatin C levels was shifted upwards in the relapse state, mainly as a result of the increase in the levels of cathepsin S.
These findings are consistent with the known functions of cathepsin S in immune activity, and with reports of elevated cathepsin S levels observed in other immune-mediated diseases, as well as in animal models of autoimmune conditions [20, 21, 24, 29, 36, 37], and with the reported inhibition of autoimmune states by specific cathepsin S inhibitors [21, 38]. Notably, studies to date have been inconsistent with respect to reports of cystatin C levels in MS patients, and were based on CSF findings in the CSF [39–41]. The results of the present study suggest that MS disease state is not correlated with changes in cystatin C serum levels. Both GCs and IFN-β, immunosuppressive and immunomodulatory treatments used in the management of MS, decreased serum cathepsin S levels, with an inverse effect on the inhibitor cystatin C serum levels. The net effect of these anti-inflammatory therapies, and particularly that of GC, was to shift the cathepsin S/cystatin C ratios towards those observed in the remission state and towards norms observed in the healthy controls group, suggesting an overall decrease of the proteolytic capacity in the serum. Similar effects of GCs on cathepsin S and cystatin C have been reported in patients with asthma and in in vitro studies [42–44].
The effects of GCs and IFN-β on the PBL RNA levels versus serum protein levels appear to be opposing for some of the genes, such as cystatin C, emphasizing the different cellular milieu and regulatory mechanisms for proteins secreted to the blood, versus the transcript content of leucocytes. The serum protein content is derived from secretion of various cell types, including the PBLs and their sub-populations, and endothelial cells. Each and all of these cells, are known also to be aberrantly activated in MS, and may contribute to the elevated levels of serum cathepsins and cystatins observed in our study. Moreover, even within the PBL population, regulation at the protein level, and specifically at the stage of secretion, can lead to discordance between the RNA levels observed and the serum protein levels. Cell-specific effects are present, as indicated by other studies, for example, in T cells [45]. The findings observed herein at the serum level may indicate a prominent role for post-translational regulation, including regulation of zymogen processing, as well as at the level of secretion to the extracellular space.
Notably, when the MS patients were stratified according to response definition, it became evident that the pre-treatment cystatin C and the pre-treatment ratio of cathepsin S/cystatin C serum protein levels were associated with the ensuing IFN-β therapy beneficial response phenotype. Low pre-treatment values of serum cystatin C specifically appeared to be indicators for a good IFN-β response with relatively high specificity and sensitivity. The ratio between the protease and its inhibitor was significantly affected by IFN-β only in the ‘good responder’ group. Considering that MS is known to have heterogeneous aetiology, these results may indicate that in the ‘good responder’ group, cathepsin S and cystatin C proteolytic pathways are affected through modulation of expression by the IFN-β signalling transduction pathway, and that IFN-β therapy is beneficial mainly in disease subtypes with dysregulation of these pathways. This finding is particularly interesting as it is in line with the pharmacogenetic evidence for association of the CTSS gene with IFN-β response [31]. Although the response definition used herein was a dichotomic definition, in which the ‘others’ response definition comprised a spectrum ranging from intermediate response phenotypes to non-response; nevertheless, it was sufficient to capture an effect of the cathepsin S/cystatin C associated proteolytic pathway, in the good responder phenotype group. Larger studies with a more rigorous definition of the ‘poor responder’ group are required to evaluate the sensitivity and specificity of serum cystatin C and the cathepsin S/cystatin C measures as predictors of response.
IFN-β and GCs act through different mechanisms, yet both are known to affect MHC cell surface expression, as well BBB permeability [9, 46], activities in which accumulating evidence suggest involvement of cathepsins. Recently, this has also been supported by our demonstration of a direct effect of cathepsin S, cathepsin B and cystatin C on the migratory capacity of immune cells through brain endothelial cells in vitro[47]. The promoter of cathepsin S harbours binding sites for activator protein (AP)1 and NF-κB transcription factors, which are inhibited by activation of the GC receptor [48], as well as response elements for IFN-β[31]. This suggests a possible mechanism for a direct effect of GCs and IFN-β on cathepsin S expression levels in leucocytes. Part of the GC effect of reduction in the serum levels of cathepsin S could also be attributed to its pro-apoptotic effects on T cells [46]. At the RNA levels, the effects recorded are independent of the total PBL counts, as the assay was controlled by normalizing to the reference gene.
The association with the disease state and effects of therapy observed for serum cathepsin S levels suggests that extracellular activity of this protease may be relevant in MS, and other immune-mediated disorders. Although cathepsin S is mostly referred to as an intracellular lysosomal protease, where its role in antigen processing and presentation is well described, recognition of the importance of its extracellular functions as a protease is accumulating [12, 15, 49]. The CNS-myelin component MBP, one of the MS-related autoantigens, is a cathepsin S substrate [25]. Thus, the secretion of cathepsin S by the immune cells that penetrate the BBB in MS may contribute to the demyelination process extracellularly, in addition to its intra-lysosomal role in generation of MBP peptide antigens and their presentation by the MHC class II molecules. Cathepsin S has also been shown to be involved in the degradation of ECM proteins which can contribute to angiogenesis and cell motility [50]. Increased extracellular proteolysis is a known element in the pathogenesis of MS and has been described extensively for the MMP family of proteases [4, 5, 51–53]. The variations in protein levels observed in this study for cathepsin S and cystatin C add to this picture, and support the role of proteases in increased leucocyte trafficking, autoantigen presentation, as well as pro-inflammatory cytokine and chemokine activity associated with MS.
In summary, this study demonstrates that cathepsin S expression levels are aberrantly elevated in patients with MS, and that MS therapies act to shift these levels towards levels within norms observed in healthy individuals. This effect appears to be specific to cathepsin S, as we did not observe similar effects on the levels of the other cathepsin evaluated herein, cathepsin B. The down-regulatory effect of GCs on cathepsin S serum levels is likely to be augmented by their inverse effect on the serum levels of the protease inhibitor cystatin C. The finding that elevated pre-treatment levels of the serum protein ratio cathepsin S/cystatin C appear to be associated with beneficial clinical response to IFN-β treatment, suggests that in a subgroup of patients with MS the cathepsin S–cystatin C proteolytic pathways are dysregulated, and that this subgroup is more likely to benefit from IFN-β therapy. The present findings support the need for further validation studies to assess the value of cathepsin S and cystatin C as predictive biomarkers for disease type and response to therapy, and as a possible basis for development of new targeted therapies for immune-mediated disorders such as MS.
Acknowledgments
We thank the MS patients and the healthy volunteers for participation in this study. We gratefully acknowledge Izabella Lejbkowicz, Ph.D., Anat Volkowich, M.Sc. and Maayan Merhav, M.Sc., for management of sample repository and clinical database; Sara Dishon, M.P.A., for providing patient care and assistance in clinical data management and Ofra Barnett-Griness, Ph.D., Nili Stein, M.P.H. and Idit Lavi, M.A., Carmel Medical Center, Haifa, Israel, for statistical consultations.
Conflict of interest
The authors confirm that there are no conflicts of interest.
References
- 1.Weiner HL. The challenge of multiple sclerosis: how do we cure a chronic heterogeneous disease. Ann Neurol. 2009;65:239–48. doi: 10.1002/ana.21640. [DOI] [PubMed] [Google Scholar]
- 2.Compston A, Coles A. Multiple sclerosis. Lancet. 2008;372:1502–17. doi: 10.1016/S0140-6736(08)61620-7. [DOI] [PubMed] [Google Scholar]
- 3.Chandler S, Miller KM, Clements JM, et al. Matrix metalloproteinases, tumor necrosis factor and multiple sclerosis: an overview. J Neuroimmunol. 1997;72:155–61. doi: 10.1016/s0165-5728(96)00179-8. [DOI] [PubMed] [Google Scholar]
- 4.Agrawal SM, Lau L, Yong VW. MMPs in the central nervous system: where the good guys go bad. Semin Cell Dev Biol. 2008;19:42–51. doi: 10.1016/j.semcdb.2007.06.003. [DOI] [PubMed] [Google Scholar]
- 5.Galboiz Y, Shapiro S, Lahat N, et al. Matrix metalloproteinases and their tissue inhibitors as markers of disease subtype and response to interferon-beta therapy in relapsing and secondary-progressive multiple sclerosis patients. Ann Neurol. 2001;50:443–51. doi: 10.1002/ana.1218. [DOI] [PubMed] [Google Scholar]
- 6.Stahn C, Lowenberg M, Hommes DW, et al. Molecular mechanisms of glucocorticoid action and selective glucocorticoid receptor agonists. Mol Cell Endocrinol. 2007;275:71–8. doi: 10.1016/j.mce.2007.05.019. [DOI] [PubMed] [Google Scholar]
- 7.Yong VW, Zabad RK, Agrawal S, et al. Elevation of matrix metalloproteinases (MMPs) in multiple sclerosis and impact of immunomodulators. J Neurol Sci. 2007;259:79–84. doi: 10.1016/j.jns.2006.11.021. [DOI] [PubMed] [Google Scholar]
- 8.Glass-Marmor L, Paperna T, Galboiz Y, et al. Immunomodulation by chronobiologically-based glucocorticoids treatment for multiple sclerosis relapses. J Neuroimmunol. 2009;210:124–7. doi: 10.1016/j.jneuroim.2009.03.004. [DOI] [PubMed] [Google Scholar]
- 9.Dhib-Jalbut S, Marks S. Interferon-beta mechanisms of action in multiple sclerosis. Neurology. 2010;74:S17–24. doi: 10.1212/WNL.0b013e3181c97d99. [DOI] [PubMed] [Google Scholar]
- 10.Brix K, Dunkhorst A, Mayer K, et al. Cysteine cathepsins: cellular roadmap to different functions. Biochimie. 2008;90:194–207. doi: 10.1016/j.biochi.2007.07.024. [DOI] [PubMed] [Google Scholar]
- 11.Burster T, Beck A, Tolosa E, et al. Differential processing of autoantigens in lysosomes from human monocyte-derived and peripheral blood dendritic cells. J Immunol. 2005;175:5940–9. doi: 10.4049/jimmunol.175.9.5940. [DOI] [PubMed] [Google Scholar]
- 12.Zavasnik-Bergant T, Turk B. Cysteine proteases: destruction ability versus immunomodulation capacity in immune cells. Biol Chem. 2007;388:1141–9. doi: 10.1515/BC.2007.144. [DOI] [PubMed] [Google Scholar]
- 13.Hsing LC, Rudensky AY. The lysosomal cysteine proteases in MHC class II antigen presentation. Immunol Rev. 2005;207:229–41. doi: 10.1111/j.0105-2896.2005.00310.x. [DOI] [PubMed] [Google Scholar]
- 14.Faure-Andre G, Vargas P, Yuseff MI, et al. Regulation of dendritic cell migration by CD74, the MHC class II-associated invariant chain. Science. 2008;322:1705–10. doi: 10.1126/science.1159894. [DOI] [PubMed] [Google Scholar]
- 15.Lutgens SP, Cleutjens KB, Daemen MJ, et al. Cathepsin cysteine proteases in cardiovascular disease. FASEB J. 2007;21:3029–41. doi: 10.1096/fj.06-7924com. [DOI] [PubMed] [Google Scholar]
- 16.Flannery T, Gibson D, Mirakhur M, et al. The clinical significance of cathepsin S expression in human astrocytomas. Am J Pathol. 2003;163:175–82. doi: 10.1016/S0002-9440(10)63641-3. [DOI] [PMC free article] [PubMed] [Google Scholar]
- 17.Hao HP, Doh-Ura K, Nakanishi H. Impairment of microglial responses to facial nerve axotomy in cathepsin S-deficient mice. J Neurosci Res. 2007;85:2196–206. doi: 10.1002/jnr.21357. [DOI] [PubMed] [Google Scholar]
- 18.Gillet L, Roger S, Besson P, et al. Voltage-gated sodium channel activity promotes cysteine cathepsin-dependent invasiveness and colony growth of human cancer cells. J Biol Chem. 2009;284:8680–91. doi: 10.1074/jbc.M806891200. [DOI] [PMC free article] [PubMed] [Google Scholar]
- 19.Conus S, Simon HU. Cathepsins: key modulators of cell death and inflammatory responses. Biochem Pharmacol. 2008;76:1374–82. doi: 10.1016/j.bcp.2008.07.041. [DOI] [PubMed] [Google Scholar]
- 20.Yang H, Kala M, Scott BG, et al. Cathepsin S is required for murine autoimmune myasthenia gravis pathogenesis. J Immunol. 2005;174:1729–37. doi: 10.4049/jimmunol.174.3.1729. [DOI] [PubMed] [Google Scholar]
- 21.Saegusa K, Ishimaru N, Yanagi K, et al. Cathepsin S inhibitor prevents autoantigen presentation and autoimmunity. J Clin Invest. 2002;110:361–9. doi: 10.1172/JCI14682. [DOI] [PMC free article] [PubMed] [Google Scholar]
- 22.Katunuma N, Matsunaga Y, Himeno K, et al. Insights into the roles of cathepsins in antigen processing and presentation revealed by specific inhibitors. Biol Chem. 2003;384:883–90. doi: 10.1515/BC.2003.099. [DOI] [PubMed] [Google Scholar]
- 23.Vasiljeva O, Reinheckel T, Peters C, et al. Emerging roles of cysteine cathepsins in disease and their potential as drug targets. Curr Pharm Des. 2007;13:387–403. doi: 10.2174/138161207780162962. [DOI] [PubMed] [Google Scholar]
- 24.Pozgan U, Caglic D, Rozman B, et al. Expression and activity profiling of selected cysteine cathepsins and matrix metalloproteinases in synovial fluids from patients with rheumatoid arthritis and osteoarthritis. Biol Chem. 2010;391:571–9. doi: 10.1515/BC.2010.035. [DOI] [PubMed] [Google Scholar]
- 25.Beck H, Schwarz G, Schroter CJ, et al. Cathepsin S and an asparagine-specific endoprotease dominate the proteolytic processing of human myelin basic protein in vitro. Eur J Immunol. 2001;31:3726–36. doi: 10.1002/1521-4141(200112)31:12<3726::aid-immu3726>3.0.co;2-o. [DOI] [PubMed] [Google Scholar]
- 26.Bever CT, Jr, Garver DW. Increased cathepsin B activity in multiple sclerosis brain. J Neurol Sci. 1995;131:71–3. doi: 10.1016/0022-510x(95)00039-5. [DOI] [PubMed] [Google Scholar]
- 27.Bever CT, Jr, Panitch HS, Johnson KP. Increased cathepsin B activity in peripheral blood mononuclear cells of multiple sclerosis patients. Neurology. 1994;44:745–8. doi: 10.1212/wnl.44.4.745. [DOI] [PubMed] [Google Scholar]
- 28.Nagai A, Murakawa Y, M Terashima, et al. Cystatin C and cathepsin B in CSF from patients with inflammatory neurologic diseases. Neurology. 2000;55:1828–32. doi: 10.1212/wnl.55.12.1828. [DOI] [PubMed] [Google Scholar]
- 29.Ma J, Tanaka KF, Yamada G, et al. Induced expression of cathepsins and cystatin C in a murine model of demyelination. Neurochem Res. 2007;32:311–20. doi: 10.1007/s11064-006-9183-y. [DOI] [PubMed] [Google Scholar]
- 30.Grossman I, Avidan N, C Singer, et al. Pharmacogenetics of glatiramer acetate therapy for multiple sclerosis reveals drug-response markers. Pharmacogenet Genomics. 2007;17:657–66. doi: 10.1097/FPC.0b013e3281299169. [DOI] [PubMed] [Google Scholar]
- 31.Cunningham S, Graham C, M Hutchinson, et al. Pharmacogenomics of responsiveness to interferon IFN-beta treatment in multiple sclerosis: a genetic screen of 100 type I interferon-inducible genes. Clin Pharmacol Ther. 2005;78:635–46. doi: 10.1016/j.clpt.2005.08.018. [DOI] [PubMed] [Google Scholar]
- 32.McDonald WI, Compston A, G Edan, et al. Recommended diagnostic criteria for multiple sclerosis: guidelines from the International Panel on the diagnosis of multiple sclerosis. Ann Neurol. 2001;50:121–7. doi: 10.1002/ana.1032. [DOI] [PubMed] [Google Scholar]
- 33.Glass-Marmor L, Paperna T, Ben-Yosef Y, et al. Chronotherapy using corticosteroids for multiple sclerosis relapses. J Neurol Neurosurg Psychiatry. 2007;78:886–8. doi: 10.1136/jnnp.2006.104000. [DOI] [PMC free article] [PubMed] [Google Scholar]
- 34.Byun E, Caillier SJ, X Montalban, et al. Genome-wide pharmacogenomic analysis of the response to interferon beta therapy in multiple sclerosis. Arch Neurol. 2008;65:337–44. doi: 10.1001/archneurol.2008.47. [DOI] [PubMed] [Google Scholar]
- 35.Livak KJ, Schmittgen TD. Analysis of relative gene expression data using real-time quantitative PCR and the 2(-Delta Delta C(T)) Method. Methods. 2001;25:402–8. doi: 10.1006/meth.2001.1262. [DOI] [PubMed] [Google Scholar]
- 36.Zavasnik-Bergant T, Turk B. Cysteine cathepsins in the immune response. Tissue Antigens. 2006;67:349–55. doi: 10.1111/j.1399-0039.2006.00585.x. [DOI] [PubMed] [Google Scholar]
- 37.Liu J, Ma L, J Yang, et al. Increased serum cathepsin S in patients with atherosclerosis and diabetes. Atherosclerosis. 2006;186:411–9. doi: 10.1016/j.atherosclerosis.2005.08.001. [DOI] [PubMed] [Google Scholar]
- 38.Riese RJ, Mitchell RN, JA Villadangos, et al. Cathepsin S activity regulates antigen presentation and immunity. J Clin Invest. 1998;101:2351–63. doi: 10.1172/JCI1158. [DOI] [PMC free article] [PubMed] [Google Scholar]
- 39.Hansson SF, Simonsen AH, H Zetterberg, et al. Cystatin C in cerebrospinal fluid and multiple sclerosis. Ann Neurol. 2007;62:193–6. doi: 10.1002/ana.20945. [DOI] [PubMed] [Google Scholar]
- 40.Irani DN, Anderson C, R Gundry, et al. Cleavage of cystatin C in the cerebrospinal fluid of patients with multiple sclerosis. Ann Neurol. 2006;59:237–47. doi: 10.1002/ana.20786. [DOI] [PubMed] [Google Scholar]
- 41.Liu S, Bai S, Z Qin, et al. Quantitative proteomic analysis of the cerebrospinal fluid of patients with multiple sclerosis. J Cell Mol Med. 2009;13:1586–603. doi: 10.1111/j.1582-4934.2009.00850.x. [DOI] [PMC free article] [PubMed] [Google Scholar]
- 42.Bjarnadottir M, Grubb A, Olafsson I. Promoter-mediated, dexamethasone-induced increase in cystatin C production by HeLa cells. Scand J Clin Lab Invest. 1995;55:617–23. doi: 10.3109/00365519509110261. [DOI] [PubMed] [Google Scholar]
- 43.Cimerman N, Brguljan PM, M Krasovec, et al. Serum cystatin C, a potent inhibitor of cysteine proteinases, is elevated in asthmatic patients. Clin Chim Acta. 2000;300:83–95. doi: 10.1016/s0009-8981(00)00298-9. [DOI] [PubMed] [Google Scholar]
- 44.Cimerman N, Brguljan PM, M Krasovec, et al. Circadian and concentration profile of cathepsin S in sera from healthy subjects and asthmatic patients. Pflugers Arch. 2001;442:R204–6. doi: 10.1007/s004240100026. [DOI] [PubMed] [Google Scholar]
- 45.Costantino CM, Ploegh HL, Hafler DA. Cathepsin S regulates class II MHC processing in human CD4+ HLA-DR+ T cells. J Immunol. 2009;183:945–52. doi: 10.4049/jimmunol.0900921. [DOI] [PMC free article] [PubMed] [Google Scholar]
- 46.Tischner D, Reichardt HM. Glucocorticoids in the control of neuroinflammation. Mol Cell Endocrinol. 2007;275:62–70. doi: 10.1016/j.mce.2007.03.007. [DOI] [PubMed] [Google Scholar]
- 47.Staun-Ram E, Miller A. Cathepsins (S and B) and their inhibitor cystatin C in immune cells: modulation by interferon-β and role played in cell migration. J Neuroimmunol. 2010 doi: 10.1016/j.jneuroim.2010.10.015. 10.1016/j.jneuroim.2010.10.015. [DOI] [PubMed] [Google Scholar]
- 48.Shi GP, Webb AC, KE Foster, et al. Human cathepsin S: chromosomal localization, gene structure, and tissue distribution. J Biol Chem. 1994;269:11530–6. [PubMed] [Google Scholar]
- 49.Wang B, Sun J, Kitamoto S, et al. Cathepsin S controls angiogenesis and tumor growth via matrix-derived angiogenic factors. J Biol Chem. 2006;281:6020–9. doi: 10.1074/jbc.M509134200. [DOI] [PubMed] [Google Scholar]
- 50.Gocheva V, Joyce JA. Cysteine cathepsins and the cutting edge of cancer invasion. Cell Cycle. 2007;6:60–4. doi: 10.4161/cc.6.1.3669. [DOI] [PubMed] [Google Scholar]
- 51.Bar-Or A, Nuttall RK, M Duddy, et al. Analyses of all matrix metalloproteinase members in leukocytes emphasize monocytes as major inflammatory mediators in multiple sclerosis. Brain. 2003;126:2738–49. doi: 10.1093/brain/awg285. [DOI] [PubMed] [Google Scholar]
- 52.Lindberg RL, De Groot CJ, L Montagne, et al. The expression profile of matrix metalloproteinases (MMPs) and their inhibitors (TIMPs) in lesions and normal appearing white matter of multiple sclerosis. Brain. 2001;124:1743–53. doi: 10.1093/brain/124.9.1743. [DOI] [PubMed] [Google Scholar]
- 53.Leppert D, Lindberg RL, Kappos L, et al. Matrix metalloproteinases: multifunctional effectors of inflammation in multiple sclerosis and bacterial meningitis. Brain Res Brain Res Rev. 2001;36:249–57. doi: 10.1016/s0165-0173(01)00101-1. [DOI] [PubMed] [Google Scholar]