Abstract
Systemic inflammation is a major factor influencing the outcome and quality of patient with chronic obstructive pulmonary disease (COPD) and acute exacerbations (AECOPD). Because of the inflammatory complexity, a great challenge is still confronted to optimize the identification and validation of disease-specific biomarkers. This study aimed at developing a new protocol of specific biomarker evaluation by integrating proteomic profiles of inflammatory mediators with clinical informatics in AECOPD patients, understand better their function and signal networks. Plasma samples were collected from healthy non-smokers or patients with stable COPD (sCOPD) or AECOPD on days 1 and 3 of the admission and discharging day (day 7–10). Forty chemokines were measured using a chemokine multiplex antibody array. Clinical informatics was achieved by a Digital Evaluation Score System (DESS) for assessing severity of patients. Chemokine data was compared among different groups and its correlation with DESS scores was performed by SPSS software. Of 40 chemokines, 30 showed significant difference between sCOPD patients and healthy controls, 16 between AECOPD patients and controls and 13 between AECOPD patients and both sCOPD and controls, including BTC, IL-9, IL-18Bpa, CCL22,CCL23, CCL25, CCL28, CTACK, LIGHT, MSPa, MCP-3, MCP-4 and OPN. Of them, some had significant correlation with DESS scores. There is a disease-specific profile of inflammatory mediators in COPD and AECOPD patients which may have a potential diagnostics together with clinical informatics of patients. Our preliminary study suggested that integration of proteomics with clinical informatics can be a new way to validate and optimize disease-special biomarkers.
Keywords: AECOPD, COPD, clinical informatics, inflammation, biomarkers
Introduction
Chronic obstructive pulmonary disease is an inflammatory disease characterized by the progressive deterioration of pulmonary function and increasing airway obstruction [1, 2], as the fourth leading cause of death in urban areas and third in rural areas in China [3]. Along with a progressive decline in lung function, such patients often experience sudden deterioration termed acute exacerbations (AECOPD), which become more frequent and severe when the severity of disease increases [4]. The economic and social burden of AECOPD is extremely high, while the cause of approximately one-third of severe exacerbations cannot be identified [5]. In-hospital mortality of exacerbations is approximately 10% associated with the severity [6]. The diagnosis and control of AECOPD currently depends on detecting changes in clinical symptoms that lack precise definition and essential biomarkers which are important for diagnosis and monitoring of therapeutics in COPD patients [5].
Both local and systemic inflammations are enhanced during AECOPD [7, 8], especially systemic inflammation [9, 10]. Previous studies suggested that the overproduction of cytokines and chemokines were involved in the abnormalities seen in COPD [11-14]. Variation in these small attractant proteins occurs among different stages and severities of the disease. To better characterize disease-specific inflammatory biomarker for the improvement of diagnosis, it is important to test a large number of potential protein biomarkers due to the multi-dimensional background in COPD exacerbations [13]. This study aimed to determine the special profile of inflammatory mediators in AECOPD and investigate the disease specificity comparing with clinical informatics in AECOPD patients. We compared the plasma profile of 40 chemokines among healthy, AECOPD patients or sCOPD. The disease specificity of selected inflammatory biomarkers was furthermore evaluated with clinical informatics of patients. To our knowledge, this is the first and preliminary report to determine the systemic inflammatory profile in AECOPD patients by chemokine multiplex antibody array and integrating molecular outcomes with clinical informatics by a digital evaluation scoring system.
Materials and methods
Patient population
This study was designed using a case-controlled approach. Of 200 candidates from volunteers, inpatients and outpatients, seven AECOPD patients, five sCOPD patients and five healthy controls were recruited in the study. Stable COPD was defined by American Thoracic Society/European Respiratory Society consensus criteria as no requirement for increased treatment above maintenance therapy, other than bronchodilators, for 30 days [1]. AECOPD was the reason for hospital admission and characterized the accepted definition, for example ≥ 2 of increased dyspnoea, increased sputum volume and/or increased sputum purulence [6]. Resolution of an AECOPD was defined as: (1) completion of treatment with antibiotics and increased steroids; (2) return of symptoms to baseline levels for 48 hrs or (3) if symptoms had not fully resolved within 30 days of onset, symptoms were stable for 48 hrs and did not require further acute treatment [5].
Sample preparation
Plasma samples were collected intravenously three times on initial diagnosis (Day 1), during the treatment (Day 3) and on discharging day (usually on day 7–10) after the admission of AECOPD patients, while once from five sCOPD patients and five healthy controls. The aliquots of plasma were collected in potassium-EDTA tubes, centrifuged at 2000 χ g for 20 min. and then stored at −80°C until analyses. AECOPD patients were admitted to the ward due to the need of therapy, while sCOPD patients were in the outpatient clinic. The study protocol was approved by the ethics board of Zhongshan Hospital, Fudan University (Shanghai, China).
Chemokine multiplex antibody array
Plasma samples were analysed using a SilverQuant multiplex quantitative antibody array kit (Gentel Biosciences), a microplate-based antibody array that measures up to 40 cytokines with a seven-point standard curve and one blank in a single well. Procedural and full technical details, including sensitivity, dynamic range and intra-assay and inter-assay reproducibility, are given at website (http://www.gentelbio.com/support/user-protocols.html). The chromogenic detection technology exceeds ELISA sensitivity by as much as 10 times, and the coefficients of variation between spots are below 15%, typically about 10%. Briefly, capture antibodies on the array capture target antigens in a concentration-dependent manner. After washing away unbound material, a biotinylated detector antibody is added that specifically binds each protein. The final step is binding with a secondary antibody conjugated with a gold label and silver enhancement reagent. Samples were assayed in duplicate or triplicate, depending on the sample volume requirements of the commercial company’s testing service. In this study, we used the panel with detective antibodies for the following chemokines: 6Ckine, Axl, BTC, CCL28, CTACK, CXCL16, ENA-78, Eotaxin-3, GCP-2, GRO, HCC-1, HCC-4, IL-9, IL-17F, IL-18Bpa, IL-28A, IL-29, IL-31, IP-10, I-TAC, LIF, LIGHT, Lymphotactin, MCP-2,MCP-3, MCP-4, MDC, MIF, MIP-3a, MIP-3b, MPIF-1, MSPa, NAP-2, OPN, PARC, PF4, SDF-1a, TARC, TECK and TSLP. Abbreviations, full names, ligands and receptors, cellular resources and related biological functions those mediators measured in this study were listed in Table S1.
Digital evaluation score system
Digital Evaluation Score System is a score index to translate clinical descriptions and information into clinical informatics, which took into account patient symptoms, signs, doctor examination, biochemical analyses and clinical imaging in sCOPD patients or AECOPD. Variables in the DESS included symptoms in Table S2, signs in Table S3 and clinical biochemical analyses in Table S4. For the assessment of severity, each component was then assigned with 0, 1, 2 and 4 as shown in Tables S2–S4. The score of 4 as the maximal value indicates far more above normal range or much severer condition, while 0 as the minimal value indicates that it is within physiological range. After compiling patients’ data, the points of each variable were added, so that the DESS scores ranged from 0 to 264 points, with higher scores indicating a severer condition. Patients were scored on the day when plasma sample were collected.
Statistical analysis
All values were expressed as mean ± S.D. Analyses were performed with SPSS software (SPSS 18.0; SPSS Inc; Chicago, IL, USA). Results of multiplex array were analysed using 4-parameter regression curves to determine concentration of analyte following data acquisition. Forty chemokines had each own standard curve. For some spots on the slides marked as ‘over’ or ‘under’ by detection software, their value was replaced by top or bottom concentration in the seven-point standard curve accordingly. Paired t-test was used for data analysis among different time points of AECOPD. Correlation analysis between DESS scores in AECOPD patients and each chemokine were performed. P < 0.05 was considered statistically significant.
Results
Four males and three females aged 79–92 years (83 ± 7 years) were included in AECOPD group. The mean duration of evolution of COPD was 23 ± 8 (range 10–30 years) years. The onset of exacerbation was pneumonia. Pulmonary function test were not performed due to the severity of disease. Of 400 variables in DESS, scores of 46 variables in AECOPD patients on day 1 were significantly higher than those on days 3 and 7–10 as listed in Table 1. DESS scores represented the severity of COPD declined as the condition improved. Total DESS values in AECOPD patients was 400, 180 and 175 on post-admission 1, 3 and 7 days, respectively, while DESS values on day 1 were significantly higher than days 3 and 7–10 (Table 2; P < 0.01, respectively). Correlation was found between most DESS variables and chemokines (Table S5–S8). Altogether 31 chemokines showed either positive or inverse correlation with different variables (P < 0.05).
Table 1.
Variables for seven AECOPD patients on day 1, 3 and 7 (mean ± S.D.)
| Variables | AECOPD on day 1 | AECOPD on day 3 | AECOPD on day 7 |
|---|---|---|---|
| Cough severeness | 1.571 ± 1.134 | 0 | 0 |
| Sputum | 2 ± 1.528 | 1 ± 1.414 | 0.429 ± 0.535 |
| Chest pressure | 2.857 ± 1.069 | 0.286 ± 0.488 | 0 |
| Short breathiness | 2.286 ± 0.756 | 0.571 ± 0.787 | 0.143 ± 0.378 |
| Limitation of activity | 1.429 ± 1.512 | 0.429 ± 0.787 | 0 |
| Orthopnoea at night | 1.429 ± 1.902 | 0.143 ± 0.378 | 0 |
| Oedema of lower limbs | 1.143 ± 1.952 | 0 | 0 |
| Fever (°C) | 0.571 ± 1.512 | 0 | 0 |
| Duration of fever | 0.571 ± 1.512 | 0 | 0 |
| Consciousness | 0.286 ± 0.756 | 0 | 0 |
| Appetite | 1 ± 0.816 | 0.429 ± 0.535 | 0.143 ± 0.378 |
| Stool and urine | 0.571 ± 1.512 | 0 | 0 |
| Hypertension | 2.857 ± 1.574 | 0 | 0 |
| Diabetes mellitus | 0.286 ± 0.756 | 0 | 0 |
| Chronic obstructive pulmonary disease (COPD) | 3.429 ± 0.976 | 0 | 0 |
| Temperature (°C) | 0 | 0.286 ± 0.488 | 0.143 ± 0.378 |
| Heart rate(beat/minute) | 2.857 ± 1.952 | 1.143 ± 1.952 | 1.143 ± 1.952 |
| Respiratory rate(/minute) | 2.714 ± 1.254 | 1.571 ± 1.813 | 1.429 ± 1.397 |
| Blood pressure (mmHg) | 0.714 ± 0.951 | 0.429 ± 0.787 | 0.143 ± 0.378 |
| Nutrition | 1.286 ± 1.254 | 1±1.414 | 1 ± 1.414 |
| Barrel chest | 1.714 ± 2.138 | 1.143 ± 1.952 | 1.143 ± 1.952 |
| Rales | 1.714 ± 0.756 | 0.571 ± 0.787 | 0.571 ± 0.787 |
| Haemoglobin (g/l) | 0.143 ± 0.378 | 0.286 ± 0.488 | 0.286 ± 0.488 |
| WBC (χ109/l) | 1.286 ± 1.89 | 1.143 ± 1.952 | 1.714 ± 2.138 |
| Neutrophil percentage (%) | 4 | 2.857 ± 1.952 | 3.429 ± 1.512 |
| Platelet (χ109/l) | 0.571 ± 1.512 | 1.143 ± 1.952 | 1.286 ± 1.89 |
| Albumin (g/l) | 0.857 ± 1.574 | 0.286 ± 0.756 | 1 ± 1 |
| Bilirubin (μmol/l) | 0.143 ± 0.378 | 0.143 ± 0.378 | 0.143 ± 0.378 |
| Urea (mmol/l) | 0.714 ± 1.496 | 1.143 ± 1.574 | 1 ± 1.528 |
| HDL (mmol/l) | 0.571 ± 1.512 | 0 | 0 |
| Na (mmol/l) | 0.571 ± 1.512 | 0.857 ± 1.464 | 0.857 ± 1.464 |
| K (mmol/l) | 0 | 0 | 0.571 ± 1.512 |
| Cl (mmol/l) | 0.571 ± 1.512 | 0 | 0 |
| Ca (mmol/l) | 0.571 ± 1.512 | 0 | 0 |
| Glycosylated haemoglobin, HbA1c (%) | 0.286 ± 0.756 | 0.286 ± 0.756 | 0.286 ± 0.756 |
| pH | 1.714 ± 2.138 | 0.571 ± 1.512 | 1.143 ± 1.952 |
| PaO2 (mmHg) | 1 ± 0.816 | 0.857 ± 0.69 | 1 ± 1.414 |
| PaCO2 (mmHg) | 2.857 ± 1.952 | 2.286 ± 2.138 | 1.286 ± 1.89 |
| SaO2 (%) | 0.571 ± 0.535 | 0.429 ± 0.535 | 0.143 ± 0.378 |
| Fasting blood glucose (mmol/l) | 0.714 ± 1.496 | 0.571 ± 1.512 | 0.857 ± 1.464 |
| C-reactive protein, CRP (mg/l) | 0.571 ± 0.787 | 0.714 ± 1.496 | 0.286 ± 0.756 |
| Lung consolidation | 1.857 ± 1.676 | 0.143 ± 0.378 | 0.286 ± 0.488 |
| Enlargement of lymph nodes | 0.571 ± 1.512 | 0 | 0 |
| Pleural effusion | 1.429 ± 1.813 | 0.143 ± 0.378 | 0.286 ± 0.488 |
| Emphysema | 2.286 ± 2.138 | 2.667 ± 2.066 | 2.667 ± 2.066 |
Table 2.
Scores of AECOPD patients on each day when samples collected
| AECOPD-1 | AECOPD-3 | AECOPD-7 | |
|---|---|---|---|
| Patient 1 | 106 | 48 | 40 |
| Patient 2 | 41 | 19 | 17 |
| Patient 3 | 68 | 39 | 33 |
| Patient 4 | 45 | 30 | 28 |
| Patient 5 | 53 | 23 | 16 |
| Patient 6 | 37 | 17 | 23 |
| Patient 7 | 50 | 4 | 18 |
| Total scores | 400 | 180 | 175 |
| Mean | 57 | 26 | 25 |
| S.D. | 24 | 15 | 9 |
| P ∇ | 0.005766* | 0.002928* | |
| P ∇ | 0.457311 |
P < 0.05.
Of 40 chemokines tested, Eotaxin-3 and NAP-2 in every group was below the minimal value of the detection. Levels of HCC-1, HCC-2 and 6Ckine in sCOPD patients or AECOPD were significantly higher than the healthy (Fig. 1, P < 0.05 or 0.01, respectively), while levels of MIP-3b, IL-17F and IL-31 were significantly altered only in sCOPD patients. Levels of IP-10, IL-28, IL-29, MIF, MIP3a and GCP-2 in sCOPD patients were significantly higher than the healthy or AECOPD patients (Fig. 2, P < 0.05 or 0.01, respectively).
Fig 1.
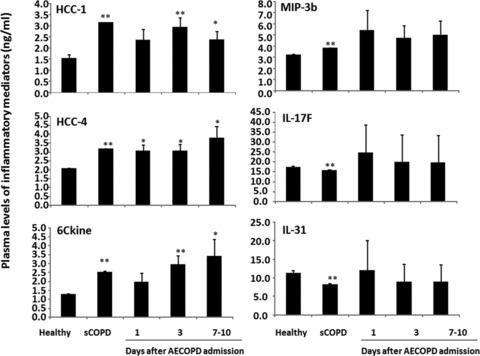
Plasma levels of hemofiltrate CC-chemokine (HCC)-1 and -4, chemokine (C-C motif) ligand 21 (6Ckine), interleukin (IL)-17F and -31 and macrophage inflammatory proteins (MIP)-3b in healthy, patients with stable COPD (sCOPD) and AECOPD patients on days 1, 3 and 7–10. * and ** stand for P values less than 0.05 and 0.01, respectively, as compared with healthy control.
Fig 2.
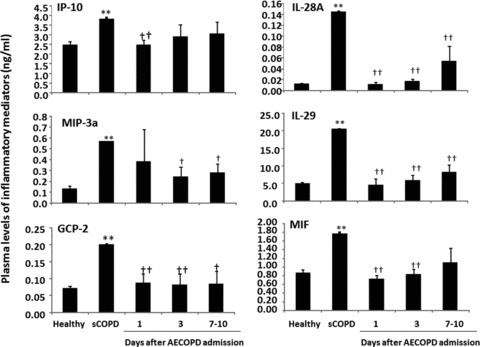
Plasma levels of interferon γ-induced protein 10 kD (IP-10), granulocyte chemotactic protein 2 (GCP-2), macrophage inflammatory proteins (MIP), macrophage migration inhibitory factor (MIF) and interleukin (IL)-28A and -29 in healthy, patients with stable COPD (sCOPD) and AECOPD patients on days 1, 3 and 7–10. * and ** stand for P values less than 0.05 and 0.01, respectively, as compared with healthy control. † and †† stand for P values less than 0.05 and 0.01, respectively, as compared with sCOPD patients.
Levels of Axl in sCOPD patients were significantly lower, while levels of GRO and lymphotactin were higher, as compared with the healthy or AECOPD patients on day 1 or day 1 and 3 (P < 0.05 or 0.01, respectively; Fig. 3). Levels of lymphotactin were significantly recovered when AECOPD patients were discharged, as compared to those on day 1. Levels of I-TAC, LIF, SDF-1a and TARC in sCOPD patients were significantly higher than healthy or AECOPD patients on day 1 and/or 3 (Fig. 4). AECOPD Patients had significantly lower levels of MSPa and higher levels of OPN at the early stage of the admission, as compared with healthy or sCOPD patients (P < 0.05 or 0.01, respectively; Fig. 4, Table 3).
Fig 3.
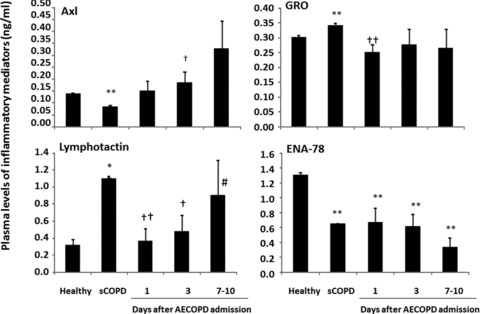
Plasma levels of tyrosin-protein kinase 7 (Axl), epithelial neutrophil activating protein 78 (ENA-78), growth-regulated oncogene (GRO) and lymphotactin in healthy, patients with stable COPD (sCOPD), and AECOPD patients on days 1, 3 and 7–10. * and ** stand for P values less than 0.05 and 0.01, respectively, as compared with healthy control. † and †† stand for P values less than 0.05 and 0.01, respectively, as compared with sCOPD patients.
Fig 4.
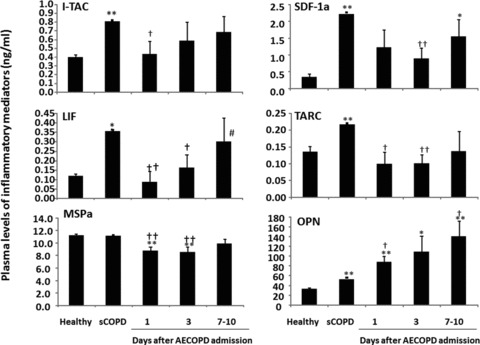
Plasma levels of interferon-inducible T cell α chemoattractant (I-TAC), leukaemia inhibitory factor (LIF), macrophage stimulating protein a (MSPa), osteopontin (OPN), stromal cell-derived factor-1a (SDF-1a) and thymus and activation-regulated chemokine (TARC) in healthy, patients with stable COPD (sCOPD) and AECOPD patients on days 1, 3 and 7–10. * and ** stand for P values less than 0.05 and 0.01, respectively, as compared with healthy control. † and †† stand for P values less than 0.05 and 0.01, respectively, as compared with sCOPD patients. # stands for P values less than 0.05, as compared with AECOPD patients on day 1.
Table 3.
Cytokines with statistically significance between different groups
| Cytokines | 1-N | 3-N | 7-N | 1-S | 3-S | 7-S | S-N |
|---|---|---|---|---|---|---|---|
| 6ckine | ↑ | ↑ | |||||
| Axl | ↓ | ||||||
| BTC | ↑ | ↑ | |||||
| CCL28 | ↓ | ↑ | |||||
| CTACK | ↑ | ↑ | ↑ | ↓ | ↓ | ↑ | |
| CXCL16 | ↑ | ||||||
| ENA 78 | ↓ | ↓ | ↓ | ↓ | |||
| GCP-2 | ↓ | ↓ | ↓ | ↑ | |||
| GRO | ↑ | ||||||
| HCC-1 | ↑ | ↑ | |||||
| HCC-4 | ↑ | ↑ | ↑ | ↑ | |||
| IL-9 | ↓ | ↓ | ↑ | ||||
| IL-18Bpa | ↓ | ↓ | ↓ | ↑ | |||
| IL-28A | ↓ | ↓ | ↓ | ↑ | |||
| IL-29 | ↓ | ↓ | ↓ | ↑ | |||
| IL-17F | ↑ | ||||||
| IL-31 | ↑ | ||||||
| IP-10 | ↓ | ↑ | |||||
| I-TAC | ↑ | ||||||
| LIF | ↓ | ↓ | ↑ | ||||
| LIGHT | ↓ | ↑ | |||||
| Lymphotactin | ↓ | ↓ | ↑ | ||||
| MCP-2 | ↑ | ↓ | ↑ | ||||
| MCP-3 | ↓ | ↓ | ↓ | ↑ | |||
| MCP-4 | ↑ | ↑ | |||||
| MDC | ↓ | ↓ | ↓ | ↓ | ↓ | ↓ | ↑ |
| MIF | ↓ | ↓ | ↑ | ||||
| MIP-3a | ↓ | ↓ | ↑ | ||||
| MIP-3b | ↑ | ||||||
| MPIF-1 | ↑ | ↑ | ↑ | ↑ | ↑ | ||
| MSPa | ↓ | ↓ | ↓ | ↓ | |||
| OPN | ↑ | ↑ | ↑ | ↑ | |||
| PARC | ↑ | ↑ | |||||
| SDF-1a | ↓ | ↑ |
↑: up; ↓: down; 1-N: AECOPD on initial-day versus normal people; 3-N: AECOPD on treatment-day versus normal people; 7-N: AECOPD on discharging-day versus normal people; 1-S: AECOPD on initial-day versus sCOPD; 3-S: AECOPD on treatment-day versus sCOPD; 7-S: AECOPD on treatment-day versus sCOPD; S-N: sCOPD versus normal people.
Levels of LIGHT, MCP-3 and MDC in AECOPD patients were significantly lower than healthy or sCOPD patients on admission day 1, while levels of MPIF-1 or MCP-4 were higher on days 1 and 3 or all days (P < 0.05 or 0.01, respectively; Fig. 5, Table 3). AECOPD patients with had significantly higher levels of MCP-2 than healthy, but lower than sCOPD patients. Levels of IL-9, CCL28, IL-18Bpa, CTACK and TECK in sCOPD patients were significantly higher than the healthy (P < 0.01; Fig. 6). AECOPD patients with on day 1 had significantly lower levels of IL-9, CCL28 and IL-18Bpa as compared with healthy or sCOPD patients (P < 0.05 or 0.01, respectively; Fig. 6). Levels of BTC in AECOPD patients on day 3 was significantly higher than healthy or sCOPD patients. AECOPD patients on days 1 and/or 3 have significantly higher levels of CTACK and TECK than the healthy, but lower than sCOPD patients.
Fig 5.
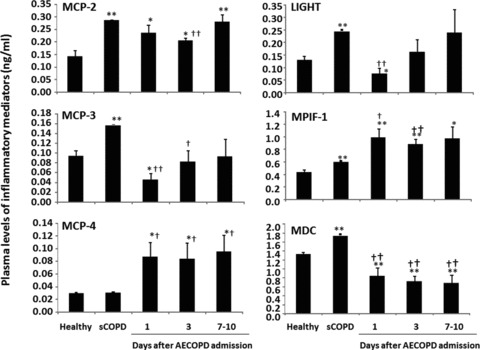
Plasma levels of lymphotoxin-like inducible protein that competes with glycoprotein D for herpesvirus entry on T cells (LIGHT), monocyte chemoattractant protein (MCP)-2, -3 and -4, macrophage-derived cytokine (MDC), myeloid progenitor inhibitory factor-1 (MPIF-1) in healthy, patients with stable COPD (sCOPD) and AECOPD patients on days 1, 3 and 7–10. * and ** stand for P values less than 0.05 and 0.01, respectively, as compared with healthy control. † and †† stand for P values less than 0.05 and 0.01, respectively, as compared with sCOPD patients.
Fig 6.
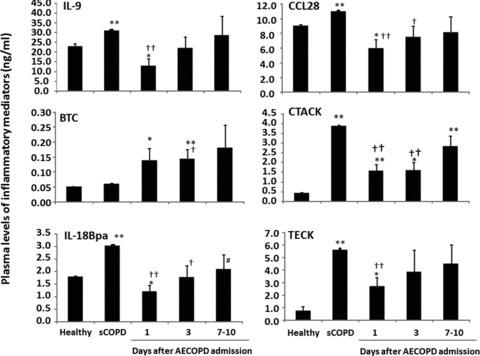
Plasma levels of betacellulin (BTC), C-C motif ligand 28 (CCL28), cutaneous T cell attracting chemokines/CCL27 (CTACK), interleukin (IL)-9 and-18Bpa, thymus expressed chemokine (TECK) in healthy, patients with stable COPD (sCOPD) and AECOPD patients on days 1, 3 and 7–10. * and ** stand for P values less than 0.05 and 0.01, respectively, as compared with healthy control. † and †† stand for P values less than 0.05 and 0.01, respectively, as compared with sCOPD patients.
Discussion
In the preliminary study, we developed a new protocol of biomarker evaluation by comparing systemic profiles of inflammatory mediators among different study groups, disease stages and severities, integrating clinical informatics and bioinformatics and understanding the biological function and signal networks, as summarized in Figure 7. It was highly recommend that validated biomarkers based on clinical proteomics should be integrated with medical imaging with clinical care, personalized treatment paradigms to reduce mortality and healthcare costs of chronic diseases [15]. We developed a new DESS to translate clinical information of patients into clinical informatics and assess severity of patients, even though a number of issues need to be further clarified and validated. An integrative systems biology research strategy could overcome limitations in identifying functional and regulatory pathways [16] and predicting multi-scale models ranging from the molecule to the organ levels. For example, the integration of BTC pathway, IL-9 pathway, CCR3 pathway and OPN pathway between biological function and pathology demonstrated cell proliferation-related remodelling, intracellular signal-associated inflammatory responses and overactivation of kinases-correlated emphysema in the pathogenesis of COPD, as shown in Figure 8. Signal networks of other factors found in this study were also explored and seen in supplement figures.
Fig 7.
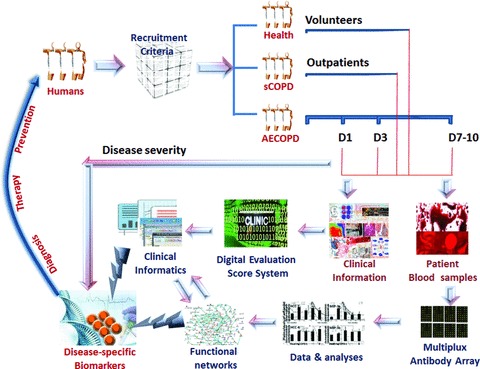
A new protocol of biomarker evaluation by comparing systemic profiles of inflammatory mediators among different study groups, disease stages and severities, integrating clinical informatics and bioinformatics, and understanding the biological function and signal networks. It is important to clarify recruitment criteria of healthy, sCOPD and AECOPD at different stages, and collect clinical information and blood sample. Clinical informatics is generated through a new Digital Evaluation Score System, while inflammatory mediators are measured by multiplex antibody array and followed by proteomics-based bioinformatics. Disease-specific biomarkers are identified by integrating clinical informatics and functional networks through the global proteomics data set, to develop diagnostics and predictive for personalized medicine and disease prevention.
Fig 8.
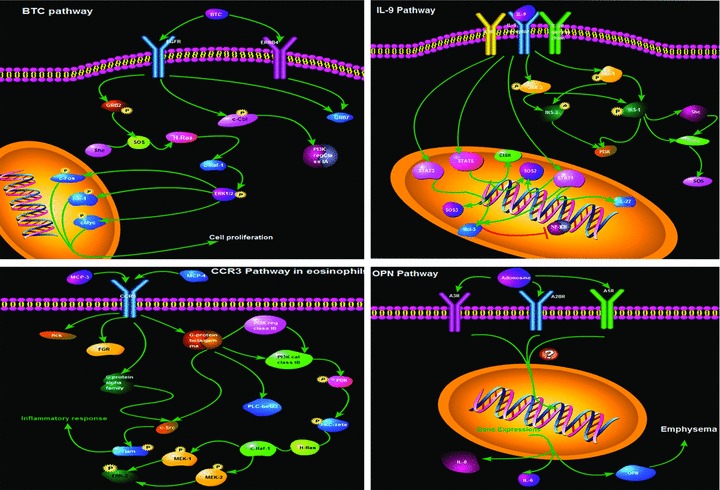
The integration of BTC pathway, IL-9 pathway, CCR3 pathway and OPN pathway between biological function and pathology demonstrated cell proliferation-related remodeling, intracellular signal-associated inflammatory responses and overactivation of kinases-correlated emphysia in the pathogenesis of COPD.
Oxidative stress, inflammation, tissue damage and remoulding are parts of the complex procedure in COPD. Inflammation is the key process in the pathogenesis of COPD, and other diseases such as asthma[17] and lung cancer [18], characterized by increased recruitment of inflammatory cells and overproduction of inflammatory mediator in the bronchoalveolar lavage fluid, sputum and lung tissues from COPD patients [19]. Systemic cytokine patterns were found to vary between different stages of COPD, because circulating markers of inflammation could be up-regulated in AECOPD patients and down-regulated after the recovery from the exacerbation [20]. Systemic cytokine profiles in COPD patients were suggested to be associated with airway and parenchymal phenotypes [21-23], reduced lung function and other clinical variables [24-26]. Our data demonstrated that most of systemic inflammatory mediators in sCOPD were higher, indicating that those patients may still maintain the status of inflammatory hyper-responsiveness to potential challenges.
We found four profile patterns of systemic inflammatory mediators: (1) sCOPD and AECOPD had similar alterations which may be disease-specific; (2) changes were only noticed in sCOPD patients, while down-regulated in patients with AECOP; (3) there were some variations between the admission and discharge of AECOPD patients and (4) AECOPD patients had specific changes differed from healthy or sCOPD patients. MPIF-1 and PARC were also found to significantly vary between baseline and exacerbation [7]. Key inflammatory chemokines produced during acute microbial infection include GRO-α, MCP-1, MCP-2, MCP-3, MCP-4, MIP-1α and MIP-1β [27]. Specific pro-inflammatory molecules from circulating monocytes, such as MCP-1, differed between healthy and COPD subjects [28, 29]. In this study, our findings supported the evidence, which implies that reasonable clinical parameters should be considered to select to correlate with systemic biomarkers.
It is difficult to obtain results of many proteins from ELISA measurement due to limitations in available sample volume and cost. Multiplex array has recently been shown to be more sensitive than standard ELISA once optimized for a particular cytokine [30-32]. The measurement of multiple cytokines is required for many diseases, particularly like COPD that results from a complex process of initiation and progression of inflammation network. Simultaneous detection of multiple cytokines will provide a more powerful tool to quantifiably measure cytokines in different stages of COPD. Our data demonstrated that multiplex array can serve as a fast, high-throughput and sensitive tool for identifying potential biomarkers and detecting levels of plasma cytokines.
Previous assessments such as BODE index [33] could be used to monitor and provide good predictive information in a clinical practice. However, they are graded with only partial variables that are not adequate for high-throughput analysis. It is critically important for proteomics and clinical scientists to explore the combination between advanced proteomic biotechnology, clinical proteomics, tissue imaging and profiling and organ dysfunction score systems, to improve the clinical outcomes of these patients [34]. Digitalizing essential clinical profiles, including symptoms and signs, helps to provide the potential to integrate the clinical informatics with bioinformatics, correlate molecular measurement with clinical direct vision for physicians and shrink the distance between lab discovery and clinical condition.
There is a growing need of the large-scale translational approach to evaluate databases generated from high-throughput experimental methods [35]. Given the systemic consequences of COPD, use of a composite index to assess prognosis provided a more comprehensive way to evaluate COPD [36]. According to plasma levels of inflammatory mediators and severities of clinical informatics, we found matched groups between clinical findings and inflammatory mediators at various stages of the disease (Fig. 9). It would be more helpful if there is a mathematical model to correlate proteomics-based bioinformatics with clinical informatics, so bioinformatics can be interpreted into clinical prediction and monitoring with the computational assistance. There is also a need to develop a simple and practical method which could serve as an aid in clinical practice and in the context of COPD research. As a preliminary study, our findings supported that our multi-factorial scoring system could be useful when assessing and monitoring outcomes in AECOPD patients, and has the potential in correlating bedside and bench information.
Fig 9.
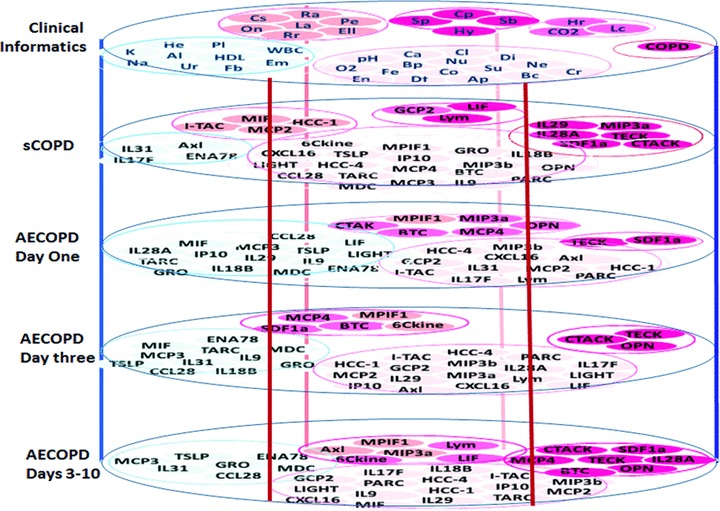
Characterized clusters of inflammatory mediators and severities of clinical informatics were mapped and distribution of scored groups was imaged. The score was calculated as the ratio ∇ (each value in disease group − correspondence value in healthy)/correspondence value in healthy. The score grades were divided into <1, <1, 1–1.5, 15–2, 2–3 and >3, from which matched groups of factors between clinical findings and inflammatory mediators were layered as various stages of the disease. Al: albumin; Ap: appetite; Bc: barrel chest; Bp: blood pressure; Ca: calcium; Cl: chloride; Co: consciousness; CO2: PaCO2; COPD: chronic obstructive pulmonary disease; Cp: chest pressure; Cr: C-reactive protein; Cs: cough severeness; Df: duration of fever; Di: diabetes mellitus; Ell: oedema of lower limbs; Em: emphysema; En: enlargement of lymph nodes; Fb: fasting blood glucose; Fe: fever; HDL: high-density lipid; He: haemoglobin; Hr: heart rate; Hy: hypertension; K: potassium; La: limitation of activity; Lc: lung consolidation; Na: sodium; Ne: neutrophil percentage; Nu: nutrition; O2: SaO2; On: orthopnoea at night; Pe: pleural effusion; pH: potential of hydrogen; Pl: platelet; Ra: rales; Rr: respiratory rate; Sb: short breathiness; Sp: sputum; Su: stool and urine; Ur: urea; WBC: white blood cells.
However, this study is limited by several factors, including small size of patient population, the selected mediators as the part in inflammatory network and the integration of biological function with clinical informatics. A larger study using additional chemokines and cytokines may be required to find specific biomarkers. The efficiency of DESS used in this study for clinical bioinformatics needs to be furthermore evaluated in future.
In conclusion, we explored the feasibility and reliability of using the novel chemokine multiplex antibody array to detect inflammatory mediators in the circulation of sCOPD patients or AECOPD. This study referred global proteome data sets and tried to integrate proteomics-based bioinformatics with clinical informatics, to scan disease-specific biomarkers in the circulation and establish a predictive multi-scale model between the molecular to the organ levels. We found 13 mediators in patients AECOPD significantly different from both healthy and sCOPD patients. There is a need to validate the predictive of those mediators in a large population of patients with COPD and clarify the specificity of them to AECOPD as comparing with levels in other pulmonary diseases.
Acknowledgments
The work was supported by Shanghai Leading Academic Discipline Project (Project Number: B115), Fudan University (Distinguished Professor Grant) and Shanghai Science & Technology Committee (08PJ1402900, 9540702600 and 08DZ2293104).
Conflict of interest
All authors have no conflict of interest.
Supporting Information
Additional Supporting Information may be found in the online version of this article:
Biological information of inflammatory mediators measured in the present study, including abbreviations, full names, ligands and receptors, cellular resources and related biological functions
Table S2 Variables and point values used for new score system (history and signs)
Table S3 Variables and point values used for new score system (signs)
Table S4 Variables and point values used for new score system (laboratory tests and imaging)
Table S5 Correlation between chemokines and DESS variables of symptoms (only P < 0.05 were showed)
Table S6 Correlation between chemokines and DESS variables of signs (only P < 0.05 were showed)
Table S7 Correlation between chemokines and DESS variables of laboratory tests (only P < 0.05 were showed)
Table S8 Correlation between chemokines and DESS variables of laboratory tests and imaging (only P < 0.05 were showed)
Please note: Wiley-Blackwell is not responsible for the content or functionality of any supporting materials supplied by the authors. Any queries (other than missing material) should be directed to the corresponding author for the article.
References
- 1.Celli BR, MacNee W. Standards for the diagnosis and treatment of patients with COPD: a summary of the ATS/ERS position paper. Eur Respir J. 2004;23:932–46. doi: 10.1183/09031936.04.00014304. [DOI] [PubMed] [Google Scholar]
- 2.Pauwels RA, Rabe KF. Burden and clinical features of chronic obstructive pulmonary disease (COPD) Lancet. 2004;364:613–20. doi: 10.1016/S0140-6736(04)16855-4. [DOI] [PubMed] [Google Scholar]
- 3.Fang X, Wang X, Bai C. COPD in China: the burden and importance of proper management. Chest. 2011;139:920–9. doi: 10.1378/chest.10-1393. [DOI] [PMC free article] [PubMed] [Google Scholar]
- 4.Donaldson GC, Seemungal TA, Patel IS, et al. Longitudinal changes in the nature, severity and frequency of COPD exacerbations. Eur Respir J. 2003;22:931–6. doi: 10.1183/09031936.03.00038303. [DOI] [PubMed] [Google Scholar]
- 5.Pauwels RA, Buist AS, Calverley PM, et al. Global strategy for the diagnosis, management, and prevention of chronic obstructive pulmonary disease. NHLBI/WHO Global Initiative for Chronic Obstructive Lung Disease (GOLD) Workshop summary. Am J Respir Crit Care Med. 2001;163:1256–76. doi: 10.1164/ajrccm.163.5.2101039. [DOI] [PubMed] [Google Scholar]
- 6.Hurst JR, Wedzicha JA. Chronic obstructive pulmonary disease: the clinical management of an acute exacerbation. Postgrad Med J. 2004;80:497–505. doi: 10.1136/pgmj.2004.019182. [DOI] [PMC free article] [PubMed] [Google Scholar]
- 7.Hurst JR, Donaldson GC, Perera WR, et al. Use of plasma biomarkers at exacerbation of chronic obstructive pulmonary disease. Am J Respir Crit Care Med. 2006;174:867–74. doi: 10.1164/rccm.200604-506OC. [DOI] [PubMed] [Google Scholar]
- 8.Sapey E, Stockley RA. COPD exacerbations. 2: Aetiology. Thorax. 2006;61:250–8. doi: 10.1136/thx.2005.041822. [DOI] [PMC free article] [PubMed] [Google Scholar]
- 9.Wouters EF, Groenewegen KH, Dentener MA, et al. Systemic inflammation in chronic obstructive pulmonary disease: the role of exacerbations. Proc Am Thorac Soc. 2007;4:626–34. doi: 10.1513/pats.200706-071TH. [DOI] [PubMed] [Google Scholar]
- 10.He Z, Chen Y, Chen P, et al. Local inflammation occurs before systemic inflammation in patients with COPD. Respirology. 2010;15:478–84. doi: 10.1111/j.1440-1843.2010.01709.x. [DOI] [PubMed] [Google Scholar]
- 11.Pinto-Plata VM, Livnat G, Girish M, et al. Systemic cytokines, clinical and physiological changes in patients hospitalized for exacerbation of COPD. Chest. 2007;131:37–43. doi: 10.1378/chest.06-0668. [DOI] [PubMed] [Google Scholar]
- 12.Wedzicha JA, Seemungal TA, MacCallum PK, et al. Acute exacerbations of chronic obstructive pulmonary disease are accompanied by elevations of plasma fibrinogen and serum IL-6 levels. Thromb Haemost. 2000;84:210–5. [PubMed] [Google Scholar]
- 13.Pinto-Plata V, Toso J, Lee K, et al. Profiling serum biomarkers in patients with COPD: associations with clinical parameters. Thorax. 2007;62:595–601. doi: 10.1136/thx.2006.064428. [DOI] [PMC free article] [PubMed] [Google Scholar]
- 14.Eagan TM, Ueland T, Wagner PD, et al. Systemic inflammatory markers in COPD: results from the Bergen COPD Cohort Study. Eur Respir J. 2010;35:540–8. doi: 10.1183/09031936.00088209. [DOI] [PubMed] [Google Scholar]
- 15.Kato H, Nishimura T, Ikeda N, et al. Developments for a growing Japanese patient population: facilitating new technologies for future health care. J Proteomics. 2011;74:759–64. doi: 10.1016/j.jprot.2010.12.006. [DOI] [PubMed] [Google Scholar]
- 16.Auffray C, Adcock IM, Chung KF, et al. An integrative systems biology approach to understanding pulmonary diseases. Chest. 2010;137:1410–6. doi: 10.1378/chest.09-1850. [DOI] [PubMed] [Google Scholar]
- 17.Shen Y, Wang Y, Chen Z, et al. Role of aquaporin 5 in antigen-induced airway inflammation and mucous hyperproduction in mice. J Cell Mol Med. 2011;15:1355–63. doi: 10.1111/j.1582-4934.2010.01103.x. [DOI] [PMC free article] [PubMed] [Google Scholar]
- 18.Zhang Y, Wang L, Zhang M, et al. Potential mechanism of interleukin-8 production from lung cancer cells: an involvement of EGF-EGFR-PI3K-Atk-Erk pathway. J Cell Physiol. 2011 doi: 10.1002/jcp.22722. ; doi: 10.1002/jcp.22722. [DOI] [PubMed] [Google Scholar]
- 19.Chen H, Wang D, Bai C, et al. Proteomics-based biomarkers in chronic obstructive pulmonary disease. J Proteome Res. 2010;9:2798–808. doi: 10.1021/pr100063r. [DOI] [PubMed] [Google Scholar]
- 20.Valipour A, Schreder M, Wolzt M, et al. Circulating vascular endothelial growth factor and systemic inflammatory markers in patients with stable and exacerbated chronic obstructive pulmonary disease. Clin Sci (Lond) 2008;115:225–32. doi: 10.1042/CS20070382. [DOI] [PubMed] [Google Scholar]
- 21.Bon JM, Leader JK, Weissfeld JL, et al. The influence of radiographic phenotype and smoking status on peripheral blood biomarker patterns in chronic obstructive pulmonary disease. PLoS One. 2009;4:e6865. doi: 10.1371/journal.pone.0006865. [DOI] [PMC free article] [PubMed] [Google Scholar]
- 22.Schols AM, Buurman WA, Staal van den Brekel AJ, et al. Evidence for a relation between metabolic derangements and increased levels of inflammatory mediators in a subgroup of patients with chronic obstructive pulmonary disease. Thorax. 1996;51:819–24. doi: 10.1136/thx.51.8.819. [DOI] [PMC free article] [PubMed] [Google Scholar]
- 23.Kythreotis P, Kokkini A, Avgeropoulou S, et al. Plasma leptin and insulin-like growth factor I levels during acute exacerbations of chronic obstructive pulmonary disease. BMC Pulm Med. 2009;9:1–10. doi: 10.1186/1471-2466-9-11. [DOI] [PMC free article] [PubMed] [Google Scholar]
- 24.Gan WQ, Man SF, Senthilselvan A, et al. Association between chronic obstructive pulmonary disease and systemic inflammation: a systematic review and a meta-analysis. Thorax. 2004;59:574–80. doi: 10.1136/thx.2003.019588. [DOI] [PMC free article] [PubMed] [Google Scholar]
- 25.Thorleifsson SJ, Margretardottir OB, Gudmundsson G, et al. Chronic airflow obstruction and markers of systemic inflammation: results from the BOLD study in Iceland. Respir Med. 2009;103:1548–53. doi: 10.1016/j.rmed.2009.04.005. [DOI] [PMC free article] [PubMed] [Google Scholar]
- 26.de Torres JP, Casanova C, Pinto-Plata V, et al. Gender differences in plasma biomarker levels in a cohort of COPD patients: a pilot study. PLoS One. 2011;6:e16021. doi: 10.1371/journal.pone.0016021. [DOI] [PMC free article] [PubMed] [Google Scholar]
- 27.Mantovani A. The chemokine system: redundancy for robust outputs. Immunol Today. 1999;20:254–7. doi: 10.1016/s0167-5699(99)01469-3. [DOI] [PubMed] [Google Scholar]
- 28.Aldonyte R, Jansson L, Piitulainen E, et al. Circulating monocytes from healthy individuals and COPD patients. Respir Res. 2003;4:1–8. doi: 10.1186/1465-9921-4-11. [DOI] [PMC free article] [PubMed] [Google Scholar]
- 29.Liu SF, Chin CH, Wang CC, et al. Correlation between serum biomarkers and BODE index in patients with stable COPD. Respirology. 2009;14:999–1004. doi: 10.1111/j.1440-1843.2009.01608.x. [DOI] [PubMed] [Google Scholar]
- 30.Ray CA, Bowsher RR, Smith WC, et al. Development, validation, and implementation of a multiplex immunoassay for the simultaneous determination of five cytokines in human serum. J Pharm Biomed Anal. 2005;36:1037–44. doi: 10.1016/j.jpba.2004.05.024. [DOI] [PubMed] [Google Scholar]
- 31.Elshal MF, McCoy JP. Multiplex bead array assays: performance evaluation and comparison of sensitivity to ELISA. Methods. 2006;38:317–23. doi: 10.1016/j.ymeth.2005.11.010. [DOI] [PMC free article] [PubMed] [Google Scholar]
- 32.Trune DR, Larrain BE, Hausman FA, et al. Simultaneous measurement of multiple ear proteins with multiplex ELISA assays. Hear Res. 2010;275:1–7. doi: 10.1016/j.heares.2010.11.009. [DOI] [PMC free article] [PubMed] [Google Scholar]
- 33.Celli BR, Cote CG, Marin JM, et al. The body-mass index, airflow obstruction, dyspnea, and exercise capacity index in chronic obstructive pulmonary disease. N Engl J Med. 2004;350:1005–12. doi: 10.1056/NEJMoa021322. [DOI] [PubMed] [Google Scholar]
- 34.Wang X, Adler KB, Chaudry IH, et al. Better understanding of organ dysfunction requires proteomic involvement. J Proteome Res. 2006;5:1060–2. doi: 10.1021/pr050441n. [DOI] [PubMed] [Google Scholar]
- 35.Riva A, Nuzzo A, Stefanelli M, et al. An automated reasoning framework for translational research. J Biomed Inform. 2010;43:419–27. doi: 10.1016/j.jbi.2009.11.005. [DOI] [PMC free article] [PubMed] [Google Scholar]
- 36.Celli BR. Predictors of mortality in COPD. Respir Med. 2010;104:773–9. doi: 10.1016/j.rmed.2009.12.017. [DOI] [PubMed] [Google Scholar]
Associated Data
This section collects any data citations, data availability statements, or supplementary materials included in this article.
Supplementary Materials
Biological information of inflammatory mediators measured in the present study, including abbreviations, full names, ligands and receptors, cellular resources and related biological functions
Table S2 Variables and point values used for new score system (history and signs)
Table S3 Variables and point values used for new score system (signs)
Table S4 Variables and point values used for new score system (laboratory tests and imaging)
Table S5 Correlation between chemokines and DESS variables of symptoms (only P < 0.05 were showed)
Table S6 Correlation between chemokines and DESS variables of signs (only P < 0.05 were showed)
Table S7 Correlation between chemokines and DESS variables of laboratory tests (only P < 0.05 were showed)
Table S8 Correlation between chemokines and DESS variables of laboratory tests and imaging (only P < 0.05 were showed)


