

Abstract
The fluorescent dye Lucifer yellow (LY) was introduced in 1978, and has been extremely useful in studying cell structure and communications. This dye has been used mostly for labelling cells by intracellular injection from microelectrodes. This review describes the numerous applications of LY, with emphasis on the enteric nervous system and interstitial cells of Cajal. Of particular importance is the dye coupling method, which enables the detection of cell coupling by gap junctions.
Keywords: intracellular labelling, gap junctions, dye coupling, Lucifer yellow, enteric neurons, interstitial cells of Cajal
Introduction
Progress in biomedical research depends on the introduction of ever newer methods and tools. For example, in the field of light microscopy we are now witnessing a constant introduction of innovative methods: confocal microscopy, three-dimensional reconstruction, multi-photon microscopy, total internal reflection fluorescence (TIRF), near-field optics, spatially modulated illumination microscopy, etc. In addition to these modern hardware and software there are numerous novel cell labelling methods, and better chromophores and other devices (e.g. quantum dots) for labelling antibodies and for studying cell morphology and projections (for reviews, see Refs. [1] and [2]). Therefore it is surprising that some methods keep being used with no major changes for several decades. Among those few tools that prove to be immune to obsolescence are the use of the enzyme horseradish peroxidase (HRP) for nerve tracing and protein detection and the fluorescent tracer LY for cell labelling and for detecting intercellular coupling by gap junctions. LY was introduced in 1978 and is still one the most widely used tracer molecules, despite of the subsequent introduction of numerous other tracers. This review will highlight the main uses of LY, with emphasis on enteric neurons and interstitial cells of Cajal (ICC), which are two cell types that play crucial roles in regulating gastrointestinal functions [3, 4]. As these cells are embedded in muscle, visualizing them, particularly in live tissue, has been a considerable challenge. Work with LY has greatly helped in labelling these cells and understanding their functions.
A very brief history of intracellular labelling techniques
Electrical recording from single cells such as neurons and ICC with glass micropipettes (intracellular sharp electrodes and patch pipettes) is an extremely useful method to characterize the electrical properties of cells. A disadvantage of this method is that in most cases the morphology (and hence in many cases, the identity) of the recorded cell is not certain. A way to solve this problem is to inject a tracer molecule from the recording electrode into the cell, but this proved to be rather difficult because of the absence of suitable molecules. There are several requirements for a good tracer molecule, which are as follows:
Solubility in water, to enable dissolution of the tracer in the microelectrode solution and in the spread within the cell. This property is associated with the need for hydrophilic molecule, to prevent leakage from the injected cell.
A net electrical charge, to facilitate injection by electrical current. This requirement is not crucial as it appears that electrical current drives water into the cell, and the tracer may flow into the cell with the water (solvent drag). Pressure ejection is possible, but is rarely used for this purpose.
Non-toxicity to avoid damage to the injected cell.
Detectability is probably the most important property of a tracer, and refers to the amount of the tracer that has to be injected to allow cell visualization. A good non-fluorescent tracer must have high absorbance, whereas a good fluorescent tracer should have both high absorption efficiency and high emission efficiency (quantum yield). This is crucial for detecting fine cellular appendages, such as thin processes of neurons.
Fixability, that is, the ability of the tracer to remain bound to cell constituents and not be lost during tissue processing. For further discussion of this topic, see Refs. [5–9].
The first molecules that were used for cell identification by intracellular injection were non-fluorescent dyes. A notable example of the use of such dyes is the work of Werblin and Dowling [10], who made the first systematic correlation between cell identity and electrophysiology in the vertebrate retina. They injected the dye Niagara blue into physiologically identified retinal cells. For visualization, it was necessary to inject large amounts of the dye, requiring extreme measures, such as applying a very high voltage (400 V) to the electrodes. As Niagara blue did not label cell processes it did not provide information on cell morphology, but only indicated cell location. However, due to the layered structure of the retina, this method provided reliable correlation between function and cell identity.
As microscopy based on fluorescence is much more sensitive than light absorption of dyes, there was an intense search for fluorescent molecules for intracellular injection. Stretton and Kravitz [11] described the first injection of the fluorescent dye Procion Yellow M4RS into neurons in lobster ganglia. An advantage of this dye was that it was stable upon fixation, apparently due to the formation of covalent bonds with cell constituents. Procion yellow proved to be useful in correlating structure function of neurons, but its low quantum yield was a serious drawback, because a large amount had to be injected to allow cell observation. Stewart [5, 12] revolutionized this field by introducing the dye LY CH (Fig. 1), which is fixable and highly fluorescent. (‘Lucifer’, written in capital L (12), is one of the names of Satan; but the reason for this choice has not been explained.) LY has been used in thousands of studies and contributed to the research of numerous cell types. Researchers found ways to use LY not only for intracellular staining, but for a host of other methods.
Fig 1.
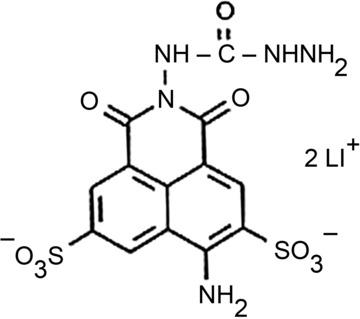
The molecular structure of Lucifer yellow CH, Li+ salt.
An important use of LY, and in particular for glia, smooth muscle and ICC is for detecting cell-to-cell coupling by gap junctions (dye coupling). Before the advent of LY, investigators used fluo-rescein and its derivatives for this purpose [13, 14], and it was reported that fluorescein passes only through gap junctions and does not permeate plasma membranes. However, a later study [15] showed that fluorescein crosses plasma membrane, whereas LY does not. Therefore, LY is much preferred for dye coupling experiments, and indeed it has replaced fluorescein for this type of work.
Methods for loading cells with LY
Intracellular injection
As LY has two negative charges, it can be injected into cells by passing negative electric current [5]. The amount of actual current that can be used depends on the resistance of the electrode. With high-resistance electrodes (>100 MΩ), the current that can be passed is limited, and there is a tendency for electrode blockade. Currents of 1–2 nA are sufficient in most cases. Practice has shown that pulses work better than DC currents; for example 100 msec. long pulses at 5 Hz [16]. As mentioned, positive currents will also inject this dye, due to solvent drag. When using patch pipettes, which have low resistance (typically 3–5 MΩ), diffusion of the dye into the cell will suffice to stain it. One minor drawback of LY is the low solubility of its potassium salt. This restricts the concentration of LY that can be dissolved in KCl-containing electrodes, which are the most common ones. To overcome this problem LY is dissolved in aqueous solution of LiCl [5]. Usually LY is dissolved at concentration of 2–5% in 0.5–1M LiCl. LY will not precipitate in KCl when its concentration is about 0.5% or lower. Such concentration may not provide ideal staining, but will be adequate for cell identification. The duration of the injection to achieve good staining is about 3 min. [5, 16], and longer injections offer no advantage. Numerous studies using the injection method yielded excellent images of cells, and also important information on their electrical properties and synaptic connectivity. Examples of cells stained by this method are shown in Figure 2.
Fig 2.
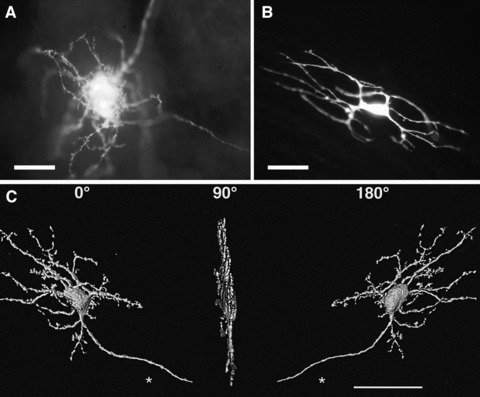
Intracellular labelling of cells with LY. (A) A neuron in the guinea-pig inferior mesenteric ganglion. LY was injected into the cell body, and the dye spread by diffusion into the neuronal processes. (B) ICC in the deep muscular plexus in the guinea-pig small intestine. (C) Three-dimensional reconstruction of a filamentous type neuron in the guinea-pig small intestine. The image is also shown rotated as 90° and 180°. These confocal images show that the neuron is quite flat and that all the processes are essentially confined to a single plane. Such information is not readily available when regular microscopy is used. From Ref. [39]. Calibrations: (A) 50 μm; (B) 10 μm and (C) 50 μm.
A major advantage in injecting fluorescent tracers over non-fluorescent tracers, such as neurobiotin and HRP, is the ability to observe the injected cell in real time, using epifluorescent optics. This allows the direct identification of the injected cells, which is crucial when several cells are injected in the neighbourhood, or when dye coupling takes place. Direct observation also informs the investigator when the cell is filled sufficiently. In experiments aimed to correlate between morphology and electrophysiology, LY may not be ideal because the electrodes tend to clog and their resistance increases, making the recordings less reliable (see section ‘Electrophysiological studies using LY-filled electrodes’).
The discussion earlier dealt with live tissues where cell impalement with the electrode is indicated by the presence of resting potential. It has been found that LY can be injected with microelectrodes into cells in fixed tissues. This is useful when fresh tissue cannot be obtained, for example for human specimens obtained from post-mortem material [17]. The injection of LY allows a detailed characterization of the morphology of immuno-labelled cells [18].
Scrape loading
Intracellular dye injection is not a simple technique and requires specialized equipment and some expertise. Also, cells are injected individually, which limits the number of cells that can be studied. A technique that circumvents these problems is termed ‘scrape loading’[19–22]. Cells are usually in tissue culture and form layer on the bottom of a dish. The dye is dissolved in the bathing solution and a straight cut is made with a sharp blade in the cell layer. The injured cells take up the dye and become labelled. This method is particularly useful for dye coupling work. Its disadvantage is that it is largely suitable for cell culture.
Electroporation
By application of strong electric fields cells can acquire pores that allow the passage of large and/or hydrophilic molecules. This method has been introduced for labelling cells with LY [23]. Electric fields of about 500 V/cm are required. It has been reported that removal of the electrodes can dislodge cultured cells and special electrodes were devise to overcome this problem [24].
Ballistic loading
This method is based on injection by pressure of small particles (gold or tungsten with diameter of about 1 μm), coated with the molecule of interest [25]. This method has been used largely for gene transfer (DNA gun), but it has been employed for loading cells with LY [26].
Uptake of LY into cells by endocytosis?
There is evidence that in spite of LY being hydrophilic it can be taken up by cells. Sarthy et al. [27] found that LY was taken up into retinal bipolar cells of several species, this took place only in medium with low Ca2+ concentration and did not depend on synaptic activity. Other dyes, such as Procion yellow were less effective. The mechanisms underlying this selective uptake are not known, but this property can serve as a useful tool for studying a specific cell population. An example of a selective uptake of a fluorescent dye is the rather specific labelling of a subtype of retinal amacrine cells by the nuclear marker DAPI [28]. It was suggested that this uptake occurred by endocytosis and was related to the greater activity of the cells. Zimmerman [29] has used a similar method to label neurons and glial cells with LY in the retina and spinal cord. Smith et al. [30] described a method for studying cell pathology using endocytic uptake of LY.
In the developing retina, LY labelled horizontal cells rather than bipolar cells [31], which indicates that several factors are involved in the uptake process. With the recent introduction of various staining techniques, this method of cell staining did not find wide use. Still, a detailed study of the underlying mechanisms is worthwhile. Indeed, the use of LY for detecting membrane channels (section ‘LY uptake by hemichannels, pannexins and P2×7 receptors’) proved that LY can pinpoint specific uptake mechanisms. It is conceivable that the mechanisms operating in the articles mentioned above involved the contribution of such channels.
Potential methods for loading LY into cells
There are several ways to introduce molecules into cells that have not been explored yet for LY. For example, a common method is using hydrophobic derivatives, which easily enter into cells and then are broken down into the desired hydrophilic molecules. An important group of these substances are the acetomethoxy (AM) esters of various molecules, which are broken by intracellular esterases into hydrophilic products. AM esters are being used extensively for introducing ion indicators into cells and proved to be very powerful for measuring changes in Ca, Na and Cl ions. The disadvantage is that all cells in the tissue become labelled.
Caged tracers are weakly- or non-fluorescent when key functional groups of fluorophores are masked by photolabile protecting groups (cages). Photoactivation, performed by intense focused illumination, removes the protecting group (uncaging) and abruptly switches on the fluorescence of parent dyes. The caged chromophores are introduced into cells as AM esters. This allows the investigator to fill cells with the tracer at exact location and timing. This method has not been yet employed with LY.
Electrophysiological studies using LY-filled electrodes
Stewart [5, 12] has emphasized the utility of LY in intracellular electrical recordings for correlating between structure and function. There is no alternative to direct visualization of cells during the recordings. Indeed, numerous investigators used this approach; for example to record from retinal bipolar cells [32], hypothalamic neurons [33] and myenteric neurons [34]. One disadvantage of LY is that fine-tipped electrodes filled with LY solution that are required for recording from small cells, tend to clog, which greatly increases their resistance. This reduces the amount of dye that can be injected and causes problems in the electrical recordings (adding noise and limiting the amount of injected current). Still, with careful technique, excellent function-structure correlation is feasible, even with retinal bipolar cells, which are less than 10 μm in diameter [32]. Since the introduction of LY, several alternative tracers have been developed, including fluorescent ones (e.g. carboxyfluorescein and Alexa dyes). A remedy for the problems mentioned earlier was to use non-fluorescent dyes such as biocytin and neurobiotin. Microelectrodes filled with these tracers do not tend to clog, and are clearly superior for recordings than those filled with LY. The morphological results obtained with biocytin and neurobiotin are excellent, with the disadvantages that several processing steps are needed and that unlike the fluorescent tracers, these tracers cannot be visualized during the recordings, which may leave a certain doubt about cell identification. A way to solve this problem is to add a small amount (0.3% or less) of LY into the electrode containing these tracers [35].
Tasker et al. [7] compared LY, the fluorescent dye ethidium bromide and biocytin for intracellular recordings and staining in hypothalamic neurons. They concluded, that overall, the electrical recordings with biocytin were the best. For morphology both biocytin and LY gave good results, but biocytin was superior for combined morphology and immunohistochemistry.
It has been found [7, 36] that the lithium ions, which must be used with LY (at 0.5–1M in the electrode solution), are detrimental to neurons, leading to depolarization of membrane potential by 2–23 mV, and increasing input chord conductance by 552–796%[36]. These extreme values were observed after many minutes of injection, and therefore the problem can be largely avoided by recording the electrical properties of the neurons shortly after impaling the neurons, and only then injecting the dye. It should be added that biocytin, too, has been found to have adverse effects on the electrical properties of neurons [37], and thus the perfect tracer has still to be found. The account above was on intracellular recordings with sharp electrodes. In experiments where patch electrodes have been used, the problem with lithium is largely avoided because the small concentration of LY that is being used (0.02%) [38]. Under these conditions K+ or other cations are at high concentrations (around 100 mM), whereas if the Li+ salt of LY is used, the Li+ concentration will be around 5 mM, and its leakage into the cell will be minimal. Moreover, at such low LY concentration, its K+ salt rather than Li+ one can be used. Indeed, no changes in electrophysiological properties have been reported in patch clamp experiments where LY was used.
Another potential problem in electrophysiological experiments where LY is used is the photodynamic damage to cells due to the bright illumination needed to visualize the dye (see section ‘Using LY for selective ablation of cells’). This problem can be largely avoided by using the very sensitive charge coupled device cameras that are now available.
Studying cell morphology with LY
Early work has shown that injecting single cells with LY provides a picture of the cells with extraordinary detail. The image by Stewart [13] of an LY-injected leech neuron on the cover of Nature is very memorable. Apparently LY can diffuse into very fine processes, providing highly detailed picture of cell morphology, which resembles Golgi staining. However, in contrast with the Golgi method, which is highly variable and unpredictable, LY injection is quite predictable. This is in addition to the ability to learn about the physiology of the injected cell. With the advent of con-focal microcopy and three-dimensional reconstruction, LY labelling yields extremely fine detail of cell morphology, for example Refs. [39–41]. Labelling with LY in combination with immuno-histochemistry has a great added value. Examples of intracellular labelling of neurons and an ICC are shown in Figure 2. Confocal images of LY-labelled satellite glial cells in dorsal root ganglion are shown in Figure 3.
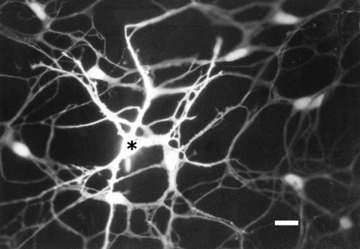
Fig 3.
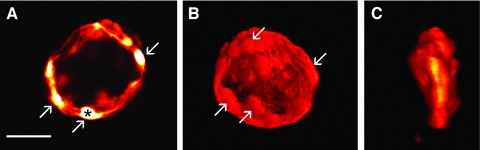
Confocal microscopy of satellite glial cells in the guinea-pig dorsal root ganglion. (A) A single confocal slice. LY was injected into the cell marked with an asterisk, and the dye spread into other glial cells that make an envelope around a sensory neuron (which is not labelled). Some of the glial cells are indicated with an arrow. (B) Three-dimensional reconstruction of the cells shown in (A). (C) The same cells shown in (B) are displayed at 90° rotation. Calibration bar = 50 μm.
The advantages of using LY for studying cell morphology are evident in studies on astrocytes. The common immunolabelling of astrocyte for specific proteins (e.g. glial fibrillary acidic protein, or S100) provides an incomplete picture of the cells. Injecting astrocytes with LY or other intracellular tracers, reveals that these cells are extremely branched and have a bushy appearance, which is largely missing with immunolabelling [42, 43].
Using LY to study intercellular communication
The dye coupling method for gap junction detection and characterization
Gap junctions (or electrical synapses) are almost a ubiquitous means for cell communications; these are channels connecting adjacent cells, and consist of proteins called connexins. They allow the passage of ions and molecules of molecular weight of up to about 1000 Da. As the molecular weight of LY is 457.3 Da (including two Li+ ions), it can easily pass through gap junctions [8, 44, 45]. This ability (termed ‘dye coupling’) has been exploited in the early studies on LY [5, 16], and since then has been used in hundreds of studies.
The gold standard for identifying gap junctions is electron microscopy (EM; transmission or freeze fracture). However, in certain cases gap junctions are missed by EM [46, 47]. In these cases, dye coupling studies helped to confirm their presence [47, 48]. A plausible explanation for this discrepancy is that the individual gap junctions are not organized into nexuses (plaques), and therefore are not visible with the EM. Another example where there was no ultrastructural evidence for gap junctions, but dye coupling between neurons was present, was obtained in sensory ganglia after peripheral inflammation [49]. Conversely, there are cases where there is clear evidence for electrical coupling between cells by gap junctions, but not for dye coupling [50]. The reasons for this failure could be an insufficient passage of the dye, or lower sensitivity of the detection system.
Dye coupling experiments with LY have been carried out on numerous cell types and tissues, including liver [51], heart [51, 52], neurons [51, 53], astrocytes [54], enteric glia [55, 56], epithelial cells [57], glands [58], smooth muscles [47, 48] and ICC [35, 59–62]. In most studies, intracellular injection was used, but other methods of application have also been employed, particularly scrape loading [21]. Examples of dye coupling using LY are shown in Figures 3–5.
Fig 5.
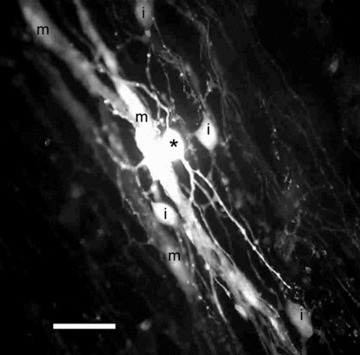
Dye coupling in the deep muscular plexus (DMP) region of guinea-pig small intestine. An ICC-DMP was injected with LY (asterisk), and the dye spread not only to other ICC-DMP (i), but also to smooth muscle cells (m) in the circular muscle layer. This is the first direct demonstration of ICC– muscle coupling in the DMP. Calibration bar = 20 μm. Image by T. Kobilo.
Fig 4.
Dye coupling among ICC in the myenteric plexus region of guinea-pig small intestine. The injected cell is marked with an asterisk. Note the gradual decline in staining intensity with the distance from the injected cell. Calibration bar = 20 μm. Image by V. Belzer.
In some cases, other tracers revealed coupling where the use of LY failed to demonstrate them; for example Neurobiotin or bio-cytin, which are smaller molecules [63]. This may be due to the lower permeability of specific connexin types to LY [64]. In other cases, there was no advantage to using these tracers. Moreover, Neurobiotin and biocytin require additional processing and are not visible in live tissues. It should be added that there is not always a strict correlation between molecular size and permeability through gap junctions [65]. Still, it will be very beneficial to develop fluorescent molecules with lower molecular weight than LY for better characterization of cell coupling.
LY uptake by hemichannels, pannexins and P2×7 receptors
Normally LY will not enter cells from the outside solution because of its hydrophilic nature, but when channels that are large enough to allow it to enter the cell are present in the plasma membrane (and are open), this dye will label the cell. The high fluorescence and low molecular weight of LY make it very suitable for detecting such channels. LY has been useful for detecting channels such as pannexins, hemichannels and P2×7 purinergic receptors [45, 66, 67]. Identification of the channel is performed by using blockers; for example carbenoxolone for pannexins and gap junctions [45], and brilliant blue green for P2×7 [68]. Immunohistochemistry and other methods can provide further details on the molecular identity of the channels.
Fluorescence recovery after photobleaching (FRAP)
The dye coupling method is not always amenable to quantitation and usually the only parameter that is measured is the number of cells coupled to the injected one. The scrape loading method is easy to quantitate, but is rather crude. Another approach is FRAP, which is based on labelling coupled cells with a fluorescent molecule and then bleaching a small area of the cells with bright light. If the cells are coupled, the dye will diffuse via gap junctions from the non-bleached into the bleached cells, and the increase in the fluorescence in these cells can be measured as the function of time. LY has been used extensively is these studies [69]. This method is used mostly in cell cultures.
Retrograde labelling with LY
Stewart [12] showed that LY can be introduced into neurons not only by intracellular injection, but also by uptake. This method is useful for tracing the projections of neurons, and is known as ‘back filling’ or ‘retrograde labelling’. Stewart placed the cut end of a snail axon in an LY solution, and to assist the diffusion of the dye to the cell body, an electric current was passed between the cut end and the soma. This resulted in labelling of the soma. It should be added that LY is not widely used for retrograde labelling, probably because it is a polar molecule and is not readily taken up by intact cells. Other molecules, having more lipophilic nature are usually employed for this purpose, for example fast blue, fluoro-gold and DiI [70–72]. Proteins such as HRP attached to wheat germ agglutinin are also useful for retrograde labelling [73].
Photoconversion of LY
A disadvantage of fluorescent dyes is that they tend to fade under the intense illumination used to visualize them, and also in the dark over time. Maranto [74] suggested a method to convert LY in cells into a stable product that is visible under bright field illumination. This was achieved by illuminating the LY-labelled cells with blue light used for its detection, in the presence of diaminobenzidine (DAB). This converts the LY into brown precipitate. Apparently illumination produces reactive compounds such as free radicals that oxidize DAB, converting it into insoluble product. An important benefit of this method is that the reaction product is visible under EM. This technique has been used for neurons [74, 75], and for other cell types such as ICC [76] (Fig. 6). This method has been also combined with immunohistochemistry [77].
Fig 6.
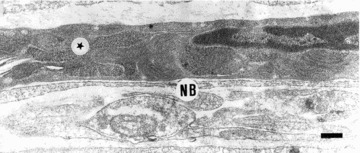
Photoconversion of LY. An ICC (star) in the myenteric plexus region of the guinea-pig ileum was injected with LY and then photoconverted. The photoconversion was performed by illuminating fixed tissue in phosphate buffer (pH 7.3) with bright blue light from a fluorescence microscope in the presence of diaminobenzidine (2 mg/ml) for 30–45 min. This resulted in the formation of fine electron-dense precipitate that is evenly distributed within the cytoplasm in the cell, and can be observed with the EM. A nerve bundle (NB) runs along this ICC. Note the similarity with Figure 5. Scale bar = 0.2 μm. Modified from Ref. [76].
Combination of LY labelling with other methods
As LY is fixable, it is easy to use cells labelled with this dye for other applications. It has been shown that LY-labelled cells could be fixed and then labelled with antibodies against various relevant molecules [78]. This approach can answer important question on whether certain cells contain molecules such as neurotransmitters or receptors, and enables the localization of these molecules—in neuronal dendrites, axons, near the cell membrane, etc. With confocal microscopy this information can be quantified to provide the density of the labelling. For example we mapped acetylcholine receptors in LY-labelled neurons in the enteric nervous system [79]. Confocal microscopy allowed the three-dimensional reconstruction of the neurons, and labelling acetylcholine receptors with fluorescent molecules enabled their precise localization on the cells’ surface and also calculation of the percentage of each of the cells compartments (dendrites, etc.) occupied by the receptors. Using LY injections, electrophysiology and immunohistochemistry, the physiology, morphology and content of neurotransmitters have been correlated in myenteric [34, 80] and submucosal [81] neurons.
Using a combination of intracellular staining of ICC with LY and immunolabelling of nerve fibres, we were able to learn about the pattern of ICC innervation in the guinea-pig small intestine (Fig. 7). Confocal microscopy enabled the quantitation of the extent of the innervation of ICC [82].
Fig 7.
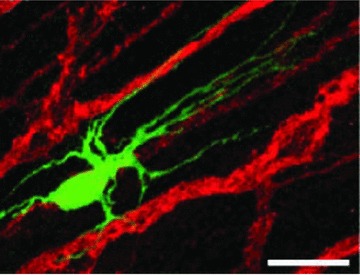
Combination of intracellular injection of LY with immunohistochemistry, using confocal microscopy. A single ICC-DMP was injected with LY (green), and nerves were labelled with an antibody against the nerve marker PGP9.5 (red). Note the close apposition between the ICC processes and the nerve fibres, which indicates innervation of the ICC. Calibration bar = 10 μm. Modified from Ref. [82].
Antibodies against LY
Labelling with LY can sometimes be weak. To help visualize the details of the labelled cells, antibodies against LY have been prepared to greatly enhance the labelling intensity [7]. When peroxidase is used for detecting the secondary antibody, the LY-labelled cell can be viewed with the electron microscope [83]. A drawback of this method is the formation of a dense reaction product in the LY-filled neuron that obscures ultrastructural details. Branchereau et al. [84] showed that using immunogold instead of HRP greatly improved the visualization of cellular organelles in cells labelled with LY.
Using LY for selective ablation of cells
Intense illumination of fluorescently-labelled cells can cause cell death, via the formation of free radicals. This has been exploited for selective ablation of cells. Single cells were loaded with LY and then illuminated with intense blue light, which caused selective death of the labelled cell [85]. This enabled the study of the function of the neuronal network after deleting a specific cell. A further refinement of this method was the ablation of single dendrites in the leech nervous system [86]. The authors recorded synaptic potentials before and after the ablation, and obtained precise information on synaptic inputs to identified cells.
Conclusion
The account above is by no means comprehensive, but it is hoped that it provided a broad picture how a rather basic tool such as a fluorescent molecule can contribute to research in diverse fields of biomedicine. The examples presented demonstrated how using LY benefited research on enteric neurons and ICC. Obviously, synthesis and testing of newer and better molecules is highly desirable, which requires closer collaboration between biologists and chemists.
Acknowledgments
Work performed in the author's laboratory was supported by the Israel Science Foundation (Grant No. 212/08) and the US-Israel Binational Science Foundation (BSF, Grant No. 2007311). The author is grateful to Dr. Walter W. Stewart, for donating his first sample of Lucifer yellow.
Conflict of interest
The author confirms that there are no conflicts of interest.
References
- 1.Lichtman JW, Conchello JA. Fluorescence microscopy. Nat Methods. 2005;2:910–9. doi: 10.1038/nmeth817. [DOI] [PubMed] [Google Scholar]
- 2.Resch-Genger U, Grabolle M, Cavaliere-Jaricot S, et al. Quantum dots versus organic dyes as fluorescent labels. Nat Methods. 2008;5:763–75. doi: 10.1038/nmeth.1248. [DOI] [PubMed] [Google Scholar]
- 3.Huizinga JD, Zarate N, Farrugia G. Physiology, injury, and recovery of interstitial cells of Cajal: basic and clinical science. Gastroenterology. 2009;137:1548–56. doi: 10.1053/j.gastro.2009.09.023. [DOI] [PMC free article] [PubMed] [Google Scholar]
- 4.Wood JD. Enteric nervous system: reflexes, pattern generators and motility. Curr Opin Gastroenterol. 2008;24:149–58. doi: 10.1097/MOG.0b013e3282f56125. [DOI] [PubMed] [Google Scholar]
- 5.Stewart WW. Functional connections between cells as revealed by dye-coupling with a highly fluorescent naphthalimide tracer. Cell. 1978;14:741–59. doi: 10.1016/0092-8674(78)90256-8. [DOI] [PubMed] [Google Scholar]
- 6.Brown AG, Fyffe REW. Intracellular staining of mammalian neurones. London: Academic Press; 1984. [Google Scholar]
- 7.Tasker JG, Hoffman NW, Dudek FE. Comparison of three intracellular markers for combined electrophysiological, morphological and immunohistochemical analyses. J Neurosci Methods. 1991;38:129–43. doi: 10.1016/0165-0270(91)90163-t. [DOI] [PubMed] [Google Scholar]
- 8.Meda P. Probing the function of connexin channels in primary tissues. Methods. 2000;20:232–44. doi: 10.1006/meth.1999.0940. [DOI] [PubMed] [Google Scholar]
- 9.Abbaci M, Barberi-Heyob M, Blondel W, et al. Advantages and limitations of commonly used methods to assay the molecular permeability of gap junctional intercellular communication. Biotechniques. 2008;45:33–60. doi: 10.2144/000112810. [DOI] [PubMed] [Google Scholar]
- 10.Werblin FS, Dowling JE. Organization of the retina of the mudpuppy, Necturus maculosus. II. Intracellular recording. J Neurophysiol. 1969;32:339–55. doi: 10.1152/jn.1969.32.3.339. [DOI] [PubMed] [Google Scholar]
- 11.Stretton AO, Kravitz EA. Neuronal geometry: determination with a technique of intracellular dye injection. Science. 1968;162:132–4. doi: 10.1126/science.162.3849.132. [DOI] [PubMed] [Google Scholar]
- 12.Stewart WW. Lucifer dyes-highly fluorescent dyes for biological tracing. Nature. 1981;292:17–21. doi: 10.1038/292017a0. [DOI] [PubMed] [Google Scholar]
- 13.Kanno Y, Loewenstein WR. Intercellular diffusion. Science. 1964;143:959–60. doi: 10.1126/science.143.3609.959. [DOI] [PubMed] [Google Scholar]
- 14.Simpson I, Rose B, Loewenstein WR. Size limit of molecules permeating the junctional membrane channels. Science. 1977;195:294–6. doi: 10.1126/science.831276. [DOI] [PubMed] [Google Scholar]
- 15.Bennett MV, Spira ME, Spray DC. Permeability of gap junctions between embryonic cells of Fundulus: a reevaluation. Dev Biol. 1978;65:114–25. doi: 10.1016/0012-1606(78)90184-7. [DOI] [PubMed] [Google Scholar]
- 16.Huang TY, Cherkas PS, Rosenthal DW, et al. Dye coupling among satellite glial cells in mammalian dorsal root ganglia. Brain Res. 2005;1036:42–9. doi: 10.1016/j.brainres.2004.12.021. [DOI] [PubMed] [Google Scholar]
- 17.Einstein G. Intracellular injection of Lucifer yellow into cortical neurons in lightly fixed sections and its application to human autopsy material. J Neurosci Methods. 1988;26:95–103. doi: 10.1016/0165-0270(88)90157-4. [DOI] [PubMed] [Google Scholar]
- 18.Buhl EH. Intracellular injection in fixed slices in combination with neuroanatomical tracing techniques and electron microscopy to determine multisynaptic pathways in the brain. Microsc Res Tech. 1993;24:15–30. doi: 10.1002/jemt.1070240104. [DOI] [PubMed] [Google Scholar]
- 19.McNeil PL, Murphy RF, Lanni F, et al. A method for incorporating macromolecules into adherent cells. J Cell Biol. 1984;98:1556–64. doi: 10.1083/jcb.98.4.1556. [DOI] [PMC free article] [PubMed] [Google Scholar]
- 20.el-Fouly MH, Trosko JE, Chang CC. Scrape-loading and dye transfer. A rapid and simple technique to study gap junctional intercellular communication. Exp Cell Res. 1987;168:422–30. doi: 10.1016/0014-4827(87)90014-0. [DOI] [PubMed] [Google Scholar]
- 21.Giaume C, Marin P, Cordier J, et al. Adrenergic regulation of intercellular communications between cultured striatal astrocytes from the mouse. Proc Natl Acad Sci USA. 1991;88:5577–81. doi: 10.1073/pnas.88.13.5577. [DOI] [PMC free article] [PubMed] [Google Scholar]
- 22.Pepper MS, Meda P. Basic fibroblast growth factor increases junctional communication and connexin 43 expression in microvascular endothelial cells. J Cell Physiol. 1992;153:196–205. doi: 10.1002/jcp.1041530124. [DOI] [PubMed] [Google Scholar]
- 23.Glogauer M, Lee W, McCulloch CA. Induced endocytosis in human fibroblasts by electrical fields. Exp Cell Res. 1993;208:232–40. doi: 10.1006/excr.1993.1242. [DOI] [PubMed] [Google Scholar]
- 24.Anagnostopoulou A, Cao J, Vultur A, et al. Examination of gap junctional, intercellular communication by in situ electroporation on two co-planar indium-tin oxide electrodes. Mol Oncol. 2007;1:226–31. doi: 10.1016/j.molonc.2007.06.002. [DOI] [PMC free article] [PubMed] [Google Scholar]
- 25.Benediktsson AM, Schachtele SJ, Green SH, et al. Ballistic labeling and dynamic imaging of astrocytes in organotypic hippocampal slice cultures. J Neurosci Methods. 2005;141:41–53. doi: 10.1016/j.jneumeth.2004.05.013. [DOI] [PubMed] [Google Scholar]
- 26.Bittman KS, Panzer JA, Balice-Gordon RJ. Patterns of cell-cell coupling in embryonic spinal cord studied via ballistic delivery of gap-junction-permeable dyes. J Comp Neurol. 2004;477:273–85. doi: 10.1002/cne.20253. [DOI] [PubMed] [Google Scholar]
- 27.Sarthy PV, Johnson SM, Detwiler PB. Selective uptake of Lucifer yellow by retinal cells. J Comp Neurol. 1982;206:371–8. doi: 10.1002/cne.902060405. [DOI] [PubMed] [Google Scholar]
- 28.Vaney DI. The morphology and topographic distribution of AII amacrine cells in the cat retina. Proc R Soc Lond B Biol Sci. 1985;224:475–88. doi: 10.1098/rspb.1985.0045. [DOI] [PubMed] [Google Scholar]
- 29.Zimmerman RP. Specific neuronal staining by in vitro uptake of Lucifer yellow. Brain Res. 1986;383:287–98. doi: 10.1016/0006-8993(86)90027-2. [DOI] [PubMed] [Google Scholar]
- 30.Smith GJ, Bagnell CR, Bakewell WE, et al. Application of confocal scanning laser microscopy in experimental pathology. J Electron Microsc Tech. 1991;18:38–49. doi: 10.1002/jemt.1060180107. [DOI] [PubMed] [Google Scholar]
- 31.Sarthy PV, Hilbush BS. Lucifer yellow uptake in developing rat retina: selective staining of horizontal cells. Brain Res. 1983;313:275–80. doi: 10.1016/0165-3806(83)90226-2. [DOI] [PubMed] [Google Scholar]
- 32.Saito T, Kujiraoka T. Physiological and morphological identification of two types of on-center bipolar cells in the carp retina. J Comp Neurol. 1982;205:161–70. doi: 10.1002/cne.902050207. [DOI] [PubMed] [Google Scholar]
- 33.Mason WT. Electrical properties of neurons recorded from the rat supraoptic nucleus in vitro. Proc R Soc Lond B Biol Sci. 1983;217:141–61. doi: 10.1098/rspb.1983.0003. [DOI] [PubMed] [Google Scholar]
- 34.Iyer V, Bornstein JC, Costa M, et al. Electrophysiology of guinea-pig myenteric neurons correlated with immunoreactivity for calcium binding proteins. J Auton Nerv Syst. 1988;22:141–50. doi: 10.1016/0165-1838(88)90087-2. [DOI] [PubMed] [Google Scholar]
- 35.Belzer V, Kobilo T, Rich A, et al. Intercellular coupling among interstitial cells of Cajal in the guinea-pig small intestine. Cell Tissue Res. 2002;307:15–21. doi: 10.1007/s00441-001-0474-y. [DOI] [PubMed] [Google Scholar]
- 36.Mayer ML, Crunelli V, Kemp JA. Lithium ions increase action potential duration of mammalian neurons. Brain Res. 1984;293:173–7. doi: 10.1016/0006-8993(84)91466-5. [DOI] [PubMed] [Google Scholar]
- 37.Schl^sser B, ten Bruggencate G, Sutor B. The intracellular tracer Neurobiotin alters electrophysiological properties of rat neos-triatal neurons. Neurosci Lett. 1998;249:13–6. doi: 10.1016/s0304-3940(98)00366-8. [DOI] [PubMed] [Google Scholar]
- 38.Wang GY, Ratto G, Bisti S, et al. Functional development of intrinsic properties in ganglion cells of the mammalian retina. J Neurophysiol. 1997;78:2895–903. doi: 10.1152/jn.1997.78.6.2895. [DOI] [PubMed] [Google Scholar]
- 39.Hanani M, Ermilov LG, Schmalz PF, et al. The three dimensional structure of myenteric neurons. J Auton Nerv Syst. 1998;871:1–9. doi: 10.1016/s0165-1838(98)00054-x. [DOI] [PubMed] [Google Scholar]
- 40.Turner JN, Szarowski DH, Smith KL, et al. Confocal microscopy and three-dimensional reconstruction of electrophysiologically identified neurons in thick brain slices. J Electron Microsc Tech. 1991;18:11–23. doi: 10.1002/jemt.1060180104. [DOI] [PubMed] [Google Scholar]
- 41.Ermilov LG, Miller SM, Hanani M, et al. The three-dimensional structure of the guinea-pig inferior mesenteric and pelvic-hypogastric ganglia. Auton Neurosci. 2000;83:116–26. doi: 10.1016/S0165-1838(00)00092-8. [DOI] [PubMed] [Google Scholar]
- 42.Bushong EA, Martone ME, Jones YZ, et al. Protoplasmic astrocytes in CA1 stratum radiatum occupy separate anatomical domains. J Neurosci. 2002;22:183–92. doi: 10.1523/JNEUROSCI.22-01-00183.2002. [DOI] [PMC free article] [PubMed] [Google Scholar]
- 43.Ogata K, Kosaka T. Structural and quantitative analysis of astrocytes in the mouse hippocampus. Neuroscience. 2002;113:221–33. doi: 10.1016/s0306-4522(02)00041-6. [DOI] [PubMed] [Google Scholar]
- 44.Bennett MV. Gap junctions as electrical synapses. J Neurocytol. 1997;26:349–66. doi: 10.1023/a:1018560803261. [DOI] [PubMed] [Google Scholar]
- 45.Scemes E, Spray DC, Meda P. Connexins, pannexins, innexins: novel roles of “hemichannels”. Pflugers Arch. 2009;457:1207–26. doi: 10.1007/s00424-008-0591-5. [DOI] [PMC free article] [PubMed] [Google Scholar]
- 46.Gabella G, Blundell D. Gap junctions of the muscles of the small and large intestine. Cell Tissue Res. 1981;219:469–88. doi: 10.1007/BF00209987. [DOI] [PubMed] [Google Scholar]
- 47.BÈny JL, Connat JL. An electron-microscopic study of smooth muscle cell dye coupling in the pig coronary arteries. Role of gap junctions. Circ Res. 1992;70:49–55. doi: 10.1161/01.res.70.1.49. [DOI] [PubMed] [Google Scholar]
- 48.Zamir O, Hanani M. Dye-coupling in intestinal smooth muscle. Are gap junctions required for intercellular coupling? Experientia. 1990;46:1002–5. doi: 10.1007/BF01940654. [DOI] [PubMed] [Google Scholar]
- 49.Ledda M, Blum E, De Palo S, et al. Augmentation in gap junction-mediated cell coupling in dorsal root ganglia following sciatic nerve neuritis in the mouse. Neuroscience. 2009;164:1538–45. doi: 10.1016/j.neuroscience.2009.09.038. [DOI] [PubMed] [Google Scholar]
- 50.Ransom BR, Kettenmann H. Electrical coupling, without dye coupling, between mammalian astrocytes and oligodendrocytes in cell culture. Glia. 1990;3:258–66. doi: 10.1002/glia.440030405. [DOI] [PubMed] [Google Scholar]
- 51.Hertzberg EL, Spray DC, Bennett MV. Reduction of gap junctional conductance by microinjection of antibodies against the 27-kDa liver gap junction polypeptide. Proc Natl Acad Sci USA. 1985;82:2412–6. doi: 10.1073/pnas.82.8.2412. [DOI] [PMC free article] [PubMed] [Google Scholar]
- 52.Burt JM, Frank JS, Berns MW. Permeability and structural studies of heart cell gap junctions under normal and altered ionic conditions. J Membr Biol. 1982;68:227–38. doi: 10.1007/BF01872267. [DOI] [PubMed] [Google Scholar]
- 53.Spencer AN, Satterlie RA. Electrical and dye coupling in an identified group of neurons in a coelenterate. J Neurobiol. 1980;11:13–9. doi: 10.1002/neu.480110103. [DOI] [PubMed] [Google Scholar]
- 54.Gutnick MJ, Connors BW, Ransom BR. Dye-coupling between glial cells in the guinea pig neocortical slice. Brain Res. 1981;213:486–92. doi: 10.1016/0006-8993(81)90259-6. [DOI] [PubMed] [Google Scholar]
- 55.Hanani M, Zamir O, Baluk P. Glial cells in the guinea pig myenteric plexus are dye coupled. Brain Res. 1989;497:245–9. doi: 10.1016/0006-8993(89)90269-2. [DOI] [PubMed] [Google Scholar]
- 56.Maudlej N, Hanani M. Modulation of dye coupling among glial cells in the myenteric and submucosal plexuses of the guinea pig. Brain Res. 1992;578:94–8. doi: 10.1016/0006-8993(92)90234-z. [DOI] [PubMed] [Google Scholar]
- 57.Miller TM, Goodenough DA. Gap junction structures after experimental alteration of junctional channel conductance. J Cell Biol. 1985;101:1741–8. doi: 10.1083/jcb.101.5.1741. [DOI] [PMC free article] [PubMed] [Google Scholar]
- 58.Jones CJ, Quinton PM. Dye-coupling compartments in the human eccrine sweat gland. Am J Physiol. 1989;256:C478–85. doi: 10.1152/ajpcell.1989.256.3.C478. [DOI] [PubMed] [Google Scholar]
- 59.Belzer V, Nissan A, Freund HR, et al. Coupling among interstitial cells of Cajal in the human ileum. Neurogastroenterol Motil. 2004;16:75–80. doi: 10.1046/j.1365-2982.2003.00462.x. [DOI] [PubMed] [Google Scholar]
- 60.Dickens EJ, Hirst GD, Tomita T. Identification of rhythmically active cells in guinea-pig stomach. J Physiol. 1999;514:515–31. doi: 10.1111/j.1469-7793.1999.515ae.x. [DOI] [PMC free article] [PubMed] [Google Scholar]
- 61.Kito Y, Suzuki H. Properties of pacemaker potentials recorded from myenteric interstitial cells of Cajal distributed in the mouse small intestine. J Physiol. 2003;553:803–18. doi: 10.1113/jphysiol.2003.051334. [DOI] [PMC free article] [PubMed] [Google Scholar]
- 62.Wang B, Kunze WA, Zhu Y, et al. In situ recording from gut pacemaker cells. Pflugers Arch. 2008;457:243–51. doi: 10.1007/s00424-008-0513-6. [DOI] [PubMed] [Google Scholar]
- 63.Vaney Dl. Many diverse types of retinal neurons show tracer coupling when injected with biocytin or Neurobiotin. Neurosci Lett. 1991;125:187–90. doi: 10.1016/0304-3940(91)90024-n. [DOI] [PubMed] [Google Scholar]
- 64.Rackauskas M, Verselis VK, Bukauskas FF. Permeability of homotypic and heterotypic gap junction channels formed of cardiac connexins mCx30.2, Cx40, Cx43, and Cx45. Am J Physiol Heart Circ Physiol. 2007;293:H1729–36. doi: 10.1152/ajpheart.00234.2007. [DOI] [PMC free article] [PubMed] [Google Scholar]
- 65.Cao F, Eckert R, Elfgang C, et al. A quantitative analysis of connexin-specific permeability differences of gap junctions expressed in HeLa transfectants and Xenopus oocytes. J Cell Sci. 1998;111:31–43. doi: 10.1242/jcs.111.1.31. [DOI] [PubMed] [Google Scholar]
- 66.Ballerini P, Rathbone MP, Di lorio P, et al. Rat astroglial P2Z (P2×7) receptors regulate intracellular calcium and purine release. Neuroreport. 1996;7:2533–7. doi: 10.1097/00001756-199611040-00026. [DOI] [PubMed] [Google Scholar]
- 67.GarrÈ JM, Retamal MA, Cassina P, et al. VFGF-1 induces ATP release from spinal astrocytes in culture and opens pannexin and connexin hemichannels. Proc Natl Acad Sci USA. 2010;107:22659–64. doi: 10.1073/pnas.1013793107. [DOI] [PMC free article] [PubMed] [Google Scholar]
- 68.Burnstock G. Physiology and pathophysiology of purinergic neurotransmission. Physiol Rev. 2007;87:659–97. doi: 10.1152/physrev.00043.2006. [DOI] [PubMed] [Google Scholar]
- 69.Loch-Caruso R, Caldwell V, Cimini M, et al. Comparison of assays for gap junctional communication using human embryocarcinoma cells exposed to dieldrin. Fundam Appl Toxicol. 1990;15:63–74. [PubMed] [Google Scholar]
- 70.Rosell A, Giménez-Amaya JM. Anatomical re-evaluation of the corticostriatal projections to the caudate nucleus: a retrograde labeling study in the cat. Neurosci Res. 1999;34:257–69. doi: 10.1016/s0168-0102(99)00060-7. [DOI] [PubMed] [Google Scholar]
- 71.Minciacchi D, Granato A, Antonini A, et al. A procedure for the simultaneous visualization of two anterograde and different retrograde fluorescent tracers. Application to the study of the afferent-efferent organization of thalamic anterior intralaminar nuclei. J Neurosci Methods. 1991;38:183–91. doi: 10.1016/0165-0270(91)90168-y. [DOI] [PubMed] [Google Scholar]
- 72.Christian EP, Togo JA, Naper KE, et al. A retrograde labeling technique for the functional study of airway-specific visceral afferent neurons. J Neurosci Methods. 1993;47:147–60. doi: 10.1016/0165-0270(93)90031-l. [DOI] [PubMed] [Google Scholar]
- 73.Thompson SM, Robertson RT. Organization of subcortical pathways for sensory projections to the limbic cortex. II. Afferent projections to the thalamic lateral dorsal nucleus in the rat. J Comp Neurol. 1987;265:189–202. doi: 10.1002/cne.902650204. [DOI] [PubMed] [Google Scholar]
- 74.Maranto AR. Neuronal mapping: a photooxidation reaction makes Lucifer yellow useful for electron microscopy. Science. 1982;217:953–5. doi: 10.1126/science.7112109. [DOI] [PubMed] [Google Scholar]
- 75.Lübke J. Photoconversion of diaminobenzidine with different fluorescent neuronal markers into a light and electron microscopic dense reaction product. Microsc Res Tech. 1993;24:2–14. doi: 10.1002/jemt.1070240103. [DOI] [PubMed] [Google Scholar]
- 76.Hanani M, Belzer V, Rich A, et al. Visualization of interstitial cells of Cajal in intact tissues. Microscopy Res Tech. 1999;47:336–43. doi: 10.1002/(SICI)1097-0029(19991201)47:5<336::AID-JEMT5>3.0.CO;2-5. [DOI] [PubMed] [Google Scholar]
- 77.Reaves TA, Jr, Cumming R, Libber MT, et al. A technique combining intracellular dye-marking, immunocytochemical identification and ultrastructural analysis of physiologically identified single neurons. Neurosci Lett. 1982;29:195–9. doi: 10.1016/0304-3940(82)90316-0. [DOI] [PubMed] [Google Scholar]
- 78.Smithson KG, Cobbett P, MacVicar BA, et al. A reliable method for immunocytochemical identification of Lucifer yellow injected, peptide-containing mammalian central neurons. J Neurosci Methods. 1984;10:59–69. doi: 10.1016/0165-0270(84)90080-3. [DOI] [PubMed] [Google Scholar]
- 79.Ermilov LG, Schmalz PF, Miller SM, et al. Morphological characteristics and immunohystochemical detection of nicotinic acetylcholine receptors in intestinofugal afferent neurons of the guinea-pig colon. Neurogastroenterol Motil. 2003;15:289–98. doi: 10.1046/j.1365-2982.2003.00411.x. [DOI] [PubMed] [Google Scholar]
- 80.Katayama Y, Lees GM, Pearson GT. Electrophysiology and morphology of vasoactive-intestinal-peptide-immunoreactive neurones of the guinea-pig ileum. J Physiol. 1986;378:1–11. doi: 10.1113/jphysiol.1986.sp016204. [DOI] [PMC free article] [PubMed] [Google Scholar]
- 81.Bornstein JC, Costa M, Furness JB. Synaptic inputs to immunohistochemically identified neurones in the submucous plexus of the guinea-pig small intestine. J Physiol. 1986;381:465–82. doi: 10.1113/jphysiol.1986.sp016339. [DOI] [PMC free article] [PubMed] [Google Scholar]
- 82.Kobilo T, Szurszewski JH, Farrugia G, et al. Coupling and innervation patterns of interstitial cells of Cajal in the deep muscular plexus (ICC-DMP) of the guinea-pig. Neurogastroenterol Motil. 2003;15:1–7. doi: 10.1046/j.1350-1925.2003.00449.x. [DOI] [PubMed] [Google Scholar]
- 83.Kunkel DD, Scharfman HE, Schmiege DL, et al. Electron microscopy of intracellularly labeled neurons in the hippocampal slice preparation. Microsc Res Tech. 1993;24:67–84. doi: 10.1002/jemt.1070240107. [DOI] [PubMed] [Google Scholar]
- 84.Branchereau P, Van Bockstaele EJ, Chan J, et al. Ultrastructural characterization of neurons recorded intracellularly in vivo and injected with Lucifer yellow: advantages of immunogold-silver versus immunoperoxidase labeling. Microsc Res Tech. 1995;30:427–36. doi: 10.1002/jemt.1070300509. [DOI] [PubMed] [Google Scholar]
- 85.Miller JP, Selverston AI. Rapid killing of single neurons by irradiation of intracellularly injected dye. Science. 1979;206:701–4. doi: 10.1126/science.386514. [DOI] [PubMed] [Google Scholar]
- 86.Lytton WW, Kristan WB. Localization of a leech inhibitory synapse by photo-ablation of individual dendrites. Brain Res. 1989;504:43–8. doi: 10.1016/0006-8993(89)91595-3. [DOI] [PubMed] [Google Scholar]