

Abstract
Chromosomal instability (CIN), defined by an elevated frequency of the occurrence of novel chromosomal aberrations, is strongly implicated in the generation of aneuploidy, one of the hallmarks of human cancers. As for aneuploidy itself, the role of CIN in the evolution and progression of malignancy is a matter still open to debate. We investigated numerical as well as structural CIN in primary CD34-positive cells by determining the cell-to-cell variability of the chromosome content using fluorescence-in situ-hybridization (FISH). Thereby, CIN was measured in 65 patients with myelodysplastic syndromes (MDS), acute myeloid leukaemia (AML) and control subjects. Among MDS patients, a subgroup with elevated levels of CIN was identified. At a median follow-up of 17.2 months, all patients within this ‘high CIN’ subgroup had died or progressed to AML, while 80% of MDS patients with normal CIN levels had stable disease (P < 0.001). Notably, there was no statistically significant difference between ‘normal CIN’ and ‘high CIN’ MDS patients regarding established risk factors. Hence, elevated CIN levels were associated with poor outcome, and our method provided additional prognostic information beyond conventional cytogenetics. Furthermore, in all three MDS patients for whom serial measurements were available, development of AML was preceded by increasing CIN levels. In conclusion, elevated CIN levels may be valuable as an early indicator of poor prognosis in MDS, hence corroborating the concept of CIN as a driving force in tumour progression.
Keywords: myelodysplastic syndrome, chromosomal instability, CD34, prognosis, FISH
Introduction
One of the most common properties of cancer cells is genomic instability, most often present as chromosomal instability (CIN). CIN is defined by an elevated frequency of the occurrence of novel chromosomal aberrations and therefore, in contrast to aneuploidy, represents a rate rather than a state of genomic aberrations [1, 2]. Recently, CIN has been shown to play a role in both early malignant transformation and tumour progression in mice [3, 4]. Further evidence for the tumourigenic potential of CIN stems from the observation of an elevated incidence of malignancies in patients with mosaic variegated aneuploidy (MVA), a recessive disorder characterized by constitutional mosaicism for chromosomal gains and losses due to defects in mechanisms normally ensuring the proper segregation of the replicated chromosomes in mitosis [5]. Moreover, activation of the DNA damage response, presumably being a reaction to oncogenic stress leading to CIN, is most pronounced in early stages of human tumourigenesis, which is consistent with CIN evolving early during tumourigenesis [6, 7]. Whereas presence and extent of CIN have been reported for various cancer cell lines [1, 8] and solid tumours [9–12], CIN has never been investigated in haematological malignancies. Moreover, data for a defined population of primary malignant cells in different stages of disease are lacking.
The myelodysplastic syndromes (MDS) are clonal stem-cell disorders characterized by ineffective haematopoiesis and a high propensity for transformation into acute myeloid leukaemia (AML). Furthermore, recurrent chromosomal aberrations are shared by both MDS and AML, and the occurrence of centrosomal aberrations in these disorders further suggests a potential role of CIN in leukaemogenesis [13–17]. Given their premalignant state, their frequent progression to AML and their origin in an easy accessible stem-cell compartment, MDS was considered as a suitable model for studying the role of CIN in tumour initiation and progression.
Methods
Patient samples
Between June 2006 and February 2008, we isolated CD34-positive (CD34+) cells from 18 patients with MDS, 30 patients with AML, 10 healthy control subjects and 7 control patients with lymphoma not involving the CD34+ cell compartment (Table S1). In patients where samples from multiple time-points were available, the sample from the first presentation was used for end-point analysis. Informed consent was obtained according to the Declaration of Helsinki. The study was approved by the institutional review board. Following Ficoll density separation, CD34+ cells were magnetically sorted using CD34-microbeads (Miltenyi Biotec, Bergisch Gladbach, Germany). To evaluate the purity of the sorted cells, the percentage of CD34+CD45dim cells was determined by flow cytometry (FACS) in 42 consecutive samples and was 92.1%± 6.6% (mean ± SD).
Fluorescence-in situ-hybridization
Fluorescence-in situ-hybridization (FISH) was performed as described elsewhere [18], hybridizing centromeric probes for chromosomes 1, 6, 7 and 8 (clones pUC1.77, pEDZ6, p7t1, pZ8.4, respectively, provided by Mariano Rocchi [19, 20]) to interphase CD34+ cells. To quantify the cell-to-cell variability of the chromosome content for each of these chromosomes, the modal number of signals per chromosome was determined. The percentage of cells whose chromosome number differed therefrom represented the proportion of ‘aberrant cells’, which was separately evaluated for each of the four chromosomes. These four measurements were combined to define the ‘numerical CIN level’ as the median percentage of aberrant cells. To test for structural instability, subtelomeric probes (provided by Lyndal Kearney) for short and long arms of chromosomes 6 (PAC 62I11 and PAC57H24, respectively [21]) and 8 (BAC77L23 and PAC489D14, respectively [21]) were hybridized pairwise to the CD34+ cells, thereby allowing for the detection of gains or losses of single chromosome arms. To minimize false positive results due to weak fluorescence signals, only unbalanced gains relative to the modal number were regarded as aberrant. For each pair of centromeric and subtelomeric probes, a minimum of 100 cells was carefully analysed in a double-blinded manner by a single investigator. Fluorescence images were captured and processed using a Zeiss Axiovert 200 M fluorescence microscope equipped with AxioVision Software and a Zeiss Plan-Neofluar 100x/1.32 oil immersion objective. Images were cropped and processed using Photoshop CS3 (Adobe).
Statistical analysis
The cumulative probability of survival and risk of progression to leukaemia were estimated using the Kaplan–Meier method. Differences in survival between groups were assessed using the log-rank test. Student’s t-test, Fisher’s exact test and chi-square test were used as appropriate for comparison of other variables.
Results
Analysis of numerical and structural CIN in primary MDS and AML cells
To determine the role of CIN in malignant transformation and cancer progression in primary human cells, we examined CD34+ haematopoietic progenitor cells from 18 patients with MDS, 14 patients with secondary AML, 16 patients with de novo AML, 10 healthy control subjects and 7 control patients with lymphoma not involving the CD34+ cell compartment. To measure numerical CIN based on a method described by Lengauer and colleagues [1], the cell-to-cell variability of the chromosome content was determined by FISH of interphase CD34+ cells, using a panel of centromeric probes. As a significant proportion of MDS and AML patients harbour recurrent chromosomal aberrations, with individual chromosomes involved at different frequencies (e.g. chromosomes 7 and 8 frequently, chromosomes 1 and 6 rarely being aberrant [22]), we sought to investigate whether differing instabilities of individual chromosomes are responsible for these different frequencies. Therefore, we included both chromosomes frequently affected by recurrent aberrations (chromosomes 7 and 8) and chromosomes typically not showing such recurrent aberrations (chromosomes 1 and 6) in our study. We found no evidence for a higher level of numerical CIN of chromosomes 7 and 8 as compared to chromosomes 1 and 6, indicating that recurrent chromosomal aberrations are caused by clonal selection and not by different instability levels of individual chromosomes (data not shown). Therefore, we combined the measurements resulting from centromeric probes for chromosomes 1, 6, 7 and 8 to define the ‘numerical CIN level’ (nCIN) as the median percentage of cells with an aberrant chromosome content.
Likewise, the percentage of cells exhibiting CIN at the structural level was determined using subtelomeric probes for the long and short arms of chromosomes 6 and 8, thereby allowing the detection of losses or gains of one chromosome arm relative to the other. The analysis of structural CIN was performed in 56 samples but did not show any significant correlation with outcome, clinical stages or risk scores, questioning a major role for random chromosomal breaks in the progression of MDS to AML (Tables S1 and S2).
Elevated numerical CIN levels correlate with poor outcome in MDS patients
Numerical CIN levels were analysed in 65 samples and were consistently low in healthy control subjects (mean nCIN ± SD: 6.0%± 1.5%, range 3.8–7.9%), control patients with lymphoma not involving the CD34+ cell compartment (mean nCIN ± SD: 6.0%± 1.1%, range 4.2–7.7%) and in all but one patient with de novo AML (mean nCIN ± SD: 5.9%± 1.7%, range 3.5–9.2%). The nCIN levels observed in patients with MDS (mean nCIN ± SD: 7.0%± 2.5%, range 3.8–13.5%) and secondary AML (mean nCIN ± SD: 9.0%± 12.2%, range 2.7–49.6%) were higher and showed a somewhat broader distribution than in the other patient groups (Fig. 1A, Table 1). However, these differences were not statistically significant (P= 0.17 and P= 0.38, respectively, compared to the group of healthy control subjects), likely due to the relatively small size of our patient cohort.
Fig 1.
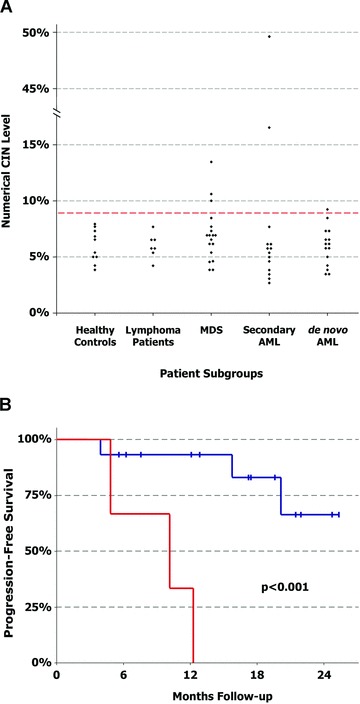
Numerical CIN correlates with outcome in patients with MDS. (A) Comparison of the median numerical CIN levels in CD34+ haematopoietic progenitor cells from healthy control subjects, control patients with lymphoma not involving the CD34+ cell compartment, MDS patients, patients with secondary AML and patients with de novo AML. The dashed red line indicates the cut-off between normal and elevated numerical CIN levels (mean + 2 SD of the numerical CIN levels in healthy control subjects). (B) Kaplan–Meier plot showing the progression-free survival of MDS patients with normal (blue line) and elevated numerical CIN levels (red line) at a median follow-up of 17.2 months (log-rank test: P < 0.001). The combined end-point was defined as either progression to AML or death.
Table 1.
Numerical CIN: results and patient group characteristics
| Healthy control subjects N= 10 | Lymphoma patients N= 7 | Patients with MDS N= 18 | Patients with secondary AML N= 14 | Patients with de novo AML N= 16 | |
|---|---|---|---|---|---|
| Female sex | 0/10 | 2/7 | 8/18 | 4/14 | 6/16 |
| Age (years) | |||||
| Median | 35 | 60 | 69 | 68.5 | 56.5 |
| Range | 0−73 | 40−68 | 42−85 | 37−74 | 23−81 |
| nCIN (%) | |||||
| Mean ± SD | 6.0 ± 1.5 | 6.0 ± 1.1 | 7.0 ± 2.5 | 9.0 ± 12.2 | 5.9 ± 1.7 |
| Median | 6.0 | 5.8 | 6.9 | 5.6 | 6.0 |
| Range | 3.8−7.9 | 4.2−7.7 | 3.8−13.5 | 2.7−49.6 | 3.5−9.2 |
| P-value | − | 0.98 | 0.17 | 0.38 | 0.89 |
MDS: myelodysplastic syndrome; AML: acute myeloid leukaemia; nCIN: numerical chromosomal instability; SD: standard deviation. P-values are given relative to the group of healthy control subjects.
In the groups of MDS and secondary AML, we were able to identify patients with numerical CIN levels that were elevated more than two standard deviations relative to the mean of healthy control subjects (cut-off: 8.9%). Compared to MDS patients with normal levels of nCIN, MDS patients with high nCIN had a significantly poorer prognosis: all three patients in this group reached the end-point, defined as either progression to AML (two patients) or death (one patient), within 4.9, 10.2 and 12.3 months after sample collection, respectively, whereas among the 15 patients with normal nCIN levels, only three patients (20%) reached the end-point (3.9, 15.8 and 20.1 months after sample collection) after a median follow-up of 17.2 months (P < 0.001; Fig. 1B). Notably, none of the patients with high nCIN levels had a karyotype indicative of high-risk according to the criteria of the international prognostic scoring system (IPSS) [23] (Table 2), which convincingly demonstrates that the nCIN level provides additional prognostic information beyond conventional karyotyping. It should also be noted that there were no other statistically significant differences between the two patient groups regarding patient characteristics and established risk factors (Table 3).
Table 2.
MDS patient characteristics
| No. | Sex | Age | Diagnosis | IPSS | Follow-up | End-point | nCIN | sCIN | Cytogenetics |
|---|---|---|---|---|---|---|---|---|---|
| 1 | F | 65 | RAEB-2 | 2.5 | 10.2 m | AML | 10.0% | 4.5% | 46,XX [16] |
| 2 | F | 63 | RCMD | 0.5 | 21.9 m | NR | 5.4% | 1.5% | 46,XX [25] |
| 3 | M | 71 | RAEB-2 | 1.5 | 15.8 m | death | 4.6% | 4.0% | 46,XY |
| 4 | F | 67 | 5q- | 0 | 17.2 m | NR | 7.3% | 0.5% | 46,XY,del(5)(q13q33) [9] |
| 5 | F | 68 | RAEB-2 | 2.5 | 20.1 m | AML | 7.7% | 2.0% | 46,XX [26] |
| 6 | F | 66 | RA | 0.5 | 5.6 m | NR | 8.5% | 7.0% | 46,XY,t(2;19)(p13;p13) [26] |
| 7 | M | 76 | RCMD-RS | 0 | 25.4 m | NR | 6.9% | 4.5% | 45X,-Y [16] / 46,XY [10] |
| 8 | F | 81 | RCMD | 1 | 3.9 m | death | 6.5% | 2.6% | 45,XX,del(1)(p22),del(5)(q13q33), del(20)(q11q13),-22 [12] |
| 9 | F | 70 | RAEB-1 | 0.5 | 24.7 m | NR | 6.2% | 4.0% | 46,XY,del5q |
| 10 | M | 74 | RAEB-1 | 1 | 12.3 m | death | 10.6% | NA | 46,XY [25] |
| 11 | M | 58 | RA | 0 | 7.6 m | NR | 4.6% | NA | 46,XY [25] |
| 12 | M | 72 | RCMD | 0.5 | 12.8 m | NR | 6.9% | 5.0% | 46,XY [25] |
| 13 | F | 85 | RAEB-2 | 2 | 12.1 m | NR | 3.8% | 8.0% | 46,XX [26] |
| 14 | M | 67 | RAEB-2 | 2 | 6.2 m | NR | 6.2% | 2.5% | 47,XY,+8 [4] / 46,XY [22] |
| 15 | M | 69 | RAEB-2 | 2 | 4.9 m | AML | 13.5% | 6.0% | 45,X,inv(9)(p11q13),-Y [17] / 46,XY,inv(9)(p11q13) [8] |
| 16 | M | 79 | RAEB-1 | 2 | 19.6 m | NR | 6.9% | 4.0% | 46,XY,del(7)(q32q36) [25] |
| 17 | M | 69 | RAEB-2 | 2 | 17.4 m | NR | 3.8% | 3.5% | 46,XY [24] |
| 18 | M | 42 | RAEB-1 | 1 | 21.5 m | NR | 6.9% | 5.0% | 46,XY [26] |
Follow-up is given in months from sample acquisition. Diagnoses are listed according to the WHO classification. AML: acute myeloid leukaemia; nCIN: numerical chromosomal instability; sCIN: structural chromosomal instability; IPSS: International Prognostic Scoring System; RA: refractory anaemia; RAEB: refractory anaemia with excess of blasts; RCMD: refractory cytopenia with multi-lineage dysplasia; RCMD-RS: refractory cytopenia with multi-lineage dysplasia with ringed sideroblasts; 5q-: 5q minus syndrome; NR: not reached; NA: not available.
Table 3.
Comparison of MDS patients with high and normal CIN levels
| High nCIN | Normal nCIN | P | |
|---|---|---|---|
| Number of patients | 3 | 15 | |
| Median age (years) | 69 | 69 | 0.91 a |
| Range | 65−74 | 42−85 | |
| MDS RAEB | 3/3 | 8/15 | 0.24 c |
| Time since diagnosis (months) | 0.39 a | ||
| Mean ± SD | 27.2 ± 24.0 | 11.7 ± 19.8 | |
| Range | 6.4−53.5 | 0–67.9 | |
| IPSS | 0.53 b | ||
| Median | 2 | 1 | |
| Range | 1−2.5 | 0−2.5 | |
| IPSS parameters | |||
| Blast count (mean) | 11% | 7% | 0.40 a |
| Range | 4−17% | 0−16% | |
| Cytogenetic risk score (median) | 0 | 0 | 0.60 b |
| Range | 0−0.5 | 0−1 | |
| Cytopenias (median) | 2 | 2 | 0.24 b |
| Range | 2−2 | 1−3 |
SD: standard deviation; a unpaired t-test; b chi-square test; c Fisher’s exact test.
A rising numerical CIN level may predict AML evolution
Serial measurements of numerical CIN were available for two MDS patients with elevated and five MDS patients with normal nCIN levels at baseline evaluation. Four of these patients reached the end-point, among those both patients with initially elevated nCIN levels.
Remarkably, we documented an increase in nCIN levels preceding leukaemic transformation in all three MDS patients that progressed to AML. In one of those patients (#15), the nCIN level increased massively from 13.5% to 51.2% within 1 month, followed by progression to AML 4 months later, thereby supporting a causal instead of a bystander role for CIN in tumour evolution (Fig. 2A and B). Moreover, when comparing CD34+ cells and CD34− mononuclear cells from the bone marrow of this patient, we found high nCIN levels to be confined to the CD34+ compartment (Fig. 2C).
Fig 2.
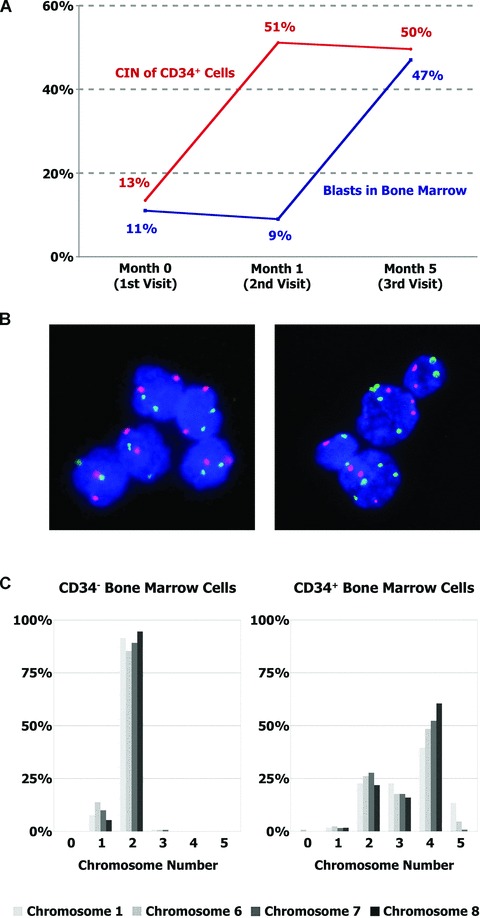
Increasing numerical CIN levels precede the progression to AML. (A) Bone marrow specimens from patient #15 (see Table 2), who initially presented with MDS, were obtained at the indicated time-points. Blasts were quantified by routine cytology, and numerical CIN levels in CD34+ haematopoietic progenitor cells were evaluated in the same specimens. A blast count exceeding 20% and thus progression to AML was first detected at month 5, while a massive rise in the CIN level was already apparent at month 1. (B) CD34+ cells of patient #15 at the first visit (left panel) and 1 month later (right panel), hybridized with centromeric FISH probes to chromosomes 6 (red) and 7 (green). DNA was counterstained with DAPI (blue). The increase in CIN preceded the evolution to secondary AML by 4 months. (C) The numerical CIN level was determined by evaluating the number of the indicated chromosomes per cell in at least 100 cells. Comparison of CD34-negative (left panel) and CD34-positive (right panel) bone marrow cells from patient #15 at month 5 revealed that numerical CIN was confined to CD34+ cells and equally affected all analysed chromosomes.
Patients #1 and #5 were also found to have an increase in nCIN preceding disease progression: patient #1 showed an increase from 10.0% to 11.2% at the second visit and progressed to AML 6 months thereafter. In patient #5, initially having a normal nCIN level of 7.7%, an increase to 9.6%, and thus above the cut-off for ‘high nCIN’ was observed at follow-up 1 month later. Secondary AML was diagnosed 19 months later. The fourth patient (#3) who reached the end-point showed no increase in nCIN on follow-up (data not shown), but succumbed to a fatal bleeding episode 15 months later. Remarkably, in this patient, there was no evidence of leukaemic transformation. The remaining three patients neither showed an increase in nCIN on follow-up, nor did one of these patients reach the end-point.
One additional patient with AML secondary to MDS (#53) was found to have a highly elevated nCIN level of 16.5% at sample collection albeit having a normal male karyotype. Although this patient’s rapid progression to AML within only 5 months after the first diagnosis of MDS may lend further support to CIN as a progression-driving mechanism in MDS, a causal link could not be established due to the lack of an additional patient sample before AML evolution.
Discussion
Our study for the first time demonstrates nCIN to be present in a well-defined progenitor cell-population of a malignant haematological disorder. Despite the small size of our study cohort, we found a highly significant correlation between elevated nCIN levels and poor outcome in MDS. One could argue that complex cytogenetic aberrations have long been established as a predictor of poor prognosis in both MDS and AML [14, 24], so there might be no additional value of CIN levels as a risk predictor beyond conventional karyotyping. However, our data clearly demonstrate that all cases with elevated nCIN levels had low or intermediate-risk cytogenetics but nevertheless a poor prognosis. Also, an elevated nCIN level was found only in one of 13 AML patients with an abnormal karyotype. Hence, the cytogenetic risk score (representing a state) and the nCIN level (representing a rate) are independent from each other, with the nCIN level providing additional prognostic information. Additionally, the results of serial measurements of nCIN, which show that rising nCIN levels were consistently observed before MDS progression into secondary AML, further support a causal role of nCIN in leukaemic transformation. Taken together, the data presented here corroborate the concept that CIN does contribute to the evolution of malignancies, with the extent of CIN being correlated with clinical outcome.
Recent work by Breems and colleagues showed that autosomal monosomies confer a poor prognosis in AML, irrespective of the chromosome affected [25]. Since such random monosomies are most likely explained by nCIN, this notion further corroborates the concept of CIN as a driving force in tumour evolution and therefore an indicator of worse outcome. Moreover, several studies have shown increased rates of programmed cell death in bone marrow cells of patients with low-grade MDS [26]. Therefore, since CIN hampers proliferation and induces apoptosis, it might also contribute to progressive cytopenia in MDS [27–30].
nCIN does not seem to be generally present in MDS and AML, which may be explained by either other forms of genomic instability contributing to leukaemogenesis in the remaining cases or by CIN only transiently occurring in the majority of cases. The latter possibility of genomic instability being mostly a transient phenomenon in the setting of tumourigenesis and tumour progression has been repeatedly postulated [31] and is supported by the recent finding that permanent genomic instability is disadvantageous to malignant cells [3].
We conclude that the numerical CIN level might be a valuable measure for identifying patients with high-risk MDS more reliably and possibly for predicting progression to AML, and should be evaluated as a diagnostic tool in larger prospective series.
Acknowledgments
The authors thank Lyndal Kearney (Institute of Cancer Research, Sutton, Surrey, UK) and Mariano Rocchi (Istituto di Genetica, Bari, Italy) for kindly providing the FISH probes, Christiane Heiss and Thomas Hielscher for statistical analysis, and Brigitte Schreiter and Heidi Holtgreve-Grez for excellent technical assistance. This work was supported by the research grant 108560 from the Deutsche Krebshilfe.
Supporting Information
Table S1: Patient characteristics
Table S2: Structural CIN: results and patient group characteristics
Please note: Wiley-Blackwell are not responsible for the content or functionality of any supporting information supplied by the authors. Any queries (other than missing material) should be directed to the corresponding author for the article.
References
- 1.Lengauer C, Kinzler KW, Vogelstein B. Genetic instability in colorectal cancers. Nature. 1997;386:623–7. doi: 10.1038/386623a0. [DOI] [PubMed] [Google Scholar]
- 2.Geigl JB, Obenauf AC, Schwarzbraun T, et al. Defining ‘chromosomal instability’. Trends Genet. 2008;24:64–9. doi: 10.1016/j.tig.2007.11.006. [DOI] [PubMed] [Google Scholar]
- 3.Weaver BA, Silk AD, Montagna C, et al. Aneuploidy acts both oncogenically and as a tumor suppressor. Cancer Cell. 2007;11:25–36. doi: 10.1016/j.ccr.2006.12.003. [DOI] [PubMed] [Google Scholar]
- 4.Sotillo R, Hernando E, Diaz-Rodriguez E, et al. Mad2 overexpression promotes aneuploidy and tumorigenesis in mice. Cancer Cell. 2007;11:9–23. doi: 10.1016/j.ccr.2006.10.019. [DOI] [PMC free article] [PubMed] [Google Scholar]
- 5.Hanks S, Coleman K, Reid S, et al. Constitutional aneuploidy and cancer predisposition caused by biallelic mutations in BUB1B. Nat Genet. 2004;36:1159–61. doi: 10.1038/ng1449. [DOI] [PubMed] [Google Scholar]
- 6.Bartkova J, Horejsi Z, Koed K, et al. DNA damage response as a candidate anti-cancer barrier in early human tumorigenesis. Nature. 2005;434:864–70. doi: 10.1038/nature03482. [DOI] [PubMed] [Google Scholar]
- 7.Halazonetis TD, Gorgoulis VG, Bartek J. An oncogene-induced DNA damage model for cancer development. Science. 2008;319:1352–5. doi: 10.1126/science.1140735. [DOI] [PubMed] [Google Scholar]
- 8.Roschke AV, Stover K, Tonon G, et al. Stable karyotypes in epithelial cancer cell lines despite high rates of ongoing structural and numerical chromosomal instability. Neoplasia. 2002;4:19–31. doi: 10.1038/sj.neo.7900197. [DOI] [PMC free article] [PubMed] [Google Scholar]
- 9.Florl AR, Schulz WA. Chromosomal instability in bladder cancer. Arch Toxicol. 2008;82:173–82. doi: 10.1007/s00204-008-0280-3. [DOI] [PubMed] [Google Scholar]
- 10.Bayani J, Paderova J, Murphy J, et al. Distinct patterns of structural and numerical chromosomal instability characterize sporadic ovarian cancer. Neoplasia. 2008;10:1057–65. doi: 10.1593/neo.08584. [DOI] [PMC free article] [PubMed] [Google Scholar]
- 11.Loeper S, Romeike BF, Heckmann N, et al. Frequent mitotic errors in tumor cells of genetically micro-heterogeneous glioblastomas. Cytogenet Cell Genet. 2001;94:1–8. doi: 10.1159/000048773. [DOI] [PubMed] [Google Scholar]
- 12.Miyoshi Y, Iwao K, Ikeda N, et al. Acceleration of chromosomal instability of BRCA1-associated hereditary breast cancers by p53 abnormality. Breast J. 2002;8:77–80. doi: 10.1046/j.1524-4741.2002.08201.x. [DOI] [PubMed] [Google Scholar]
- 13.Corey SJ, Minden MD, Barber DL, et al. Myelodysplastic syndromes: the complexity of stem-cell diseases. Nat Rev Cancer. 2007;7:118–29. doi: 10.1038/nrc2047. [DOI] [PubMed] [Google Scholar]
- 14.Estey E, Döhner H. Acute myeloid leukaemia. Lancet. 2006;368:1894–907. doi: 10.1016/S0140-6736(06)69780-8. [DOI] [PubMed] [Google Scholar]
- 15.Kearns WG, Yamaguchi H, Young NS, et al. Centrosome amplification and aneuploidy in bone marrow failure patients. Genes Chromosomes Cancer. 2004;40:329–33. doi: 10.1002/gcc.20043. [DOI] [PubMed] [Google Scholar]
- 16.Neben K, Giesecke C, Schweizer S, et al. Centrosome aberrations in acute myeloid leukemia are correlated with cytogenetic risk profile. Blood. 2003;101:289–91. doi: 10.1182/blood-2002-04-1188. [DOI] [PubMed] [Google Scholar]
- 17.Ganem NJ, Godinho SA, Pellman D. A mechanism linking extra centrosomes to chromosomal instability. Nature. 2009;460:278–82. doi: 10.1038/nature08136. [DOI] [PMC free article] [PubMed] [Google Scholar]
- 18.Lichter P, Boyle AL, Cremer T, et al. Analysis of genes and chromosomes by nonisotopic in situ hybridization. Genet Anal Tech Appl. 1991;8:24–35. doi: 10.1016/1050-3862(91)90005-c. [DOI] [PubMed] [Google Scholar]
- 19.Cooke HJ, Hindley J. Cloning of human satellite III DNA: different components are on different chromosomes. Nucleic Acids Res. 1979;6:3177–97. doi: 10.1093/nar/6.10.3177. [DOI] [PMC free article] [PubMed] [Google Scholar]
- 20.Archidiacono N, Antonacci R, Marzella R, et al. Comparative mapping of human alphoid sequences in great apes using fluorescence in situ hybridization. Genomics. 1995;25:477–84. doi: 10.1016/0888-7543(95)80048-q. [DOI] [PubMed] [Google Scholar]
- 21.Knight SJ, Lese CM, Precht KS, et al. An optimized set of human telomere clones for studying telomere integrity and architecture. Am J Hum Genet. 2000;67:320–2. doi: 10.1086/302998. [DOI] [PMC free article] [PubMed] [Google Scholar]
- 22.Mitelman F. Catalog of chromosome aberrations in cancer. 6th ed. New York: Wiley; 1998. [Google Scholar]
- 23.Greenberg P, Cox C, LeBeau MM, et al. International scoring system for evaluating prognosis in myelodysplastic syndromes. Blood. 1997;89:2079–88. [PubMed] [Google Scholar]
- 24.Nimer SD. Myelodysplastic syndromes. Blood. 2008;111:4841–51. doi: 10.1182/blood-2007-08-078139. [DOI] [PubMed] [Google Scholar]
- 25.Breems DA, Van Putten WL, De Greef GE, et al. Monosomal karyotype in acute myeloid leukemia: a better indicator of poor prognosis than a complex karyotype. J Clin Oncol. 2008;26:4791–7. doi: 10.1200/JCO.2008.16.0259. [DOI] [PubMed] [Google Scholar]
- 26.Kerbauy DB, Deeg HJ. Apoptosis and antiapoptotic mechanisms in the progression of myelodysplastic syndrome. Exp Hematol. 2007;35:1739–46. doi: 10.1016/j.exphem.2007.09.007. [DOI] [PMC free article] [PubMed] [Google Scholar]
- 27.Li X, Bryant CE, Deeg HJ. Simultaneous demonstration of clonal chromosome abnormalities and apoptosis in individual marrow cells in myelodysplastic syndrome. Int J Hematol. 2004;80:140–5. doi: 10.1532/ijh97.na0402. [DOI] [PubMed] [Google Scholar]
- 28.Rebacz B, Larsen TO, Clausen MH, et al. Identification of griseofulvin as an inhibitor of centrosomal clustering in a phenotype-based screen. Cancer Res. 2007;67:6342–50. doi: 10.1158/0008-5472.CAN-07-0663. [DOI] [PubMed] [Google Scholar]
- 29.Williams BR, Prabhu VR, Hunter KE, et al. Aneuploidy affects proliferation and spontaneous immortalization in mammalian cells. Science. 2008;322:703–9. doi: 10.1126/science.1160058. [DOI] [PMC free article] [PubMed] [Google Scholar]
- 30.Torres EM, Sokolsky T, Tucker CM, et al. Effects of aneuploidy on cellular physiology and cell division in haploid yeast. Science. 2007;317:916–24. doi: 10.1126/science.1142210. [DOI] [PubMed] [Google Scholar]
- 31.Jackson AL, Loeb LA. The mutation rate and cancer. Genetics. 1998;148:1483–90. doi: 10.1093/genetics/148.4.1483. [DOI] [PMC free article] [PubMed] [Google Scholar]
Associated Data
This section collects any data citations, data availability statements, or supplementary materials included in this article.
Supplementary Materials
Table S1: Patient characteristics
Table S2: Structural CIN: results and patient group characteristics
Please note: Wiley-Blackwell are not responsible for the content or functionality of any supporting information supplied by the authors. Any queries (other than missing material) should be directed to the corresponding author for the article.