

Abstract
Mesenchymal stem cells (MSCs) provide us an excellent cellular model to uncover the molecular mechanisms underlying adipogenic differentiation of adult stem cells. PPARγ had been considered as an important molecular marker of cells undergoing adipogenic differentiation. Here, we demonstrated that expression and phosphorylation of PPARγ could be found in bone marrow–derived MSCs cultured in expansion medium without any adipogenic additives (dexamethasone, IBMX, insulin or indomethacin). Then, PPARγ was dephosphorylated in MSCs during the process of adipogenic differentiation. We then found that inhibition of MEK activation by specific inhibitor (PD98059) counteracted the PPARγ expression and phosphorylation. However, expression and phosphorylation of PPARγ did not present in MSCs cultured in medium with lower serum concentration. When these MSCs differentiated into adipocytes, no phosphorylation could be detected to accompany the expression of PPARγ. Moreover, exposure of MSCs to higher concentration of serum induced stronger PPARγ expression, and subsequently enhanced their adipogenesis. These data suggested that activation of the MEK/ERK signalling pathway by high serum concentration promoted PPARγ expression and phosphorylation, and subsequently enhanced adipogenic differentiation of MSCs.
Keywords: peroxisome proliferator–activated receptor γ, mesenchymal stem cells, adipogenesis, mitogen-activated protein kinase, extracellular signal-regulated kinase
Introduction
Mesenchymal stem cells (MSCs) are a group of multi-potent adult stem cells that have been isolated from organs and tissues investigated so far, including bone marrow, dermis, muscular tissue, hair follicles, the periodontal ligament and placenta as well as adipose tissue [1]. MSCs may undergo self-renewal for several generations while maintaining their capacity to differentiate into multi-lineage tissues such as bone, cartilage, myocardial and adipose tissue [2]. MSCs derived from bone marrow are non-haematopoietic stem cells found in the stroma of the bone marrow [3]. They are easily isolated, cultured and expanded in the laboratory setting. All of these characteristics make MSCs an attractive cell source for clinical applications, including cell-based therapies and tissue engineering [4–6]. In addition, MSCs also provide us excellent model to uncover the regulation of adipocyte differentiation from precursor cells and the insulin sensitivity of mature adipocytes, which are vital for fat tissue regeneration and treatment of obesity and insulin resistance. Nowadays, most functional studies on adipogenic differentiation and function have been performed in the murine adipogenic 3T3-L1 cell line [7]. However, research based on adipogenic differentiation of adult stem cell model would be more useful in translating these data to clinical applications.
Peroxisome proliferator-activated receptors (PPARs) are a group of ligand-dependent nuclear receptors responsible for gene expression regulation [8, 9], and generally function as transcriptional regulators of adipogenic differentiation and lipid metabolism [10]. So far, three members of the PPAR sub-family has been identified: PPARα, PPARβ (also called PPARδ) and PPARγ[11, 12], each has different ligands, target genes and biological functions [13]. PPARγ, expressed predominantly in adipose tissue and the immune system [14], has been demonstrated to be a master regulator of adipogenesis and metabolic homeostasis [15, 16]. The critical role of PPARγ in cellular differentiation and insulin sensitization has been demonstrated in PPARγ knockout animals [17–19]. Suppression of PPARγ function through RNA interference leads to cellular differentiation towards osteoblasts rather than adipocytes in multi-potent mesenchymal stem cells [20], suggesting that PPARγ may act as a gatekeeper of multi-potency in mesenchymal cells.
Similar to other nuclear receptors, PPARγ are phosphoprotein and its transcriptional activity is severely affected by cross-talk with kinases and phosphatases. The regulation of PPARγ activity through phosphorylation is complex and controversial. The major phosphorylation site of PPARγ, which is used by both extracellular signal-regulated kinase (ERK)- and JNK-MAPK [21], was mapped at serine 82 of mouse PPARγ1, which corresponds to serine 112 of mouse PPARγ2 [22]. Phosphorylation of PPARγ by activating mitogen-activated protein kinase (MAPK) signalling pathway reduces its transcriptional activity and subsequently inhibit adipogenic differentiation, whereas PPARγ2 with a non-phosphorylatable mutation at serine-112 help cells to resist to inhibition of differentiation by mitogens [23]. Inhibition of p38MAPK with chemical inhibitors or p38MAPK gene knockout increases adipogenesis in embryonic stem cells [24]. Mutation of the main MAPK site of phosphorylation in PPARγ2 (S112D) exhibits a decreased ligand-binding affinity [22]. It has been proposed that phosphorylation-mediated inhibition of transcriptional activity of nuclear receptors is an important ‘off-switch’ of ligand-induced activity [25]. However, not all phosphorylation events are inhibitory to adipogenic differentiation. Insulin treatment increases the ligand-independent transcriptional activity of PPARγ and enhances the TZD-induced PPARc transactivating function [26]. It was also reported that activation of MAPK/ERK pathway is required for adipogenic differentiation in an embryonic stem cells and in rat subcutaneous pre-adipocytes [27, 28]. It is possible that both claims are correct because the precise timing of MAPK activation during the initial stages of the differentiation process may determine its effect on the final destination of cells [29].
We recently reported that a group of MSCs derived from adipose tissue was found expressing PPARγ prior to adipogenic differentiation and lipid accumulation [30]. Here in this study, we found these cells also present in bone marrow derived MSCs. More interestingly, PPARγ found in bone marrow MSCs was phosphorylated. Thus, these cells provide us an excellent cellular model to investigate the regulation of PPARγ phosphorylation during the process of adipogenic differentiation of adult stem cells.
Materials and methods
Cell culture
In line with the International Guiding Principles for Animal Research (1985), bone marrow–derived MSCs were isolated as we previously reported [31]. Briefly, MSCs were harvested from the bone marrow of the femurs and tibias of 8-week-old BALB/c mice by inserting a 5-gauge needle into the shaft of the bone and flushing with α-modified Eagle’s medium (α-MEM) containing 2, 10 or 20% foetal bovine serum (FBS), 100 U/ml penicillin and 100 μg/ml streptomycin (expansion medium). Cells from one mouse were plated into one T25 flask. After 48 hrs, floating cells were discarded, and adherent cells were washed with phosphate-buffered saline (PBS). Cells were then incubated in expansion medium for 7–10 days to reach confluence and subcultured to passage 2 for further experiments. All experiments used passage 2 of MSCs unless otherwise stated. All cell culture reagents were purchased from Gibico, Invitrogen (Grand Island, NY) unless otherwise stated.
For inhibition of MAPK signalling pathway, specific inhibitors were dissolved in DMSO, and then 50 μM of PD98059 (Calbiochem, San Diego, CA) or 10 μM of PD169316 (Calbiochem) was added to the expansion medium. The same amount of DMSO was added in expansion medium containing 10% FBS as control.
Adipogenic differentiation, Oil Red O staining and quantification
For adipogenic differentiation, cells were cultured for 14 days in adipogenic medium containing α-MEM supplemented with 10% FBS, 1 μM dexamethasone (Sigma, Beijing, China), 10 μM insulin (Sigma), 200 μM indomethacin (Sigma) and 0.5 mM isobutyl-methylxanthine (IBMX; Sigma). The medium was replaced every 2 days. Differentiated MSCs were then applied to Oil Red O staining and quantification according to previously reported methods [32]. MSCs were fixed in a 10% formaldehyde solution (Sigma) for 1 hr, washed with 60% isopropanol (Sigma) and stained with Oil Red O solution (in 60% isopropanol) for 5 min. followed by repeated washing with PBS. After microscopy observation, Oil Red O was destained by 100% isopropanol for 15 min. The optical density (O.D.) of the solution was measured at 540 nm with HTS 7000 Plus Bio Assay reader (Perkin-Elmer, Boston, MA, USA).
RNA isolation, RT-PCR and real-time PCR
RNA samples of MSCs cultured in expansion medium or adipogenic medium were isolated with a Total Tissue/cell RNA Extraction Kits (Watson, Shanghai, China) according to the manufacturer’s protocol. One microgram of total RNA was reverse transcribed into cDNA in a 20-ml reverse transcription system (Fermentas, Vilnius, Lithuania) according to the manufacturer’s instructions. The cDNA samples were amplified with a Pfu PCR kit (Tiangen, Beijing, China), and the specific primers were displayed in Table 1. All PCR products were resolved on a 2% agarose gel.
Table 1.
Forward (F) and Reverse (R) primer pairs used for RT-PCR to detect gene expression pattern in MSCs
| Gene name | Primer sequence | Product size | Gene bank no. |
|---|---|---|---|
| C/EBPα | F: 5′TTACAACAGGCCAGGTTTCC 3′ | 232 | NM_007678 |
| R: 5′CTCTGGGATGGATCGATTGT 3′ | |||
| PPARγ | F: 5′GACCACTCGCATTCCTTT 3′ | 266 | NM_011146 |
| R: 5′CCACAGACTCGGCACTCA 3′ | |||
| PPARγ1 | F: 5′TGTGAGACCAACAGCCTGAC 3′ | 109 | NM_001127330 |
| R: 5′AGTGGTTCACCGCTTCTTTC 3′ | |||
| PPARγ2 | F: 5′TGCACTGCCTATGAGCACTT 3′ | 131 | NM_011146 |
| R: 5′TGATGTCAAAGGAATGCGAG 3′ | |||
| LPL | F: 5′AGGGTGAGGAATCTAATG 3′ | 270 | NM_008509 |
| R: 5′CAGGTGTTTCAACCGCTA 3′ | |||
| aP2 | F: 5′CATCAGCGTAAATGGGGATT 3′ | 182 | NM_024406 |
| R: 5′TCGACTTTCCATCCCACTTC 3′ | |||
| MEK1 | F: 5′TGCCAGGCTGAACTACAGTA 3′ | 168 | NM_008927 |
| R: 5′CACAAGGCTCCCTCTCAGAC 3′ | |||
| ERK1 | F: 5′TCCAAGGGCTACACCAAATC 3′ | 208 | NM_011952 |
| R: 5′TCCAAGGGCTACACCAAATC 3′ | |||
| ERK2 | F: 5′AGAAGTCAGAGGCAGGTGGA 3′ | 192 | NM_011949 |
| R: 5′GGTGCCATCATCAACATCTG 3′ | |||
| p38 | F: 5′ATGGTGCAGGAAAACAGGAC 3′ | 161 | NM_011951 |
| R: 5′CGTCTCTCCCTTTGTTCAGC 3′ | |||
| JNK1 | F: 5′GCCACAAAATCCTCTTTCCA 3′ | 175 | NM_016700 |
| R: 5′CACATCGGGGAACATTTCT 3′ | |||
| GAPDH | F: 5′ACCACAGTCCATGCCATCAC 3′ | 492 | NM_001001303 |
| R: 5′TCCACCACCCTGTTGCTGTA 3′ | |||
Expression of PPARγ in MSCs was then quantified by real-time PCR by using the SYBR Green I PCR master mix (Takara, Dalian, China). Reactions were carried out on an ABI 7300 (Applied Biosystems, Shanghai, China) under the following conditions: cDNA was denatured for 15 min. at 94°C, followed by 40 cycles, consisting 30 sec. at 94°C, 30 sec. 58°C and 1 min. at 72°C. For each reaction, a melting curve was generated to test the primer dimmer formation and false priming. The primers for real-time PCR were as follows: PPARγ: 5′-TTTTCAAGGGTGCCAGTTTC-3′ (forward) and 5′-AATCCTTGGCCCTCTGAGAT-3′ (reverse); β-actin: 5′-TGTTACCAACTGGGACGACA-3′ (forward) and 5′-GGGGTGTTGAAGGTCTCAAA-3′ (reverse). Relative quantification of PPARγ was carried out according to ΔΔCt method [33].
Immunofluorescence and image analysis
MSCs either cultured in expansion medium or adipogenic medium were plated on glass cover slips in six-well plates 24 hrs before staining. Cells were washed briefly with PBS, fixed in 4% paraformaldehyde for 30 min. at room temperature and then permeabilized and blocked in 0.5% Triton-X 100 and 0.5% bovine serum albumin (BSA) for 15 min. at room temperature. Slips were subsequently incubated overnight at 4°C with rabbit polyclonal antibodies against PPARγ (AbCam, Cambridge, UK) or rabbit monoclonal antibody against PPARγ with phosphoserine at residue 82 (Upstate, Lake Placid, NY). Sequentially, slides were incubated with secondary antibodies conjugated to Rhodamine or FITC (Pierce, Rockford, IL), and nuclei were stained with 4,6-diamidino-2-phenylindole (DAPI; Molecular Probes, Eugene, OR). For MSCs differentiated into adipocytes, Oil Red O staining was then performed to visualize fat drop. After rinsing in PBS, cells were observed and imaged with DMi 6000 B fluorescent microscope (Leica, Bensheim, Germany).
To determine the percentage of PPARγ and pho-PPARγ expressing cells, the numbers of positive cells and total cells were counted manually. For each condition, at least three slides were stained and examined. For each slide, one to two fields (100× magnifications) were randomly chosen to make sure at least 100 of total cells were analyzed.
Protein extraction and Western blot
Before cell dissolving, cell layers were washed three times with PBS buffer, then total proteins were extracted by protein extract reagents (Pierce), followed by centrifugation (13,000 ×g for 15 min.) to remove cellular debris. Protein concentration was assessed by BCA kit (Pierce) according to the manufacturer’s instructions. Twenty-five microgram of total proteins was analyzed by Western blotting using polyclonal anti-PPARγ antibody (AbCam) or anti-PPARγ (phosphor 112) antibody (AbCam). Immunocomplexes were visualized using enhanced chemiluminescence reagent (Pierce) according to the manufacturer’s instructions.
Statistical analysis
We performed three or more independent sets of the experiments, and each experiment was run at least 3 times. Data were shown as average with indicated standard deviation. Means ± S.D. and P values were calculated using Student’s t-test. P <0.05 was considered as statistically significant.
Results
PPARγ expressed and phosphorylated in undifferentiated MSCs
PPARγ has been considered as a molecular marker of cells undergoing adipogenic differentiation [34]. However, we recently reported that PPARγ was found expressing in a group of adipose-derived mesenchymal stem cells cultured in expansion medium [30]. Here, in this study, we examined the expression of PPARγ in undifferentiated MSCs (derived from murine bone marrow) with immunofluorescence. Unsurprisingly, we found a group of cells that were positive for PPARγ before adipogenic differentiation (Fig. 1A left panel). Further analysis showed that PPARγ was phosphorylated in undifferentiated MSCs (Fig. 1A right panel). To test the potential effects of passaging on PPARγ expression and phosphorylation, we repeated the experiments with primary MSCs and got a similar result (Fig. 1B). Furthermore, percentages of positive cells between different passages are not significantly different (Fig. 1C). These results were also confirmed by Western blot (Fig. 1D). Because PPARγ is expressed as two protein isoforms, both of which can be detected by immunoreaction, we performed RT-PCR with primers specific to PPARγ, PPARγ1 and PPARγ2. It turned out to be only PPARγ2 expressed in the undifferentiated and differentiated MSCs.
Fig 1.
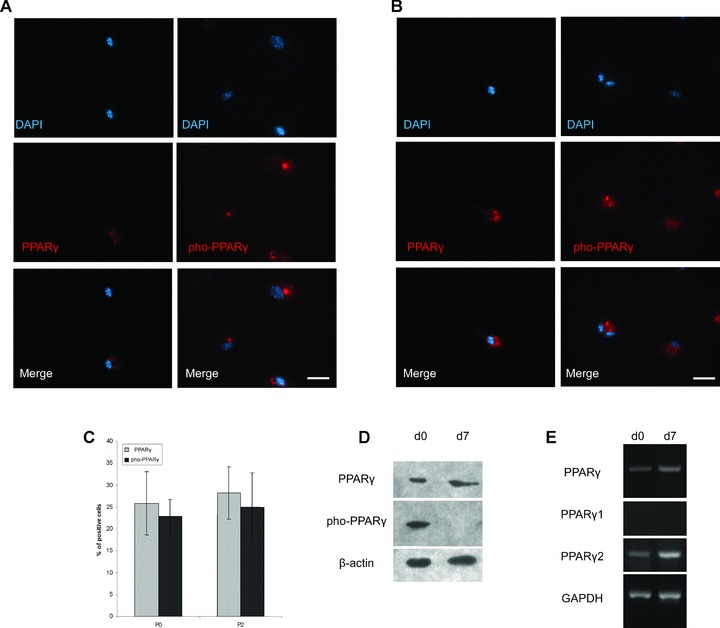
Expression and phosphorylation of PPARγ in undifferentiated MSCs. (A) PPARγ was expressed and phosphorylated in undifferentiated MSC. MSCs were sub-cultured to passage 2 in expansion medium containing 10% FBS, before immunofluorescent analysis; secondary antibodies conjugated to rhodamine were applied for fluorescent detection. Scale bar = 50 μm. (B) PPARγ was also expressed and phosphorylated in primary MSCs. Primary MSCs cultured in expansion medium containing 10% FBS were directly applied to immunofluorescent analysis. Secondary antibodies conjugated to rhodamine were used. Scale bar = 50 μm. (C) Percentages of positive cells are similar between different passages of MSCs. Immunofluorescent images were analyzed to compare PPARγ expression and phosphorylation between primary culture and passage 2 of MSCs. Positive cell ratio was calculated as percentage of total cell number. Data were represented as mean ± S.D. (n= 3). (D) Western blotting confirmed the expression and phosphorylation of PPARγ. MSCs, cultured in expansion media containing 10% FBS, were applied to adipogenic differentiation. At day 0 (d0) and day 7 (d7), total proteins of MSCs were extracted for Western blot to detect the expression and phosphorylation of PPAR. (E) RT-PCR then showed the expression of PPARγ, PPARγ isoform 1 (PPARγ1) and isoform 2 (PPARγ2). MSCs cultured in expansion medium containing 10% FBS were applied to adipogenic differentiation. At day 0 and day 7, total RNA of MSCs were isolated for RT-PCR to detect the mRNA of PPARγ, PPARγ1 and PPARγ2.
PPARγ dephosphorylated during adipogenic differentiation of MSCs
It was indicated by Western blot that phosphorylated PPARγ was not found in MSCs differentiated into adipocytes. So, we performed intensive analysis of immunofluorescence to show the dynamics of PPARγ phosphorylation during the process of adipogenic differentiation. As shown in Fig. 2A, green fluorescence showing pho-PPARγ became condensed at 3 days as compared with 1 day, and finally vanished at 7 days after adipogenic differentiation. The process of pho-PPARγ condensation and vanishing was accompanied by the deposition of lipid drops in the cytoplasm.
Fig 2.
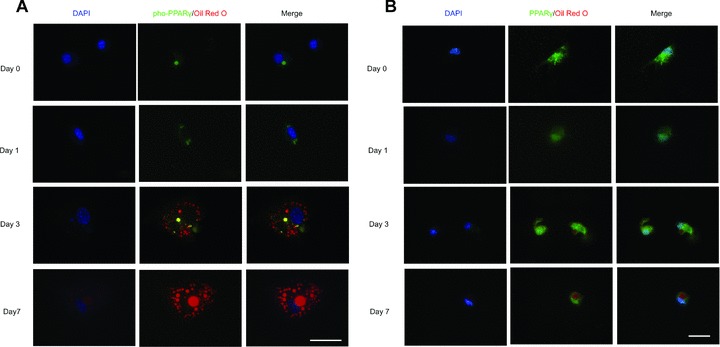
PPARγ was dephosphorylated during the differentiation of MSCs. MSCs, previously grown in expansion medium with 10% FBS, were cultured in adipogenic medium for 0, 1, 3 and 7 days before immunofluorescent staining. Antibodies against PPARγ with phosphoserine at residue 82 (A) or against PPARγ (B) were used. Then, primary antibodies were visualized with secondary antibodies conjugated to FITC; Oil Red O staining was performed to show fat drops. Scale bar = 50 μm.
We also performed immunofluorescence to show the expression and localization of total PPARγ (non-phosphorylated and phosphorylated) during the adipogenic differentiation of MSCs (Fig. 2B). The expression of total PPARγ was detected from day 1 to day 7 during adipogenic differentiation. With the expansion of lipid droplets in the cytoplasm, PPARγ finally condensed in the nuclei of MSCs.
PPARγ is phosphorylated by activation of MEK/ERK signalling pathway
In vitro assays demonstrate that ERK2 are able to phosphorylate PPARγ[35]; therefore, we first looked into the MAPKs to investigate the signalling pathway involved in the expression and phosphorylation of PPARγ. Meanwhile, it was believed that ERK can be preferentially activated by mitogens such as the serum [36], we also considered the influence of serum concentration in the medium when we examined the expression of MAPKs in MSCs. As revealed by RT-PCR, most MAPKs, except JNK, expressed in MSCs cultured in expansion medium containing 10% or 20% FBS (Fig. 3A). Data of real-time PCR indicated that higher concentration of serum led to higher expression level of PPARγ in MSCs (Fig. 3B). It was also indicated by quantitative analysis of immunofluorescence that percentage of PPARγ-expressing cells increased tremendously in MSCs cultured in expansion medium with 10% or 20% FBS compared with that with 2% FBS. Percentage of pho-PPARγ-positive cells showed big differences as well. Then we blocked the signalling pathway by specific inhibitor. Western blot showed that PD98059, which inhibits the activation of MEK1, decreased the expression of PPARγ as well as its phosphorylation (Fig. 3D). However, inhibition of p38 MAPK with PD169316 seemed to have no effects on the expression and phosphorylation of PPARγ. Meanwhile, real-time PCR also showed inhibition of MEK1 activation in MSCs’ reduced PPARγ expression level, whereas inhibition of p38MAPK slightly increased the expression of PPARγ (Fig. 3E).
Fig 3.
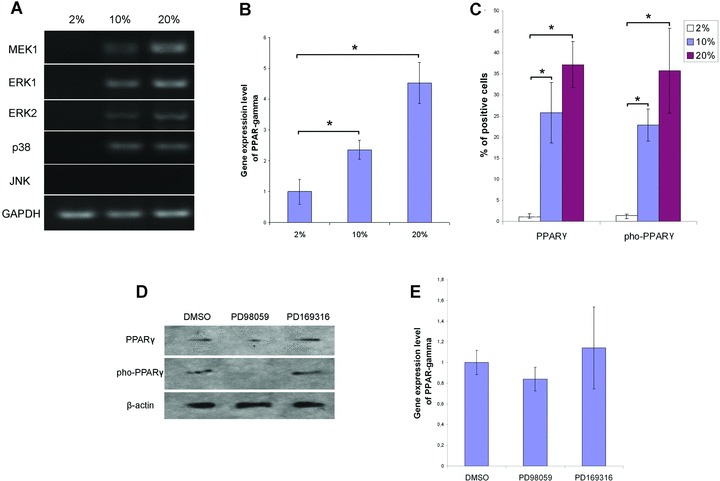
Inhibition of MEK activation reduced the expression and phosphorylation of PPARγ. (A) RT-PCR demonstrated the activation of MAPK signalling pathway. Total RNA of MSCs cultured in expansion medium was isolated for RT-PCR using the specific primers listed in Table 1. The values 2%, 10% and 20% indicate the percentages of FBS in the expansion media MSCs were kept in before RNA isolation. (B) Relative gene expression of PPARγ in MSCs cultured in different concentration of FBS. The values 2%, 10% and 20% indicate the percentages of FBS in the expansion media MSCs were kept in before RNA isolation. Data were normalized to β-actin and represented as mean ± S.D. (n= 3). * (P < 0.05) denotes statistical significance between the indicated pairs. (C) Percentages of PPARγ expressing and phosphorylating cells in MSCs. Immunofluorescent images were analyzed to compare PPARγ expression and phosphorylation in MSCs cultured in the expansion media with 2%, 10% or 20% FBS. Positive cell ratio was calculated as percentage of total cell number. Data were represented as mean ± S.D. (n= 3). (D) Inhibitor PD98059 reduced the expression and phosphorylation of PPARγ. Upon isolation of MSCs, 50 μM of PD98059 or 10 μM of PD169316 were added to the expansion medium containing 10% FBS. At the end of primary culture (7 days), total proteins of MSCs were extracted for Western blot to detect the expression and phosphorylation of PPAR. (E) Quantitative analysis of PPARγ expression when MEK and MAPK p38 was inhibited by specific inhibitor. Upon isolation of MSCs, 50 μM of PD98059 or 10 μM of PD169316 were added to the expansion medium containing 10% FBS. At the end of primary culture (7 days), total RNA of MSCs were extracted for real-time PCR. Data were normalized to β-actin and represented as mean ± S.D. (n= 3).
PPARγ is expressed without phosphorylation in MSCs cultured with low serum concentration
Then we isolated MSCs from murine bone marrow with low serum medium (2% FBS) to see if serum concentration affected the phosphorylation status of PPARγ. We used antibodies against either PPARγ or pho-PPARγ to show its expression and phosphorylation.
In the first row of Fig. 4, MSCs cultured in low serum medium show no expression and phosphorylation of PPARγ. MSCs were then applied to adipogenic medium and examined by immunofluorescence at different time points. When PPARγ was expressed at day 1, it localized in the nuclei of MSCs. Then with the continual accumulation of fat drops in cytoplasm, PPARγ retained expression in the nuclei; however, pho-PPARγ never showed up until the end of adipogenic differentiation.
Fig 4.
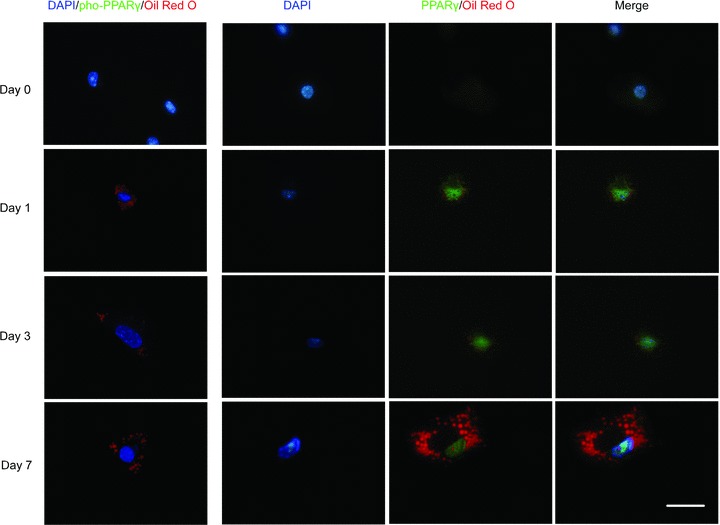
Expression and phosphorylation of PPARγ was undetectable in MSCs cultured in low concentration of serum. MSCs previously cultured in expansion medium with 2% FBS were differentiated into adipocytes for 0, 1, 3 and 7 days. Antibodies against PPARγ or against PPARγ with phosphoserine at residue 82 were used to detect the expression and phosphorylation of PPARγ. Then, primary antibodies were visualized with secondary antibodies conjugated to FITC; Oil Red O staining was then performed to show fat drops. Scale bar = 50 μm.
Higher concentration of serum enhances adipogenic differentiation of MSCs
To investigate the consequences of PPARγ expression and phosphorylation caused by different concentration of serum, we performed Oil Red O staining and quantification to show the different capacity in adipogenic differentiation of MSCs cultured in medium containing 2, 10 and 20% of FBS. As shown in Fig. 5A, MSCs accumulated more fat droplets in their cytoplasm, with the increase of serum concentration in the medium. This trend was further confirmed by the quantitative analysis of Oil Red O captured by the fat drops (Fig. 5B). RT-PCR (Fig. 5C) revealed the expression pattern of a set of adipocyte marker genes in MSCs.
Fig 5.

MSCs cultured in different concentration of serum behaved differently in adipogenic differentiation and gene expression pattern. (A) Morphology of undifferentiated MSCs (left panel) and differentiated MSCs (middle and right panel) cultured in adipogenic media. Differentiated MSCs were MSCs cultured in adipogenic medium for 7 days. The values 2%, 10% and 20% indicate the percentages of FBS in the expansion media MSCs were kept in before adipogenic differentiation. Scale bar = 100 μm. (B) Oil Red O, quantification showed an increasing trend of O.D. value with the increase of serum in the medium. At day 3, day 5 and day 7 of adipogenic differentiation, Oil Red O staining was performed and then Oil Red O captured by the fat droplets was quantified. The values 2%, 10% and 20% indicate the percentages of FBS in the expansion media MSCs were kept in before adipogenic differentiation. Data are represented as mean values ± S.D. (n= 6). * (P < 0.05) or ** (P < 0.01) denotes statistical significance between the indicated pairs. (C) RT-PCR showed different expression pattern of adipogenic genes. At day 0 and day 7 of adipogenic differentiation of MSCs, total RNA were isolated for RT-PCR. The values 2%, 10% and 20% indicate the percentages of FBS in the expansion media MSCs were kept in before adipogenic differentiation.
Discussion
PPARγ was well recognized as a key regulator of adipogenic differentiation [18]. However, we recently reported that PPARγ could be found in undifferentiated MSCs derived from adipose tissue [30]. In the present study, we found PPARγ expressed and phosphorylated a group of bone marrow–derived MSCs. Further analysis demonstrated that activation of the MEK/ERK signalling pathway by higher concentration of serum promoted PPARγ expression and phosphorylation, and subsequently enhanced adipogenic differentiation of MSCs.
We first found PPARγ expressed in bone marrow–derived MSCs cultured in expansion medium without any adipogenic additives. This is different from previous studies indicating that PPARγ was expressed in differentiated MSCs [37, 38] and activated transcription of its target genes in lipogenic pathways, including lipoprotein lipase (LPL), adipocyte fatty acid-binding protein (A-FABP or aP2), acyl-CoA synthase and fatty acid transport protein (FATP) [18]. However, our result was in agreement with other studies showing that undifferentiated 3T3-L1 fibroblasts contained significant levels of PPARγ protein in their cytoplasm [39]. More specifically, Moerman et al. reported that expression of PPARγ2 was increased with the aging of murine bone marrow–derived MSCs [40]. Their findings indicated that microenvironment changes can induce the expression of PPAR γ2 in MSCs. But why the expression of PPARγ in our cellular model did not trigger adipogenic differentiation and lipid accumulation in MSCs? Two differences in our study may provide reasonable explanations for the malfunction of PPARγ: (i) PPARγ was found in the cytoplasm of MSCs in our study. As nuclear receptor transcription factor, PPARγ has to bind to a specific element (PPRE) in the promoter region of its target genes, before it activates transcription in response to binding of the ligands [41]. So, PPARγ had been previously reported to reside mainly in the nucleus rather than in the cytoplasm [42]. (ii) Phosphorylation of PPARγ in MSCs was confirmed by immunofluorescence and Western blot. Phosphorylation decreases PPARγ affinity to its ligand by modulating the conformation of the unliganded receptor, thus reducing its transcriptional activity and inhibiting adipogenic differentiation [22].
It is believed that the phosphorylation status of proteins can influence their nuclear translocation. For example, phosphorylation of carbohydrate response element binding protein (ChREBP), a transcription factor involved in the regulation of gene transcription by glucose, impairs its translocation into the nucleus [43].Whether such a mechanism regulates PPARγ localization and transcriptional activity remains unclear. Data from the present study revealed that there was a dephosphorylation process of PPARγ during the adipogenic differentiation of MSCs. It was reported that genomic activity of PPARγ was reduced by a rapid MEK1−dependent export of PPARγ from the nucleus to the cytoplasm upon stimulation of mitogens (TPA, EGF) and PPAR—ligands [44]. Although MEK1-mediated PPARγ translocation was independent of phosphorylation according to their results, PPARγ did exist in the nucleus of MSCs after the dephosphorylation process of PPARγ in our study.
There are piles of documents demonstrating PPARγ are phosphorylated by MAPK. Epidermal growth factor (EGF) and platelet-derived growth factor (PDGF) increased phosphorylation of PPARγ through MAPK signalling, thus decreasing its ligand-dependent transcriptional activity in adipocyte cell lines [21, 23]. Treatment of insulin and constitutive activation of ERK stimulated PPARγ phosphorylation in vivo[26]. In vitro, serine 84 of human PPARγ was phosphorylated by ERK2 and JNK, and this phosphorylation was markedly reduced in the S84A mutant [35]. In our cellular model, expression of most MAPKs was revealed by RT-PCR, indicating the activation of the signalling pathway in MSCs. Moreover, inhibition of ERK activation by PD98059 decreased the expression of PPARγ as well as its phosphorylation. Surprisingly, PD169316, inhibitor for anther MAPKs (p38MAPK), seemed to have no effect on the expression and phosphorylation of PPARγ in our cellular model.
Then, another interesting finding drew our attention: MAPK was not activated in MSCs cultured in medium with low concentration of serum (2% FBS). Further examination of immunofluorescence showed that PPARγ was not phosphorylated or even expressed in these MSCs. Nevertheless, the expression and localization of PPARγ in these MSCs were quite normal upon adipogenic differentiation when compared with other cellular models [37]. With the accumulation of lipid droplets, PPARγ was continually expressed in the nuclei, functioning as normal nuclear receptor transcription factors. Both in vitro and in vivo studies demonstrated that stimulation of Rat-IR cells and NIH 3T3 with serum caused an increase in the amount of phosphorylated PPARγ[23]. So, it is clear that serum concentration in our cellular model caused the phosphorylation of PPARγ.
Our data also suggested that serum concentration not only influence the phosphorylation of PPARγ but also determined the expression of PPARγ. Increase of serum concentration in the medium promoted the expression level of PPARγ. In the cellular model of pre-adipocytes 3T3-L1, activation of the MEK/ERK signalling pathway during the initial stages of adipogenesis enhanced the activity of factors that regulate PPARγ expression [29]. Janderova et al. reported that inhibition of ERK1/2 phosphorylation by PD98059 increase the adipogenesis of human MSCs [45].
As early as the 1980s, scientists had already noted that human serum effectively promote the terminal differentiation of pre-adipocytes 3T3-L1 cell [46, 47]. In vitro study on adipogenesis of rat stromal-vascular cells demonstrated that initial concentration of FBS increased the rate of adipocyte differentiation [48]. Oreffo et al. reported that continuous treatment of human serum was required for an adipogenic differentiation model of human MSCs. Their results demonstrate that human serum contains factors that exert dramatic effects on human bone marrow cell differentiation to adipocytes [49]. It was reported that chick serum contains factors for adipocyte induction not only in vitro but also in vivo, and that the adipogenic potential does not depend on the supplements used during the cell culture [50]. Our data also indicated that MSCs showed stronger capacity in adipogenic differentiation if they were previously cultured in medium containing higher concentration of serum.
Taken together, our results indicated the expression and phosphorylation of PPARγ in undifferentiated MSCs. Then our data indicated that phosphorylation of PPARγ is dependent on the activation of MEK/ERK signalling pathway. Finally, we demonstrated that it was serum that caused the expression and phosphorylation of PPARγ, and subsequently promoted adipogenic differentiation of MSCs. These data sum up to suggest a dual effect of serum on the adipogenic differentiation of MSCs that determines the expression of PPARγ and at the same time induced its phosphorylation thus preventing it from translocation into nucleus to function as transcription factors.
Acknowledgments
We are grateful to Hao Yang, Key Laboratory of Transplant Immunology (Sichuan University) for helpful discussion. We also thank Ms. Ivy Wang for critical reading of the manuscript. This work was funded by the National Natural Science Foundation of China (No. 30801304), Specialized Research Fund for the Doctoral Program of Higher Education (No. 20070610062), Opening Funding of the State Key Laboratory of Oral Diseases, Sichuan University (No. SKLODKF200701) and Applied Fundamental Project of Sichuan Province (2008JY0028-2).
References
- 1.Turksen K. Adult stem cells. 1st ed. Totowa:: Humana Press; 2004. [Google Scholar]
- 2.Le Blanc K, Pittenger M. Mesenchymal stem cells: progress toward promise. Cytotherapy. 2005;7:36–45. doi: 10.1080/14653240510018118. [DOI] [PubMed] [Google Scholar]
- 3.Gronthos S, Zannettino AC, Hay SJ, et al. Molecular and cellular characterisation of highly purified stromal stem cells derived from human bone marrow. J Cell Sci. 2003;116:1827–35. doi: 10.1242/jcs.00369. [DOI] [PubMed] [Google Scholar]
- 4.Minguell JJ, Erices A, Conget P. Mesenchymal stem cells. Exp Biol Med. 2001;226:507–20. doi: 10.1177/153537020122600603. [DOI] [PubMed] [Google Scholar]
- 5.Cortesini R. Stem cells, tissue engineering and organogenesis in transplantation. Transpl Immunol. 2005;15:81–9. doi: 10.1016/j.trim.2005.09.013. [DOI] [PubMed] [Google Scholar]
- 6.Conrad C, Huss R. Adult stem cell lines in regenerative medicine and reconstructive surgery. J Surg Res. 2005;124:201–8. doi: 10.1016/j.jss.2004.09.015. [DOI] [PubMed] [Google Scholar]
- 7.Biddinger SB, Kahn CR. From mice to men: insights into the insulin resistance syndromes. Annu Rev Physiol. 2006;68:123–58. doi: 10.1146/annurev.physiol.68.040104.124723. [DOI] [PubMed] [Google Scholar]
- 8.Lehrke M, Lazar MA. The many faces of PPARgamma. Cell. 2005;123:993–9. doi: 10.1016/j.cell.2005.11.026. [DOI] [PubMed] [Google Scholar]
- 9.Kota BP, Huang TH, Roufogalis BD. An overview on biological mechanisms of PPARs. Pharmacol Res. 2005;51:85–94. doi: 10.1016/j.phrs.2004.07.012. [DOI] [PubMed] [Google Scholar]
- 10.Fernyhough ME, Okine E, Hausman G, et al. PPARgamma and GLUT-4 expression as developmental regulators/markers for preadipocyte differentiation into an adipocyte. Domest Anim Endocrinol. 2007;33:367–78. doi: 10.1016/j.domaniend.2007.05.001. [DOI] [PubMed] [Google Scholar]
- 11.Gurnell M. Peroxisome proliferator-activated receptor gamma and the regulation of adipocyte function: lessons from human genetic studies. Best Pract Res Clin Endocrinol Metab. 2005;19:501–23. doi: 10.1016/j.beem.2005.10.001. [DOI] [PubMed] [Google Scholar]
- 12.Kiec-Wilk B, Dembinska-Kiec A, Olszanecka A, et al. The selected pathophysiological aspects of PPARs activation. J Physiol Pharmacol. 2005;56:149–62. [PubMed] [Google Scholar]
- 13.Chinetti G, Fruchart JC, Staels B. Peroxisome proliferator-activated receptors (PPARs): nuclear receptors at the crossroads between lipid metabolism and inflammation. Inflamm Res. 2000;49:497–505. doi: 10.1007/s000110050622. [DOI] [PubMed] [Google Scholar]
- 14.Fajas L, Auboeuf D, Raspe E, et al. The organization, promoter analysis, and expression of the human PPARgamma gene. J Biol Chem. 1997;272:18779–89. doi: 10.1074/jbc.272.30.18779. [DOI] [PubMed] [Google Scholar]
- 15.Rosen ED, Spiegelman BM. PPARgamma: a nuclear regulator of metabolism, differentiation, and cell growth. J Biol Chem. 2001;276:37731–4. doi: 10.1074/jbc.R100034200. [DOI] [PubMed] [Google Scholar]
- 16.Knouff C, Auwerx J. Peroxisome proliferator-activated receptor-gamma calls for activation in moderation: lessons from genetics and pharmacology. Endocr Rev. 2004;25:899–918. doi: 10.1210/er.2003-0036. [DOI] [PubMed] [Google Scholar]
- 17.Kubota N, Terauchi Y, Miki H, et al. PPAR gamma mediates high-fat diet-induced adipocyte hypertrophy and insulin resistance. Mol Cell. 1999;4:597–609. doi: 10.1016/s1097-2765(00)80210-5. [DOI] [PubMed] [Google Scholar]
- 18.Rosen ED, Sarraf P, Troy AE, et al. PPAR gamma is required for the differentiation of adipose tissue in vivo and in vitro. Mol Cell. 1999;4:611–7. doi: 10.1016/s1097-2765(00)80211-7. [DOI] [PubMed] [Google Scholar]
- 19.Barak Y, Nelson MC, Ong ES, et al. PPAR gamma is required for placental, cardiac, and adipose tissue development. Mol Cell. 1999;4:585–95. doi: 10.1016/s1097-2765(00)80209-9. [DOI] [PubMed] [Google Scholar]
- 20.Hong JH, Hwang ES, McManus MT, et al. TAZ, a transcriptional modulator of mesenchymal stem cell differentiation. Science. 2005;309:1074–8. doi: 10.1126/science.1110955. [DOI] [PubMed] [Google Scholar]
- 21.Camp HS, Tafuri SR, Leff T. c-Jun N-terminal kinase phosphorylates peroxisome proliferator-activated receptor-gamma1 and negatively regulates its transcriptional activity. Endocrinology. 1999;140:392–7. doi: 10.1210/endo.140.1.6457. [DOI] [PubMed] [Google Scholar]
- 22.Shao D, Rangwala SM, Bailey ST, et al. Interdomain communication regulating ligand binding by PPAR-gamma. Nature. 1998;396:377–80. doi: 10.1038/24634. [DOI] [PubMed] [Google Scholar]
- 23.Hu E, Kim JB, Sarraf P, et al. Inhibition of adipogenesis through MAP kinase-mediated phosphorylation of PPARgamma. Science. 1996;274:2100–3. doi: 10.1126/science.274.5295.2100. [DOI] [PubMed] [Google Scholar]
- 24.Aouadi M, Laurent K, Prot M, et al. Inhibition of p38MAPK increases adipogenesis from embryonic to adult stages. Diabetes. 2006;55:281–9. doi: 10.2337/diabetes.55.02.06.db05-0963. [DOI] [PubMed] [Google Scholar]
- 25.Rochette-Egly C. Nuclear receptors: integration of multiple signalling pathways through phosphorylation. Cell Signal. 2003;15:355–66. doi: 10.1016/s0898-6568(02)00115-8. [DOI] [PubMed] [Google Scholar]
- 26.Zhang B, Berger J, Zhou G, et al. Insulin- and mitogen-activated protein kinase-mediated phosphorylation and activation of peroxisome proliferator-activated receptor gamma. J Biol Chem. 1996;271:31771–4. doi: 10.1074/jbc.271.50.31771. [DOI] [PubMed] [Google Scholar]
- 27.Bost F, Caron L, Marchetti I, et al. Retinoic acid activation of the ERK pathway is required for embryonic stem cell commitment into the adipocyte lineage. Biochem J. 2002;361:621–7. doi: 10.1042/0264-6021:3610621. [DOI] [PMC free article] [PubMed] [Google Scholar]
- 28.Machinal-Quelin F, Dieudonne MN, Leneveu MC, et al. Proadipogenic effect of leptin on rat preadipocytes in vitro: activation of MAPK and STAT3 signaling pathways. Am J Physiol Cell Physiol. 2002;282:C853–63. doi: 10.1152/ajpcell.00331.2001. [DOI] [PubMed] [Google Scholar]
- 29.Prusty D, Park BH, Davis KE, et al. Activation of MEK/ERK signaling promotes adipogenesis by enhancing peroxisome proliferator-activated receptor gamma (PPARgamma) and C/EBPalpha gene expression during the differentiation of 3T3-L1 preadipocytes. J Biol Chem. 2002;277:46226–32. doi: 10.1074/jbc.M207776200. [DOI] [PubMed] [Google Scholar]
- 30.Lin YF, Jing W, Wu L, et al. Identification of osteo-adipo progenitor cells in fat tissue. Cell Prolif. 2008;41:803–12. doi: 10.1111/j.1365-2184.2008.00542.x. [DOI] [PMC free article] [PubMed] [Google Scholar]
- 31.Li ZY, Chen L, Liu L, et al. Odontogenic potential of bone marrow mesenchymal stem cells. J Oral Maxillofac Surg. 2007;65:494–500. doi: 10.1016/j.joms.2006.09.018. [DOI] [PubMed] [Google Scholar]
- 32.Sen A, Lea-Currie YR, Sujkowska D, et al. Adipogenic potential of human adipose derived stromal cells from multiple donors is heterogeneous. J Cell Biochem. 2001;81:312–9. doi: 10.1002/1097-4644(20010501)81:2<312::aid-jcb1046>3.0.co;2-q. [DOI] [PubMed] [Google Scholar]
- 33.Livak KJ, Schmittgen TD. Analysis of relative gene expression data using real-time quantitative PCR and the 2(-Delta Delta C(T)) Method. Methods. 2001;25:402–8. doi: 10.1006/meth.2001.1262. [DOI] [PubMed] [Google Scholar]
- 34.Prawitt J, Niemeier A, Kassem M, et al. Characterization of lipid metabolism in insulin-sensitive adipocytes differentiated from immortalized human mesenchymal stem cells. Exp Cell Res. 2008;314:814–24. doi: 10.1016/j.yexcr.2007.11.011. [DOI] [PubMed] [Google Scholar]
- 35.Adams M, Reginato MJ, Shao DL, et al. Transcriptional activation by peroxisome proliferator-activated receptor gamma is inhibited by phosphorylation at a consensus mitogen-activated protein kinase site. J Biol Chem. 1997;272:5128–32. doi: 10.1074/jbc.272.8.5128. [DOI] [PubMed] [Google Scholar]
- 36.Bost F, Aouadi M, Caron L, et al. The role of MAPKs in adipocyte differentiation and obesity. Biochimie. 2005;87:51–6. doi: 10.1016/j.biochi.2004.10.018. [DOI] [PubMed] [Google Scholar]
- 37.Choi YS, Park SN, Suh H. Adipose tissue engineering using mesenchymal stem cells attached to injectable PLGA spheres. Biomaterials. 2005;26:5855–63. doi: 10.1016/j.biomaterials.2005.02.022. [DOI] [PubMed] [Google Scholar]
- 38.Guilak F, Lott KE, Award HA, et al. Clonal analysis of the differentiation potential of human adipose-derived adult stem cells. J Cell Physiol. 2006;206:229–37. doi: 10.1002/jcp.20463. [DOI] [PubMed] [Google Scholar]
- 39.Thuillier P, Baillie R, Sha X, et al. Cytosolic and nuclear distribution of PPARgamma2 in differentiating 3T3-L1 preadipocytes. J Lipid Res. 1998;39:2329–38. [PubMed] [Google Scholar]
- 40.Moerman EJ, Teng K, Lipschitz DA, et al. Aging activates adipogenic and suppresses osteogenic programs in mesenchymal marrow stroma/stem cells: the role of PPAR-gamma2 transcription factor and TGF-beta/BMP signaling pathways. Aging Cell. 2004;3:379–89. doi: 10.1111/j.1474-9728.2004.00127.x. [DOI] [PMC free article] [PubMed] [Google Scholar]
- 41.Kersten S, Desvergne B, Wahli W. Roles of PPARs in health and disease. Nature. 2000;405:421–4. doi: 10.1038/35013000. [DOI] [PubMed] [Google Scholar]
- 42.Berger J, Patel HV, Woods J, et al. A PPARgamma mutant serves as a dominant negative inhibitor of PPAR signaling and is localized in the nucleus. Mol Cell Endocrinol. 2000;162:57–67. doi: 10.1016/s0303-7207(00)00211-2. [DOI] [PubMed] [Google Scholar]
- 43.Kabashima T, Kawaguchi T, Wadzinski BE, et al. Xylulose 5-phosphate mediates glucose-induced lipogenesis by xylulose 5-phosphate-activated protein phosphatase in rat liver. Proc Natl Acad Sci USA. 2003;100:5107–12. doi: 10.1073/pnas.0730817100. [DOI] [PMC free article] [PubMed] [Google Scholar]
- 44.Burgermeister E, Chuderland D, Hanoch T, et al. Interaction with MEK causes nuclear export and downregulation of peroxisome proliferator−activated receptor gamma. Mol Cell Biol. 2007;27:803–17. doi: 10.1128/MCB.00601-06. [DOI] [PMC free article] [PubMed] [Google Scholar]
- 45.Janderova L, McNeil M, Murrell AN, et al. Human mesenchymal stem cells as an in vitro model for human adipogenesis. Obes Res. 2003;11:65–74. doi: 10.1038/oby.2003.11. [DOI] [PubMed] [Google Scholar]
- 46.Hauner H, Loffler G. Adipogenic factors in human serum promote the adipose conversion of 3T3-L1 fibroblasts. Int J Obes. 1986;10:323–30. [PubMed] [Google Scholar]
- 47.Nixon T, Green H. Contribution of growth hormone to the adipogenic activity of serum. Endocrinology. 1984;114:527–32. doi: 10.1210/endo-114-2-527. [DOI] [PubMed] [Google Scholar]
- 48.Richardson RL, Campion DR, Hausman GJ. Adhesion, proliferation, and adipogenesis in primary rat cell cultures: effects of collagenous substrata, fibronectin, and serum. Cell Tissue Res. 1988;251:123–8. doi: 10.1007/BF00215456. [DOI] [PubMed] [Google Scholar]
- 49.Oreffo RO, Virdi AS, Triffitt JT. Modulation of osteogenesis and adipogenesis by human serum in human bone marrow cultures. Eur J Cell Biol. 1997;74:251–61. [PubMed] [Google Scholar]
- 50.Ishizeki K, Takahashi N, Nawa T. Induction of adipogenesis by the intrasplenic transplantation of chick serum clots. Arch Histol Cytol. 2004;67:21–30. doi: 10.1679/aohc.67.21. [DOI] [PubMed] [Google Scholar]