

Abstract
Cell proliferation is a critical and frequently studied feature of molecular biology in cancer research. Therefore, various assays are available using different strategies to measure cell proliferation. Metabolic assays such as AlamarBlue, water-soluble tetrazolium salt and 3-(4,5-dimethylthiazol-2-yl)-2,5-diphenyl tetrazolium bromide, which were originally developed to determine cell toxicity, are used to assess cell numbers. Additionally, proliferative activity can be determined by quantification of DNA content using fluorophores such as CyQuant and PicoGreen. Referring to data published in high ranking cancer journals, these assays were applied in 945 publications over the past 14 years to examine the proliferative behaviour of diverse cell types. In these studies, however, mainly metabolic assays were used to quantify changes in cell growth yet these assays may not accurately reflect cellular proliferation rates due to a miscorrelation of metabolic activity and cell number. Testing this hypothesis, we compared the metabolic activity of different cell types, human cancer cells and primary cells, over a time period of 4 days using AlamarBlue and the fluorometric assays CyQuant and PicoGreen to determine their DNA content. Our results show certain discrepancies in terms of over-estimation of cell proliferation with respect to the metabolic assay in comparison to DNA binding fluorophores.
Keywords: cell proliferation, metabolic activity, proliferation assay, DNA content, cancer cells
Introduction
Proliferative behaviour is a critical features regarding the survival of cells, as such, they are frequently analysed in cancer research. Therefore, robust and reliable methods are required to determine cell proliferation during experiments. Several methods are commonly used to quantify cell proliferation, and each has its advantages and limitations [1] whereas no method is suitable for all areas of application. There seems to be a general lack of understanding amongst many users as to which assay is the most appropriate for their specific application (Table 1).
Table 1.
Comparison of different methods used to assess metabolic activity and cell proliferation
| Methodology | Advantages | Disadvantages | Technical notes | Can it quantify cell numbers? | |
|---|---|---|---|---|---|
| Haemocytometer | - Low cost | - Need to obtain single cell suspension | - Use in combination with viability dye to differentiate viable from dead cells | Yes | |
| - Direct counting | - Operator variability | - Vortex sample and recount if cell clumps appear | |||
| - No elaborate equipment required | - High error | - Beware of double counting within the grid lines | |||
| - Easy to carry out | - Use larger sample size to reduce error | ||||
| NucleoCounter | - Quick | - High cost $4 per cassette/per run | - Cell penetration and stabilizing solution is needed | Yes | |
| - Easy to carry out | - Cassettes are light sensitive | ||||
| - No operator variability | |||||
| [3H] thymidine | -Strong linear correlation with increasing cell numbers | - High cost | - After labelling strong lysis buffer is needed to permeabilize and disaggregate the culture to obtain homogenous cell suspension | No | |
| - Maintenance of equipment/ infrastructure for radioactivity work | |||||
| - Health risks associated with radioactivity | |||||
| - Need to obtain homogenous suspension | |||||
| - Indirect measurement | |||||
| - Accuracy in high cell density cultures is depended on diffusion efficiency of [3H] thymidine to reach all cells | |||||
| Flow cytometry | - High accuracy | - No reuse of cells, therefore indirect cell count | - Big technical challenge to create a suspension from single cells without any clumping | No | |
| - High reproducibility | - Time consuming with low cell numbers | - Cells cannot be reused unless using FACS- high risk of contamination | |||
| - Inexpensive if flow cytometer is available | |||||
| - No extra staining technique necessary | |||||
| MTT/MTS | - Cost: 37 c/test | - Variable metabolic behaviour under different cell culture conditions | - End-point assay | No | |
| - Easy to carry out | - Indirect measurement | - Converted formazan has to be released from the cells in order to measure the absorbance of the dye | |||
| - Complete kits are available | - No standard provided | - Plan proper controls and reagent blanks | |||
| - Phenol red free media required due to interference with assay dyes | - Establish your own standard curve for each cell line to be used | ||||
| - Dye is not water soluble thus volatile organic solvent is needed | - Use in combination with live/dead staining to confirm the results | ||||
| WST-1 | - Cost: 30 c/test | - Variable metabolic behaviour under different cell culture conditions | - Protect from light | No | |
| - Water soluble | - Indirect measurement | - Plan proper controls and reagent blanks | |||
| - One step easy to apply assay | - No standard provided | - Establish your own standard curve for each cell line to be used | |||
| - Phenol red free media required due to interference with assay dyes | - Use in combination with live/dead staining to confirm the results | ||||
| Hoechst dye | - Sensitive to DNA conformation and chromatin state in cells | - Detection of higher cell numbers from 1000 on | - Protect samples from light | No | |
| - Easy to carry out | - Low fluorescence gradient | - End-point assay | |||
| - Cell permeable stain | - AT-selectivity | - Establish your own standard curve for each cell line to be used | |||
| - Health risk for user | - Special disposal regulations | ||||
| - Mutagenic potential | |||||
| AlamarBlue | - Low cost 10 c/assay | - Variable metabolic behaviour under different cell culture conditions | - Protect samples from light | No | |
| - Non-toxic | - Indirect measurement | - Carry out trials before the actual run to determine optimal reagent concentration and incubation time to prevent signal saturation | |||
| - Easy to carry out | - No standard available from supplier, needs to be performed by user for every cell line to be tested | - Interaction with serum concentration and pH indicator phenol red | |||
| - Plan proper controls and reagent blanks with each run to eliminate data ambiguities | |||||
| PicoGreen | - Cost: 33 c/test | - Several compounds effect the signal intensity in a linear behaviour | - Protect samples from light | Approximate | |
| - ds-DNA specific | - Black plates are required | - Plan proper controls and reagent blanks with each run to eliminate data ambiguities | |||
| - Direct correlation with proliferation | - Subject to signal quenching | - Cell proliferation measured in DNA amount can be compared across specimen groups | |||
| - DNA standard provided | - DNA must be released by freeze thaw cycles or treatment with lysis reagent | - Accurate DNA amounts can be measured provided a representative DNA suspension is obtained | |||
| - Very sensitive | |||||
| - Highly reproducible | |||||
| CyQuant | - Cost: 42 c/test | - Detection of nucleic acids DNA and RNA | - Protect samples from light | Approximate | |
| - Direct correlation with proliferation | - RNAse treatment required for detection of DNA and vice versa | - Plan proper controls and reagent blanks with each run to eliminate data ambiguities | |||
| - DNA standard provided | - Black plates are compulsory | - Cell proliferation measured in DNA amount can be compared across specimen groups | |||
| - Accurate DNA amounts can be measured provided a representative DNA suspension is obtained |
Direct visual cell counting using a haemocytometer combined with a cell viability dye, is the simplest and most inexpensive method to determine cell numbers. However, it is a time consuming method, subject to operator errors, and therefore of limited value for medium to high-throughput applications [2]. Colorimetric assays such as MTT (3-(4,5-dimethylthiazol-2-yl)-2,5-diphenyl tetrazolium bromide), MTS (3-(4,5-dimethylthiazol-2-yl)-5-(3-carboxymethoxyphenyl)-2-(4-sulfonyl)-2H- tetrazolium), water-soluble tetrazolium salt (WST-1) (4-(3-(4-Iodophenyl)-2-(4-nitrophenyl)2H-5-tetrazolio)-1,3-benzene disulfonate) and AlamarBlue were originally developed to measure reagent cytotoxicity and destabilization. MTT, MTS and WST-1 are assays based on the bioreduction of tetrazolium salts from pale yellow to the dark blue formazan dye by mitochondrial dehydrogenases and are end-point assays by nature [3, 4]. AlamarBlue, also known as resazurin, is transformed from blue colour to the highly fluorescent resorufin (pink) within a redox reaction process. The exact cellular location of this reaction remains unknown, although various reaction sites have been suggested [5]. Resazurin is a water soluble and non-toxic dye that allows continuous monitoring of cultures over time, and has the advantage that further analytic assays can be performed on the same samples compared to the tetrazolium salt-based assays [5, 6]. The obvious limitation of metabolic assays is that cellular metabolic activity varies greatly throughout the lifecycle of cells.
The nucleic acid content is a tightly controlled indicator of cell numbers and cyanine dyes such as CyQuant and PicoGreen utilize this property [1]. Cyanine dyes are characterized by a low intrinsic fluorescence and large fluorescence enhancements upon binding to nucleic acid [1]. PicoGreen selectively binds dsDNA with a sensitive detection range as low as 100 cells, but sample preparation requires enzymatic digestion for optimal results [7]. CyQuant binds to both RNA and DNA but the signal intensity of DNA is up to six times greater than that of an equivalent amount of RNA. The assay is reported to be sensitive to as few as 50 cells and has a linear range up to 50,000 cells [1]. The major advantage of cyanine dyes is that they perform independently of changes in cellular metabolism.
A study by Ng and colleagues [8], which was related to tissue engineering research, found that metabolic assays were an inappropriate tool to assess cell proliferation in scaffold and matrix (three-dimensional, 3D) applications or at high cell densities in two-dimensional (2D) cultures. It was shown that metabolic activity varied greatly with cell density and did not correlate in a linear fashion. High cell densities are also a feature in cancer research, where cancer cell lines are frequently used for experiments [9]. These cell lines typically proliferate rapidly and reach high cell densities over a short period of time; especially in 2D cultures [10].
Between 1995 and 2009 (‘Google scholar’) 945 publications in high ranking cancer journals applied these assays. The literature review showed that mainly metabolic assays were used to quantify proliferative activities but such assays may not accurately reflect proliferation due to non-linear and miscorrelating changes in cell number and activity over time in culture. The aim of the present study was therefore to summarize the key features of cell proliferation assays, both metabolic and DNA-based, including underlying biochemical mechanisms in order to better support researchers to decide which method is the most appropriate for their particular application. Here, we report results of a comparative study that assessed cell proliferation using the metabolic assay AlamarBlue and the DNA quantification assays CyQuant and PicoGreen, on cancer cell lines and human primary cells. To our knowledge, this is the first study in which a detailed comparison of two human cancer cell lines and two human primary cell sources is performed. We suggested that differences in proliferative capacity of cells could be discerned applying a metabolic assay versus the DNA assays to the same samples.
Materials and methods
Literature research
Literature research was performed with the search engine ‘Google Scholar’ as this search allows the most detailed literature research. Thirteen cancer-related journals ranking from position 2 to 27 according to their impact factors in the ‘ISI Web of Knowledge’ journal citation reports were chosen.
Cells
The human ovarian carcinoma cell line OV-MZ-6 was established by draining malignant ascites from a 70-year-old female Caucasian patient suffering from advanced ovarian cancer (FIGO stage IV) [11]. The epithelial serous ovarian adenocarcinoma cell line SKOV-3 was obtained from the American Type Culture Collection (ATCC, Rockville, MD, USA) [12]. Human umbilical cord perivascular cells (HUCPVC) [13] were isolated from umbilical cord blood vessels (Tissue Regeneration and Therapeutics, Inc., ON, Canada). Human bone marrow-derived mesenchymal stem cells (bmMSC) were isolated from bone marrow of patients undergoing elective total hip/knee arthroplasty by adhesion to tissue culture plastic and monolayer expansion. Bone marrow was donated by patients after informed consent had been given and respective procedures were approved by the ethics committee of the Queensland University of Technology.
Culture medium
OV-MZ-6 cells, bmMSC and HUCPVC were cultured in Dulbeco’s modified Eagle’s medium (GIBCO, Invitrogen, VIC, Australia) [11] and SKOV-3 cells in RPMI-1640 medium (GIBCO). All media were supplemented with 10% (v/v) foetal calf serum (Thermo, InVitro Technologies, VIC, Australia) and 50 units/ml penicillin and 50 μg/ml streptomycin (GIBCO).
Cell counting
Cells were cultivated in 5% CO2 humidified atmosphere at 37°C until 60–80% confluency and harvested with either 0.05 (v/v)% ethylenediaminetetraacetic acid (EDTA; GIBCO) or 0.25 (v/v)% trypsin/EDTA (GIBCO). Cells were counted with a NucleoCounter NC-100 automatic cell counter (ChemoMetec A/S, Allerød, Denmark).
Metabolic and DNA quantification assays
AlamarBlue
Each cell type was seeded at a density of 8.3 × 10³ cells/cm2 in 100 μl culture media in triplicates onto black 96-well plates (Nunc, Rochester, NY, USA) and cultured for 4, 24, 48, 72 and 96 h without media change. Four hours prior to being assayed 10 μl of AlamarBlue reagent (DAL1025, Biosource, Camarillo, CA, USA) were added to the culture medium at a final concentration of 10% (v/v). AlamarBlue added to medium only served as negative control. Fluorescent signals (excitation 544 nm, emission 590 nm) were detected using a fluorescence plate reader (BMG PolarStar, BMG LABTECH, Offenburg, Germany). Three identical tissue culture plates were set up for each cell line at each time-point. A standard curve was generated according to the manufacturer’s instruction for each cell type ranging from 0.8 × 10³ to 5 × 10⁴ cells, displaying fluorescence as a function of cell number. The fold change of cell numbers based on metabolic activity was calculated for each time-point.
In parallel, one transparent 24-well plate (Nunc) was set up in order to image cell proliferation by phase contrast microscopy at each time-point.
CyQuant
After performing AlamarBlue as described above, medium was removed and plates frozen at −80°C for at least 48 h. Then, samples were thawed and the DNA content was measured using a CyQuant cell proliferation assay kit (C7026, Invitrogen) following the manufacturer’s instructions. Samples were incubated with Proteinase K (Invitrogen) (Proteinase K/phosphate buffered EDTA (PBE) 0.5 mg/ml) at 56°C overnight, then transferred into 1.5 ml Eppendorf tubes and topped up with PBE to a final volume of 200 μl. Fifty microlitres of sample volume were transferred into a black 96-well plate and treated with 50 μl/well RNAse for 1 h at room temperature to reassure DNA specificity. CyQuant reagent dye was added in a volume of 100 μl, incubated for 5 min protected from light at room temperature and fluorescence signals (excitation 485 nm, emission 520 nm) detected using a fluorescence plate reader. A standard curve was performed with λDNA, provided with the kit and treated equally to the sample plates. The standard ranged from 10 ng/ml to 1 μg/ml λDNA and was used to calculate the final DNA content per millilitre of sample. In order to compare results obtained from the AlamarBlue assay, the fold change of DNA content between 24 and 96 h was calculated.
PicoGreen
One hundred microlitres of sample was aliquoted into black 96-well plates and 100 μl of PicoGreen (P11496, Invitrogen) working solution according to the manufacturer’s instructions incubated for 5 min protected from light at room temperature, and fluorescence signals (excitation 485 nm, emission 520 nm) detected using a fluorescence plate reader. A standard curve was set up similar as for the CyQuant assays and the fold change of DNA content between 24 and 96 h calculated.
Calculations
To evaluate the level of correlation between the n-fold change of cell number assessed by the application of AlamarBlue and the n-fold change of DNA content using PicoGreen and CyQuant, respectively, trendlines as well as R2 values were calculated and inserted by using least square techniques in Microsoft Excel.
Results
Literature research
A search of high ranking cancer-related research journals published from 1995 to July 2009 using ‘Google Scholar’ was performed to identify relevant reports pertaining to cell proliferation and the application of the following assays: MTT, MTS, WST-1, AlamarBlue, CyQuant and PicoGreen. MTT and MTS assays resulted in estimated 4976 hits, a number too high to permit a thorough reading of each article. In contrast, search results for WST-1, AlamarBlue, PicoGreen and CyQuant were confirmed by thorough reading which revealed that WST-1 had been cited 272 times, AlamarBlue 134 times, PicoGreen 30 times and CyQuant 94 times (Fig. 1).
Fig 1.

Number of assays used to assess cell proliferation in publications of high ranking cancer journals; publications were counted from January 1995 to July 2009. A total of 60% of all researchers applied the listed assays to measure cell proliferation. Values for MTT/MTS were assessed through reading the abstracts of Medline articles retrieved through a ‘Google Scholar’ search. In the groups of WST-1, AlamarBlue, PicoGreen and CyQuant every publication was checked individually for the application of those assays.
Assessing cell proliferation
Light microscopic observation
In addition to metabolic and DNA assays, proliferation and morphology was routinely monitored by light microscopy (Fig. 2). Within 4 h of seeding an approximate 8300 cells/cm2 of each cell type, OV-MZ-6 and SKOV-3 cells, were already attached. In contrast, bmMSC and HUCPVC were attached but still rounded not exhibiting their characteristic elongated fibroblast-like shape. After 96 h OV-MZ-6 and SKOV-3 cells were already over-confluent and grew in layers on top of each other. BmMSC and HUCPVC were fully attached and spread after 24 hrs (data not shown) and proliferation was visually observed over the incubation period.
Fig 2.
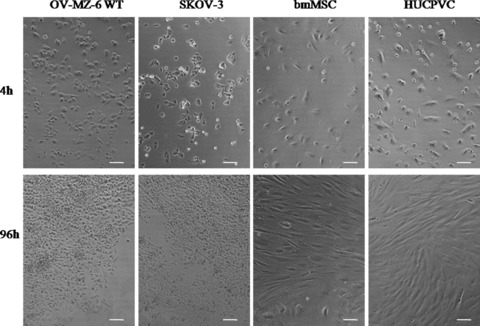
Light microscopical images of four cell types at different time-points. After 4 h of seeding 8300 cells/cm2 OV-MZ-6 and SKOV-3 cells are attached to the bottom of the cell culture plate; bmMSC are not fully attached yet as elongated fibroblast-like features are missing; HUCPVC show fibroblast-like morphology. After 96 h OV-MZ-6 and SKOV-3 cells proliferated and displayed a typical epithelial cobblestone formation; bmMSC showed slight proliferation and fibroblast-like features; HUCPVC showed typical morphological features (magnification 10×, scale bar 100 μm).
DNA content
Performing CyQuant assays the DNA content of SKOV-3 and OV-MZ-6 cells increased 7.5 and 5.3-fold, respectively, between 24 and 96 h. HUCPVC showed a 2.3-fold increase of DNA content at 24 versus 96 h and bmMSC a 1.1-fold increase over the same time period (Fig. 3A). The fold change of DNA content determined by PicoGreen revealed a 7.2-fold increase of DNA content in SKOV-3 cells and a 6.6-fold increase of DNA in OV-MZ-6 cells. The DNA content of bmMSC and HUCPVC was 1.1 and 2.3-fold, respectively, increased between 24 and 96 h (Fig. 3B).
Fig 3.
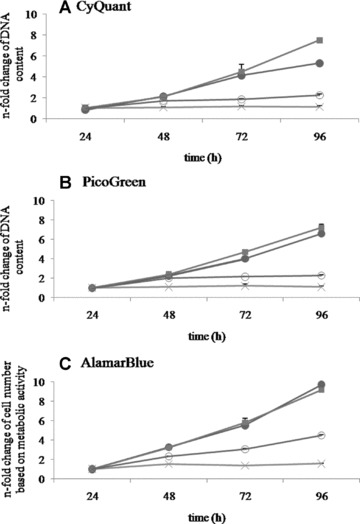
Direct comparison of n-fold change in DNA content measured by CyQuant (A) and PicoGreen (B); n-fold change of cell numbers based on metabolic activity assessed by AlamarBlue (C) after 24, 48, 72, 96 hrs of OV-MZ-6 (•), SKOV-3 (▪), HUCPVC (○), bmMSC (X). CyQuant and PicoGreen showed a 7.5/7.2- and 5.3/6.6-fold increase of DNA content of both cancer cell lines SKOV-3 and OV-MZ-6, respectively, between 24 and 96 hrs. However, AlamarBlue estimated a 9.2/9.7-fold-change of cell numbers based on metabolic activity. CyQuant and PicoGreen showed a 2.3/1.1-fold increase of DNA content of HUCPVC and bmMSC, respectively, during the 4-day time span. AlamarBlue estimated a 4.5/1.5-fold change in cell numbers of HUCPVC and bmMSC based on metabolic activity during 24 to 96 hrs in cell culture.
Metabolic activity
The apparent change in cell numbers based on metabolic activity using the AlamarBlue assay revealed a 9.2 and 9.7-fold, respectively, increase in SKOV-3 and OV-MZ-6 cells between 24 and 96 h. HUCPVC cell numbers increased 4.5-fold and bmMSC showed a 1.5-fold increase (Fig. 3C).
Correlation between metabolic and DNA quantification assays
Correlation between AlamarBlue and CyQuant cell numbers
In order to assess the correlation between the applied assays, the fold change in cell numbers based on AlamarBlue assays were plotted against the fold change of total DNA obtained from CyQuant assays. The estimated cell proliferation based on AlamarBlue correlated well with that based on CyQuant with R2 values ranging from 0.8 to 0.99; with the exception of bmMSC (R2= 0.27).
The approximate over-estimation of cell proliferation using the AlamarBlue assay ranged from 21% and 64% for all tested cell types (Fig. 4A). The deviation from the reference line became more pronounced over time and hence at higher cell densities.
Fig 4.
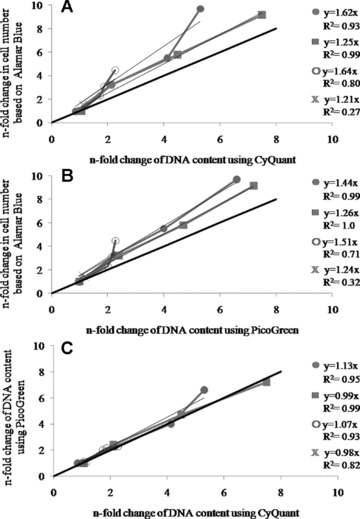
Correlations between AlamarBlue/PicoGreen (A) and AlamarBlue/ CyQuant (B) PicoGreen/CyQuant (C) assessing cell proliferation of OV-MZ-6 (•), SKOV-3 (▪), HUCPVC (○), bmMSC (X) based on the results shown in Fig. 3. The estimation of cell proliferation based on AlamarBlue correlated well with 0.7 < R2 < 1 with increased DNA measured by CyQuant and PicoGreen except for bmMSC (R2= 0.27/0.32). However, this technique resulted in an over-estimation of cell proliferation from 21% to 64%. PicoGreen and CyQuant correlated well with 0.82 < R2 < 0.99 and a deviation from the reference line from 2% to 13%.
Correlation between AlamarBlue and PicoGreen
The AlamarBlue fold-change numbers were plotted against the change of DNA content assessed with PicoGreen and were found to correlate well with the estimation of cell numbers with R2 values ranging from 0.7 and 1; except once again for bmMSC (R2= 0.32). These results led to an over-estimation of proliferation by AlamarBlue relative to PicoGreen ranging from 24% to 51% (Fig. 4B).
Correlation between PicoGreen and CyQuant
The PicoGreen and CyQuant fold-change numbers correlated extremely well with R2 values ranging from 0.82 to 0.99 for all analysed cell types, including bmMSCs. The deviation from the reference line ranged from 1% to 13% (Fig. 4C); there was a difference in correlation between high and low cell densities.
Discussion
Quantifying cell proliferation is an important procedure in cell biology and biomedical sciences, in particular in cancer research [14, 15]. A variety of assays are available to investigate cell proliferation based on different chemistries [8]. The haemocytometer is a simple and visual method for cell counting. For high-throughput applications automated counting methods, such as NucleoCount and flow cytometry, are available. Moreover, a number of nucleic acid binding dyes, such as Hoechst, CyQuant and PicoGreen, and radioactive labelling of DNA using thymidine incorporation (Table 1) are useful cell counting methods. A search of high impact factor journals describing cancer-related research revealed that various common metabolic assays, such as MTT, MTS, WST-1 and AlamarBlue, are used in the majority of reports studying cell proliferation (Fig. 1).
The results from our study reveal that the metabolic activity assay, AlamarBlue, is significantly less accurate to determine the actual number of cells. Figure 3 shows the assessment of cell proliferation by the metabolic assay AlamarBlue in comparison to the assessment of proliferation by two DNA assays individually. Figure 4 underscores that the metabolic assay over-estimates the proliferative activity of the four cell types analysed here by 21% to 64% in contrast to the DNA assays PicoGreen and CyQuant. Our data show that PicoGreen and CyQuant are both suitable assays to measure cell proliferation of various cell types with correlation values of 0.82 < R2< 0.99.
MTT is a colorimetric assay based on tetrazolium salt, and was originally established in the early 1980s to measure cytotoxicity and cell viability after drug treatment [3]. Tetrazolium salts are colourless substrates (pale yellow) which are modified to a dark blue product (formazan) in living cells by activity of various mitochondrial dehydrogenases [16]. MTT is cleaved by living and metabolically active cells; the amount of formazan generated is meant to be directly proportional to cell numbers. The various tetrazolium salt-based assays tend to have a greater affinity for different enzymes. For example, MTT is reduced by microsomal enzymes which require reduced pyridine nucleotides as an electron donor, whereas WST-1 is primarily reduced at the extracellular surface of the plasma membrane, a reaction which can be inhibited by the presence of mitochondria [17]. The underlying chemical mechanism of the tetrazolium salts MTT, XTT and WST-1 depends mainly on the positively charged quaternary tetrazole ring core containing four nitrogen atoms [4]. This central structure is surrounded by three aromatic groups that usually involve phenyl moieties. After a mild reduction, the tetrazole ring is disrupted and transforms from colourless into a brightly coloured formazan product. The positive net charge of tetrazolium salts is responsible for their successful biological applications as it facilitates the cellular uptake via the plasma membrane potential.
However, MTT is reduced by NAD(P)H-dependent oxidoreductases and dehydrogenases of metabolically active cells and produce formazans, that can be more efficiently solubilized. The need to solubilize formazan crystals prior to photometric analysis and the therefore end-point nature of the assay, limited the use of MTT and led to the development of modified tetrazolium analogues that are soluble and equilibrated in the culture medium without the need of solubilization procedures. This resulted in tetrazolium analogues linked to a negatively charged inner salt. Those modifications were associated with the need of an inner electron acceptor (IEA) to enable cellular dye reduction. The negative charge of the molecules would therefore aggravate the ability of cell penetration. This leads to the assumption that cellular reduction mediated by IEA may be extracellular and involves electron transport across the plasma membrane; a redox regulatory system links intracellular metabolism with extracellular electron acceptors. WST-1 was developed to overcome these limitations [4]. WST-1 is a negatively charged disulfonated inner salt containing an iodine residue which needs 1-methoxy-5-methyl-phenazinium methyl sulphate as its obligatory IEA. WST-1 is reduced extracellular to its soluble formazan by electron transport across the plasma membrane of living cells [17]. Thus, it can be concluded that different tetrazolium-based dyes use different enzymatic reduction sites and are dependent on various co-products.
Tetrazolium salt-based assays can also be used for the screening after drug treatments. These assays do not actually measure cell number of viable cells in a culture or their growth, but more a set of enzyme activities, that are related in various ways to the cellular metabolism. Depending on the dye chemical reduction will be associated in different ways with co-factor and/or substrate production, utilization and compartmentalization that is associated with the cell membrane, intracellular organelles and the cytosol. This reduction process is an unstable parameter dependent on cell growth, growth phase (exponential) and cell cycle. The major drawback of tetrazolium salt-based assays is the fact that they are chemically end-point assays.
AlamarBlue is a non-cytotoxic assay which was developed in order to overcome the general cell toxicity of tetrazolium salt-based assays [18]. AlamarBlue, also known as resazurin, replaces the time consuming multi-step procedures of MTT assays. The oxidized form of the AlamarBlue reagent is incubated with the cells and then converted to its reduced form resorufin by mitochondrial enzymes [18]. This reduction process results in the transformation of non-fluorescent AlamarBlue into a highly fluorescent (pink) product that can be measured colorimetrically or fluorimetrically. Moreover, AlamarBlue is a stable ready-to-use reagent, water soluble and minimally toxic to cells allowing continuous monitoring of cell cultures [19]; cells can therefore be re-used for further investigations [18]. Additionally, AlamarBlue can be used as an end-point assay or in a kinetic fashion providing an estimation of cell proliferation where as few as 80 cells give a reproducible and sensitive signal [5]. It is not known yet where the reduction of resazurin takes place; some authors have suggested that the reaction might occur in the mitochondria, at ribosomes, on the surface of plasma membranes or maybe even in the culture medium itself. A study which focused on the localizations of this redox reaction showed that highly reduced media does not lead to any fluorescent signal after the addition of AlamarBlue for 24 h, thus, cells are required to reduce resazurin into highly fluorescent resorufin [5].
This study also examined the medium and the cells after incubation with AlamarBlue separately, in which the fluorescent signal detected from the cells was much less than the fluorescent signal detected in the medium. This suggested that resazurin was taken into the cells where it was reduced by various enzymes and then secreted into the medium where a fluorescent signal was measurable. These cells were examined by confocal microscopy which revealed a fluorescence signal in the cytoplasm, not specific to any particular organelle [5]. Diaphorase has been shown to be the most likely enzyme involved in the reduction of resazurin [20]. The term diaphorase has been used to describe a number of enzymes, including dihydrolipoamine dehydrogenase, quinine oxidoreductase and flavin reductase. Diaphorases are found across all species from bacteria to mammals in which they are located either mitochondrially or cytoplasmically. This makes these enzymes good candidates for the reduction of resazurin; however, other reductases, such as NADH dehydrogenase, could also use resazurin as an electron acceptor.
Although the enzymes responsible for AlamarBlue reduction are still debated, it is a simple, fast and sensitive cell assay if one takes its limitations into account, i.e. not assessing cell proliferation. Using AlamarBlue one has to assess whether (i) the compound to be tested does not interfere with the AlamarBlue itself; (ii) the reduction rate of cells is optimized in order to avoid over-reduction of AlamarBlue into the colourless and non-fluorescent hydroresorufin and (iii) AlamarBlue is more valuable as an end-point measurement for cytotoxicity than as kinetic measure to assess cell growth [5].
In a major cytotoxicity study 117 drugs were evaluated using AlamarBlue and MTT [21]. Herewith, daunorobicin led to cell detachment but not to fragmentation of cells; however, the cells continued to convert MTT to formazan resulting in an apparent over-estimation of cell viability when applying MTT compared to AlamarBlue. Since both assays rely on enzymatic transformation it is possible that the compounds being tested could interfere with this reaction and lead to false results. Disadvantages, such as these are common in in vitro cell-based assays, warranting careful interpretation of results. It could therefore be useful to monitor the cells microscopically as a visual confirmation of cell viability [21]. Both assays performed equally well statistically and are suitable for high throughput screenings to identify cytotoxic compounds regardless of the underlying mechanism and chemical class. They are effective tools to rank compounds based on their potential intrinsic cytotoxicity. However, researchers should be aware of the possibility of false positives or negatives due to either inhibition or induction of drug metabolizing enzymes which may lead to wrong outcome [21]. It is therefore recommended to perform a live/dead staining procedure in addition to the metabolic assay to validate the results.
A number of in vitro assays have been developed to determine DNA content since cellular DNA is independent of metabolic changes. These assays are based on fluorescent signal enhancement resulting from the binding of a fluorophore to nucleotides. Propidium iodide (PI), for example, interacts with double stranded (ds) DNA and/or RNA with no preference for any nucleoside. Bisbenzimides, such as Hoechst 33258/33342 dyes, are intercalating DNA dyes with a higher preference for adenine–thymine base pairs. These dyes have been designed mainly to assess the proliferative features of fast growing cells, such as cancer cell lines or stimulated lymphocytes. On the other hand, primary cells are characterized by low mitotic activity which demands an ultra sensitive fluorochrome to monitor the exact growth kinetics [7]. The optimal fluorochrome must satisfy demands such as (i) high sensitivity; (ii) maximum fluorescent enhancement after binding to DNA; (iii) low inter- and intra-assay variability and (iv) little or no interference with extracellular matrix (ECM). Blaheta et al. showed in a comparative proliferation study of primary cells using three different dyes, PI, Hoechst 33342 and PicoGreen, that the cyanine dye PicoGreen could bind to dsDNA as low as 0.5 ng or 100 cells, whereas PI and Hoechst 33342 dyes could detect ∼1000 cells. PicoGreen had a significantly steeper fluorescent gradient compared to the other dyes; a rise in cell numbers by 1000 resulted in a fluorescent enhancement by 105 relative fluorescence units (RFU), whereas Hoechst 33342 only led to an increase by 13.7 RFU and PI by 7.7 RFU [7]. Even a small change in cell numbers resulted in a high change of fluorescence signal. These results demonstrated that PicoGreen is a DNA assay of high precision and accuracy that has little or no auto-fluorescence being ∼1/50th compared to Hoechst 33342 and 1/5th compared to PI. The high auto-fluorescence levels of Hoechst dyes and PI may be due to the interaction of fluorochromes with tissue culture plastic and assay buffers [7].
One disadvantage of PicoGreen is its inability to penetrate cell membranes, samples therefore have to be fixed or digested to assure that DNA is released to be bound by PicoGreen dyes. Blaheta et al. also demonstrated that ECM proteins did not interfere with PicoGreen signals when cells were cultured on collagen type I coated plates or when they were embedded within a collagen-gel-sandwich [7]. A limitation of PicoGreen is that some compounds are known to interfere with its sensitivity range which can result in either an increase or decrease of fluorescence signals. According to manufacturer’s instructions sodium chloride and magnesium chloride reduce signals by 30%, bovine serum albumin by 16%, whereas phenol and triton X-100 increase them by 13% and 7%, respectively. Taken together, PicoGreen satisfies most criteria necessary for an ultrasensitive DNA in vitro assay by having high sensitivity, steep fluorescence increment, low auto-fluorescence and no interference with ECM proteins.
CyQuant detects both RNA and DNA; however, fluorescence enhances up to 6-fold by binding to DNA only. Jones et al. showed that in samples with mixtures of nucleic acids large changes in RNA concentration resulted in moderate effects on the total signal intensity. Proteins at low concentrations did not interfere with the linearity of CyQuant fluorescence intensities [1]. On the other hand, high protein concentrations resulted in a high background signal, most likely caused by proteins interacting with the dye, and therefore competing with DNA for dye binding sites [1]. Therefore, CyQuant is prone to false readings in samples with high ECM content. One advantage of CyQuant is that it requires only one freeze/thaw cycle in addition to the lysis buffer in order to release nucleic acids without any digestion step compared to PicoGreen. CyQuant provides a linear fluorescence response from 50 to 50,000 cells per well. RNAse or DNAse treatment is required for separate detection of either DNA or RNA, respectively [1]. In summary, CyQuant provides adequate assessment of nucleic acid under standard culture conditions with a detection threshold of ∼10 to 50 cells. The linearity limit from 25,000 to 50,000 cells per well using a specific dye concentration can be extended up to 250,000 cells per well by increased dye concentrations. Low dye concentration in samples with high cell numbers could be one limiting factor. Additionally, CyQuant dyes are not affected by typical media components; media residues would therefore not interfere with the assay and do not require unnecessary washing steps that might cause cell loss in confluent cultures [1].
Conclusion
On the basis of our study and literature review we conclude that metabolic assays are subject to numerous variables and are therefore not optimal methods for assessing cell proliferation, given their chemical dependency on the efficiency of metabolic enzymes. We demonstrated that DNA binding cyanine dyes PicoGreen and CyQuant are equally accurate in measuring the DNA content and hence cell proliferation. Users should be aware that elements, such as salts and proteins, may interfere with the specificity of these DNA assays. In experiments containing high levels of ECM proteins, PicoGreen would be more accurate than CyQuant. On the other hand, if samples contain high salt concentrations CyQuant would be more suited than PicoGreen as the former is less prone to be affected by salts than the latter.
Acknowledgments
This work was supported by grants from the National Health and Medical Research Council of Australia and the Prostate Cancer Foundation and German Academic Exchange Service (DAAD). The authors declare that there is no conflict of interest that would prejudice the impartiality of this scientific work.
References
- 1.Jones LJ, Gray M, Yue ST, et al. Sensitive determination of cell number using the CyQUANT cell proliferation assay. J Immunol Methods. 2001;254:85–98. doi: 10.1016/s0022-1759(01)00404-5. [DOI] [PubMed] [Google Scholar]
- 2.Pierre RV. Peripheral blood film review. The demise of the eyecount leukocyte differential. Clin Lab Med. 2002;22:279–97. doi: 10.1016/s0272-2712(03)00075-1. [DOI] [PubMed] [Google Scholar]
- 3.Mosmann T. Rapid colorimetric assay for cellular growth and survival: application to proliferation and cytotoxicity assays. J Immunol Methods. 1983;65:55–63. doi: 10.1016/0022-1759(83)90303-4. [DOI] [PubMed] [Google Scholar]
- 4.Berridge MV, Herst PM, Tan AS, et al. Biotechnology Annual Review. Elsevier: 2005. Tetrazolium dyes as tools in cell biology: new insights into their cellular reduction; pp. 127–52. [DOI] [PubMed] [Google Scholar]
- 5.O’Brien J, Wilson I, Orton T, et al. Investigation of the Alamar Blue (resazurin) fluorescent dye for the assessment of mammalian cell cytotoxicity. Eur J Biochem. 2000;267:5421–6. doi: 10.1046/j.1432-1327.2000.01606.x. [DOI] [PubMed] [Google Scholar]
- 6.Al-Nasiry S, Geusens N, Hanssens M, et al. The use of Alamar Blue assay for quantitative analysis of viability, migration and invasion of choriocarcinoma cells. Hum Reprod. 2007;22:1304–9. doi: 10.1093/humrep/dem011. [DOI] [PubMed] [Google Scholar]
- 7.Blaheta RA, Kronenberger B, Woitaschek D, et al. Development of an ultrasensitive in vitro assay to monitor growth of primary cell cultures with reduced mitotic activity. J Immunol Methods. 1998;211:159–69. doi: 10.1016/s0022-1759(97)00202-0. [DOI] [PubMed] [Google Scholar]
- 8.Ng KW, Leong DT, Hutmacher DW. The challenge to measure cell proliferation in two and three dimensions. Tissue Eng. 2005;11:182–91. doi: 10.1089/ten.2005.11.182. [DOI] [PubMed] [Google Scholar]
- 9.Lopez-Barcons LA. Serially heterotransplanted human prostate tumors as an experimental model. J Cell Mol Med. 2009 doi: 10.1111/j.1582-4934.2009.00957.x. 10.1111/j.1582-4934.2009.00957.x. [DOI] [PMC free article] [PubMed] [Google Scholar]
- 10.Rattan R, Giri S, Hartmann L, et al. Metformin attenuates ovarian cancer cell growth in an AMP- kinase dispensable manner. J Cell Mol Med. 2009 doi: 10.1111/j.1582-4934.2009.00954.x. 10.1111/j.1582-4934.2009.00954.x. [DOI] [PMC free article] [PubMed] [Google Scholar]
- 11.Mobus V, Gerharz CD, Press U, et al. Morphological, immunohistochemical and biochemical characterization of 6 newly established human ovarian carcinoma cell lines. Int J Cancer. 1992;52:76–84. doi: 10.1002/ijc.2910520115. [DOI] [PubMed] [Google Scholar]
- 12.Fogh J, Fogh JM, Orfeo T. One hundred and twenty-seven cultured human tumor cell lines producing tumors in nude mice. J Natl Cancer Inst. 1977;59:221–6. doi: 10.1093/jnci/59.1.221. [DOI] [PubMed] [Google Scholar]
- 13.Sarugaser R, Lickorish D, Baksh D, et al. Human umbilical cord perivascular (HUCPV) cells: a source of mesenchymal progenitors. Stem Cells. 2005;23:220–9. doi: 10.1634/stemcells.2004-0166. [DOI] [PubMed] [Google Scholar]
- 14.Hutmacher DW, Horch RE, Loessner D, et al. Translating tissue engineering technology platforms into cancer research. J Cell Mol Med. 2009;13:1417–27. doi: 10.1111/j.1582-4934.2009.00853.x. [DOI] [PMC free article] [PubMed] [Google Scholar]
- 15.Mimeault M, Batra SK. Recent advances on skin-resident stem/progenitor cell functions in skin regeneration, aging and cancers and novel anti-aging and cancer therapies. J Cell Mol Med. 2009 doi: 10.1111/j.1582-4934.2009.00885.x. [DOI] [PMC free article] [PubMed] [Google Scholar]
- 16.Slater TF, Sawyer B, Straeuli U. Studies on succinate-tetrazolium reductase systems. Iii. Points of coupling of four different tetrazolium salts. Biochim Biophys Acta. 1963;77:383–93. doi: 10.1016/0006-3002(63)90513-4. [DOI] [PubMed] [Google Scholar]
- 17.Berridge MV, Tan AS, McCoy KD, et al. The biochemical and cellular basis of cell proliferation assays that use tetrazolium salts. Biochemica. 1996:14–9. [Google Scholar]
- 18.Nociari MM, Shalev A, Benias P, et al. A novel one-step, highly sensitive fluorometric assay to evaluate cell-mediated cytotoxicity. J Immunol Methods. 1998;213:157–67. doi: 10.1016/s0022-1759(98)00028-3. [DOI] [PubMed] [Google Scholar]
- 19.Fields RD, Lancaster MV. Dual-attribute continuous monitoring of cell proliferation/cytotoxicity. Am Biotechnol Lab. 1993;11:48–50. [PubMed] [Google Scholar]
- 20.Zalata AA, Lammertijn N, Christophe A, et al. The correlates and alleged biochemical background of the resazurin reduction test in semen. Int J Androl. 1998;21:289–94. doi: 10.1046/j.1365-2605.1998.00126.x. [DOI] [PubMed] [Google Scholar]
- 21.Hamid R, Rotshteyn Y, Rabadi L, et al. Comparison of alamar blue and MTT assays for high through-put screening. Toxicol In Vitro. 2004;18:703–10. doi: 10.1016/j.tiv.2004.03.012. [DOI] [PubMed] [Google Scholar]