

Abstract
MicroRNAs (miRNAs) are small non-coding RNAs that exert a regulatory effect post-transcriptionally by binding target mRNAs and inhibiting gene translation. miRNA expression is deregulated in cancer. The aim of this study was to characterize the differences in miRNA expression pattern and the miRNA-regulating machinery between ovarian carcinoma (OC) cells in primary tumours versus effusions. Using miRNA array platforms, we analysed a set of 21 tumours (13 effusions, 8 primary carcinomas) and identified three sets of miRNAs, one that is highly expressed in both primary carcinomas and effusions, one overexpressed in primary carcinomas and one overexpressed in effusions. Levels of selected miRNAs were analysed using quantitative PCR in an independent set of 45 additional tumours (30 effusions, 15 primary carcinomas). Reduced miR-145 and miR-214 and elevated let-7f, miR-182, miR-210, miR-200c, miR-222 and miR-23a levels were found in effusions in both sets. In silico target prediction programs identified potential target genes for some of the differentially expressed miRNAs. Expression of zinc finger E-box binding homeobox (ZEB)1 and c-Myc, targets of miR-200c, as well as of p21 protein (Cdc42/Rac)-activated kinase (PAK)1 and phosphatase and tensin homologue deleted on chromosome 10 (PTEN), predicted targets of miR-222, were analysed. Inverse correlations between expression levels of the indicated miRNAs and of the predicted target genes were found. In addition, higher expression of the miRNA-processing molecules Ago1, Ago2 and Dicer was observed in effusions compared to primary carcinomas. In conclusion, our data are the first to document different miRNA expression and regulation profiles in primary and metastatic OC, suggesting a role for these molecules in tumour progression.
Keywords: miRNA profiling, ovarian carcinoma, tumour progression, effusions
Introduction
The discovery of the lin-4 small non-coding RNA in C. elegans in 1993 [1] initiated research focused on the cellular function of microRNAs (miRNAs). Since then, the ∼21–22-nt-long non-coding RNAs have been shown to have a central role in gene expression regulation and have been implicated in many pathological conditions [2]. miRNAs exert their regulatory effect post-transcriptionally by binding the 3′-UTR of their target mRNA and inhibiting target gene translation to protein [3]. Vertebrate miRNAs target theoretically around 200 mRNA transcripts each and a single target can be co-ordinately regulated by more than one miRNA [4]. Depending on whether miRNAs target oncogenes or tumour suppressor genes, they act as tumour suppressors or oncogenes, respectively [5]. Numerous studies, using different profiling approaches, have demonstrated that miRNA expression is deregulated in various human cancers [6–9].
Primary miRNA and pre-miRNA are processed to the mature miRNA by two RNase III endonucleases – Drosha in the nucleus and Dicer in the cytoplasm [10]. The mature miRNA is then loaded to the miRNA-induced silencing complex (miRISC). The main components of the miRISC are the Argonaute (Ago) family of proteins, Ago 1–4 [3]. The miRISC is required for the action of the mature miRNA on the target mRNA. Changes in the machinery proteins affect miRNA biogenesis and action.
Ovarian carcinoma (OC), the most lethal gynaecological cancer, ranks fifth in cancer related-deaths among women and is frequently referred to as the ‘silent killer’, with the majority of patients diagnosed with advanced-stage (FIGO stages III–IV) disease [11].
miRNA expression in OC is an area of active ongoing research. Several studies have demonstrated differences in the miRNA profile of OC and benign ovarian surface epithelium [12–19], as well as in Dicer expression [20, 21]. miRNA levels in clinical OC and OC cell lines have been shown to be inversely correlated to those of target genes they regulate, including PTEN [14], Bmi-1 [22] and inhibitor of kappa light polypeptide gene enchancer in B-cells, kinase beta (IKK-β) [23]. Association between miRNA levels and clinicopathological parameters, response to chemotherapy and/or survival have been reported by several groups, with both poor and better patient outcome reported for different miRNAs [14, 24–28]. Correlation between Dicer and Drosha levels and survival has been reported by some investigators [29, 30], although others found no such role for these molecules [15, 20]. Different miRNA profile was recently reported for primary OC and recurrent disease [31]. Finally, no somatic mutations were found in 10 cancer-associated miRNA genes in clinical OC [32].
The majority of OC patients with advanced-stage disease develop malignant effusions within the peritoneal and/or pleural cavity. Our group has previously reported on molecular differences between OC cells in effusions and their counterparts in primary carcinomas [reviewed in 33]. As no comparative analysis of miRNA profiles in effusions and primary OC has been published to date, the present study compared the miRNA profiles of cancer cells at these two anatomic sites, with the aim of understanding the dynamics of miRNA regulation along tumour progression in OC. We additionally analysed the expression of the miRNA-processing machinery in the same tumour samples.
Material and methods
Patients and tumour specimens
The material analysed in the present study consisted of fresh non-fixed malignant peritoneal and pleural effusions and primary carcinomas submitted for routine diagnostic purposes to the Division of Pathology at the Norwegian Radium Hospital during the years 1998–2005. Specimens and relevant clinical data were obtained from the Section of Gynecologic Oncology at the Norwegian Radium Hospital. Effusions were centrifuged and frozen in RPMI + DMSO as cell pellets immediately upon arrival. The cellular part of the effusion was used in this study. Primary carcinoma specimens were immediately snap-frozen in liquid nitrogen.
The majority of tumours studied in each of the experiments described below was from patients diagnosed with advanced-stage (FIGO stages III–IV) OC. The eight primary carcinomas analysed using miRNA microarrays (set 1) consisted of six serous carcinomas, one endometrioid carcinoma and one undifferentiated carcinoma. All 13 effusions studied in this experiment were of the serous type. The 15 primary carcinomas in the independent set (set 2) analysed using quantitative RT-PCR (qRT-PCR) consisted of 9 serous carcinomas, 2 carcinomas of mixed histological type, 2 mucinous carcinomas, 1 clear cell carcinoma and 1 undifferentiated carcinoma. The 30 effusions studied in this experiment consisted of 27 serous carcinomas, 2 carcinomas of mixed histological type and 1 clear cell carcinoma. The 17 primary carcinomas studied using Western blotting consisted of 11 serous carcinomas, 2 carcinomas of mixed histological type, 1 endometrioid carcinoma, 1 mucinous carcinoma, 1 clear cell carcinoma and 1 undifferentiated carcinoma. The 30 effusions studied in this experiment consisted of 28 serous carcinomas and 2 carcinomas of mixed histological type. All effusions and primary tumours were reviewed by a pathologist with diagnostic experience in cytopathology and gynaecopathology (B.D.). All effusions contained >50% carcinoma cells, the remaining cells consisting of leukocytes and reactive mesothelial cells. The diagnosis of malignancy was established using morphology and immunohistochemistry. Frozen sections were obtained from all primary carcinomas to verify the presence of sufficient (>50% of the total cell population) tumour and the absence of necrosis. Effusions and primary tumours were not patient-matched.
The Regional Committee for Medical Research Ethics in Norway approved the study.
miRNA microarrays
Eight primary carcinomas were grinded with mortar and pestle in liquid nitrogen, and 13 effusions were washed with phosphate-buffered solution, followed by RNA extraction using the miRvana miRNA Isolation Kit (Ambion, Inc., Austin, TX, USA). In order to obtain only the small RNA fraction (<200 nt), the enrichment protocol of the isolation kit was followed. RNA quality and abundance following extraction were determined using an Agilent 2100 Bioanalyzer (Agilent Technologies, Santa Clara, CA, USA). Small RNA extracts of eight primary OC were pooled and hybridized against the 13 effusions.
A total of 2 μg of small RNA extracts were 3′-end labelled with Cy3 or Cy5 using the miRvana miRNA Array Labeling kit (Ambion, Inc.) and the CyDye Post-Labeling Reactive Dye Pack (GE Healthcare, Buckinghamshire, UK). Following labelling, the pool of primary tumours and each of the effusion samples were hybridized (16 hrs) to miRvana miRNA Bioarray (version 2) (Ambion, Inc.) using the miRvana Bioarray Essentials Kit (Ambion, Inc.). Thirteen arrays were generated; dye-swapping between the arrays was done.
Hybridization signals were detected and quantified using an Axon 4000B fluorescence scanner. Analysis of images was performed with Gene Pix 6.0 software package (Molecular Devices, Sunnyvale, CA, USA).
Normalization of the data was performed by expressing each miRNA relative to control miRNA sequences (Ambion, Inc.) added and labelled with each sample. This approach and the use of the same pool of primary OC on each array allowed comparisons between arrays.
Statistics
Statistical analysis of miRNA microarrays was performed by The Genomic Data Analysis Unit of Hadassah Medical School, Hebrew University of Jerusalem. The quality assurance, calibration, data normalization (Lowess) and Volcano plot for GenePix file format (GPR) files were performed by a custom-built package written in Matlab R2007a. Additional statistical analysis and clustering were carried out with the Spotfire (Somerville, MA, USA) and Partek (St. Louis, MO, USA) software packages.
Target predictions
Putative targets for miRNAs of interest were predicted using the TargetScan (http://www.targetscan.org), MiRanda (http://www.microrna.org), PicTar (http://pictar.mdc-berlin.de) and microRNA meta-predictor (MAMI) (http://mami.med.harvard.edu/) algorithms. Gene annotations and specific pathways were fingered out using online free access programs such as Onto-Express, Pathway-Express (Intelligent Systems and Bioinformatics Laboratory, Computer Science Department, Wayne State University, Detroit, MI, USA).
miRNA analysis of set 2
Total RNA including miRNAs was isolated from 15 primary carcinomas and 30 effusions using the miRNeasy Mini Kit (Qiagen GmbH, Hilden, Germany), treated with DNaseI (Qiagen GmbH). RNA quantity and quality were determined using a NanoDrop ND-1000 spectrophotometer (Thermo Scientific, Waltham, MA, USA). Conversion of miRNA and mRNA into cDNA and quantitative PCR (qPCR) detection of miRNAs was carried out according to the manufacturer’s protocols using the miScript Reverse Transcription Kit and miScript SYBR Green PCR Kit (Qiagen GmbH). qRT-PCR was performed on Mx3000P® QPCR System (Stratagene, La Jolla, CA, USA). Optimized miRNA-specific primers for each miRNA, as well as for the endogenous control 5S, were commercially available (miScript Primer Assays, Qiagen GmbH). All experiments were performed in duplicate and PCR specificity was confirmed by appropriate melting curves.
Quantitative RT-PCR
mRNA levels of ZEB1, E-cadherin, Ago1, Ago2, Dicer and the reference gene ribosomal protein, large, P0 (RPLP0) were analysed by qRT-PCR. The cDNA of 30 effusions and 17 primary solid samples was amplified by qPCR in 18 μl reactions using the DyNAmo™ SYBR® Green qPCR Kit with ROX™ passive reference dye (Finnzymes Oy, Espoo, Finland), with 200 nM of sense and antisense primers. The cycling program was according to the manufacturer’s instructions. The reaction was performed on the Mx3000P® QPCR System (Stratagene). Oligonucleotide primers for ZEB1, Ago1, Ago2 and Dicer were designed by the Primer Express program (Applied Biosystems, Foster city, CA, USA) and were as follows:
ZEB1: sense 5′-gatgacagaaaggaagggcaaga-3′, antisense 5′-caggtgcctcaggaaaaatgac-3′ (product size = 178 bp)
E-cadherin: sense 5′-gccatcgcttacaccatcct-3′, antisense 5′-ggcacctgacccttgtacgt-3′ (product size = 262 bp)
Ago1: sense 5′-cgtagagtcaaccgggaagt-3′, antisense 5′-cctcaaagtcgacccgttc-3′ (product size = 150 bp)
Ago2: sense 5′-tgcaggcgttacacgatgc-3′, antisense 5′-tacctcatggatggcaagtgc-3′ (product size = 103 bp)
Dicer: sense 5′-caggtatacttctcagccatgtga-3′, antisense 5′-gcccacttctgtcagtaaatggt-3′ (product size = 65 bp)
RPLP0 [34]: sense 5′-ccaactacttccttaagatcatccaacta-3′, antisense 5′-acatgcggatctgctgca -3′ (product size = 108 bp)
The levels of ZEB1, E-cadherin, Ago1, Ago2 and Dicer mRNA in each sample were normalized to the RPLP0 mRNA levels. The relative expression of mRNA species was calculated using the comparative CT method.
Western blot analysis
Protein from the 30 effusions and 17 primary carcinomas analysed using qRT-PCR was studied for c-Myc, PTEN, PAK1 and Ago2 expression. Depending on the protein studied, 20–30 μg protein from each specimen was resolved by 10% SDS-PAGE. The separated extracts were transferred onto Immobilon polyvinylidene fluoride (PVDF) membrane (Millipore, Bedford, MA, USA) in a transfer buffer. The membrane was then incubated with antibodies against Ago2 (Abcam, Cambridge, MA, USA), c-Myc (Santa Cruz, Santa Cruz, CA, USA), PTEN (Santa Cruz) or PAK1 (Cell Signaling, Danvers, MA, USA). Glyceraldehyde-3-phosphate dehydrogenase (GADPH) (Cell Signaling) was used as loading control.
Immunohistochemistry
Ago1 and Dicer1 protein expression was studied in 27 of the 30 effusions analysed using qRT-PCR and Western blotting using immunohistochemistry. In addition, tissue microarray slides containing 25 primary carcinomas and 39 solid metastases, the majority of the latter localized to the omentum, were immunostained. Specimens were from 34 patients with advanced-stage OC (30 serous carcinomas, 3 clear cell carcinomas, 1 endometrioid carcinoma). The rabbit polyclonal anti-Ago1 antibody was purchased from Abcam and applied diluted 1:200. The rabbit polyclonal anti-Dicer1 antibody was purchased from Atlas Antibodies AB (Stockholm, Sweden) applied diluted 1:50. Following microwave pre-treatment in Tris-ethylenediaminetetraacetic acid buffer (pH = 10) or in citrate buffer (pH = 6) for Ago1 and Dicer1, respectively, sections were incubated for 30min with Visualization was achieved using the EnVision™+ peroxidase system (Dako, Glostrup, Denmark). Negative controls consisted of sections that underwent similar staining procedures with a non-relevant antibody of the corresponding isotype (mouse IgG). Positive control consisted of an OC tissue microarray containing tumours that demonstrated immunoreactivity for the studied antigens in a pilot study.
Statistical analysis
Data were analysed using the SPSS-PC package (version 15.0, Chicago, IL, USA). Comparative analyses of mRNA and protein expression in effusions and primary carcinomas using qRT-PCR and Western blotting, respectively (continuous variables), were performed with Mann-Whitney U-test. The three-tier analysis of Ago1 and Dicer expression by immunohistochemistry in effusions, primary carcinomas and solid metastases was performed with the Kruskal–Wallis H-test. Comparison of primary carcinomas and effusions was performed with Mann-Whitney U-test.
Results
Primary carcinomas and effusions have distinct miRNA signatures
miRNA microarray analysis of set 1 showed significantly different miRNA profiles (log2 > 1.5; log2 < –1.5) in primary carcinomas and effusions (Fig. 1A). Because most of the miRNAs on the array were undetectable, we also considered the possibility that the miRNAs that were found in specimens from both sites could play an important role in this cancer. This led us to define a third group of potential interest – miRNAs that are highly expressed (cut-off > 1500 AU) in both primary carcinomas and effusions. The three groups – miRNAs overexpressed in primary carcinomas, miRNAs overexpressed in effusions, and miRNAs that are highly expressed in both groups, are shown in Figure 1B.
Fig 1.
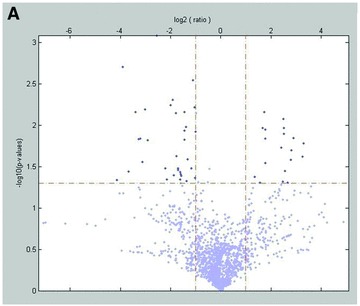
miRNA expression in primary OC versus effusions. (A) Volcano plot representation of the 13 array results. (B) Venn diagram representation of the 13 array results. The three groups shown are miRNAs overexpressed in primary OC (n= 6), miRNAs overexpressed in effusions (n= 12) and miRNAs that are highly expressed at both anatomic sites (n= 16).
qRT-PCR of selected miRNAs in set 2
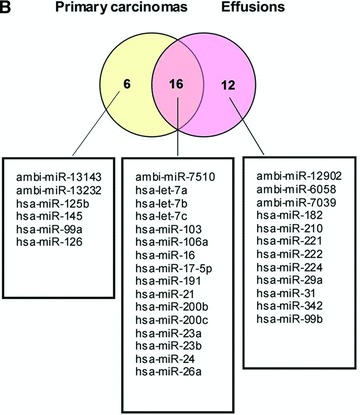
An independent set of samples comprised 15 primary carcinomas and 30 effusion specimens was studied for the expression of selected miRNAs and housekeeping genes using qRT-PCR (Fig. 2). Hsa-miR-214 expression levels did not differ between the two groups in the arrays, but this miRNA was included in the qRT-PCR analysis because it has previously been reported to be related to cell survival and chemoresistance in OC [14].
Fig 2.
qRT-PCR of miRNAs in an independent set (set 2). miRNA expression is normalized to 5S. Differences are significant (*P < 0.05) for all comparisons except for miR-222 and miR-29a.
Hsa-miR-210 (P= 0.001), hsa-miR-182 (P= 0.008) and hsa-miR-99a (P= 0.03) were significantly overexpressed in effusions compared to primary tumours, with a trend for higher expression for hsa-miR-222 (P= 0.08), whereas hsa-miR-145 was significantly overexpressed in primary carcinomas (P < 0.0001). With the exception of hsa-miR-99a, these differences were in agreement with the array data. Expression of hsa-miR-214 was significantly higher in primary OC compared to effusions in set 2 (P < 0.0001). The miR-200 family has been shown to play an important role in epithelial-to-mesenchymal transition (EMT) in various models [35–37], as well as in OC [19, 28]. In our material, hsa-miR-200c was overexpressed in effusions in set 2 (P= 0.006), although levels were comparable in set 1. Hsa-miR-23a and hsa-let-7f, a member of the let-7 family, miRNAs that have been reported to be involved in various cancer-related processes, including EMT [38], were both significantly overexpressed in effusions (P < 0.0001 and P= 0.001, respectively), although hsa-miR-23a levels were comparable at both anatomic sites in set 1. The levels of hsa-miR-29a that was differentially expressed in primary OC and in effusions in the array analysis, did not differ significantly in set 2 (P > 0.05).
miR targets of interest: predictions and expression in clinical specimens
One miRNA can potentially regulate the expression of hundreds of genes, which makes comprehensive prediction of its effect on the cell practically impossible. We used the MiRanda, PicTar, TargetScan and MAMI algorithms to find putative targets related to our miRNAs of interest, with emphasis on genes involved in adhesion, cell motility, cell cycle and other cancer-related processes. We then used Onto-Tools (Pathway-Express) to discover predicted targets that are central in pathways associated with cancer progression.
ZEB1
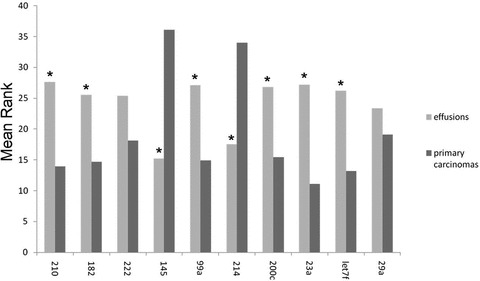
ZEB1 is a predicted and validated target of hsa-miR-200c [35]. The involvement of both molecules in EMT is established [36, 37]. As we were unable to detect ZEB1 using commercially available antibodies, we analysed ZEB1 mRNA levels by qRT-PCR. ZEB1 was more highly expressed in primary carcinomas compared to effusions (P= 0.028). In contrast, as detailed above, hsa-miR-200c was more highly expressed in effusions compared to primary OC (Fig. 3A). mRNA levels of E-cadherin, which is negatively regulated by ZEB1, were similarly higher in effusions compared to primary carcinomas (P= 0.004).
Fig 3.
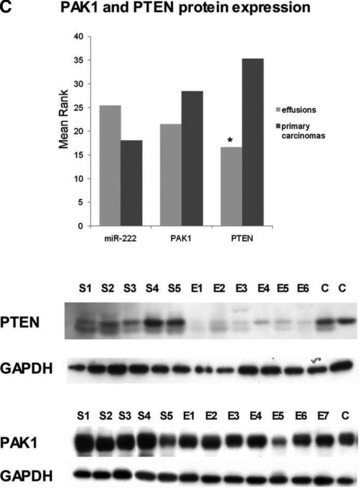
miRNA targets. (A) qRT-PCR of ZEB1 mRNA, target of miR-200c. ZEB1 expression is higher in primary OC compared to effusions, whereas the opposite is true for miR-200c (Y-axis shows mean rank; *P < 0.05 for both). (B) Western blot for c-Myc, predicted target of miR-200c. c-Myc expression is higher in primary OC compared to effusions, whereas the opposite is true for miR-200c (Y-axis shows mean rank; P < 0.05 for both). A representative blot of five solid primary OC (S) and six effusions (E) is shown. (C) Western blot for PAK1 and PTEN, predicted targets of miR-222. Expression of both proteins is higher in primary OC compared to effusions (Y-axis shows mean rank; *P < 0.05), whereas the opposite is true for miR-222. A representative blot of five solid primary OC (S) and six effusions (E) is shown for PTEN, with the same specimens as for c-Myc. C: controls (left: solid tumour tested in a pilot study; right: MCF-7 breast carcinoma). For PAK1, five solid primary OC (S) and seven effusions (E) are shown. C: OVCAR-8 cell line.
c-Myc
c-Myc is a well-defined oncogene, overexpressed in a variety of malignancies. It is a key transcription factor in many cellular processes such as proliferation, apoptosis and cell adhesion [39, 40]. Using prediction algorithms, we identified c-Myc as a putative target of hsa-miR-200c. In agreement with this, Western blot analysis demonstrated that c-Myc protein is expressed at higher levels in primary carcinomas compared to effusions (P < 0.001). This inverse relation between the miRNA and its predicted target is shown in Figure 3B.
PAK1 and PTEN
PAK1 regulates cell motility and morphology [41]. PTEN is a tumour suppressor gene that is frequently mutated in cancer [42]. Both genes are predicted targets of hsa-miR-222. We analysed the expression of the PAK1 and PTEN proteins by Western blot, and found that both proteins are more highly expressed in primary carcinomas compared to effusions (P= 0.092 and P < 0.001, respectively), in agreement with the higher hsa-miR-222 expression in effusions (Fig. 3C).
The miRNA processing machinery in OC progression
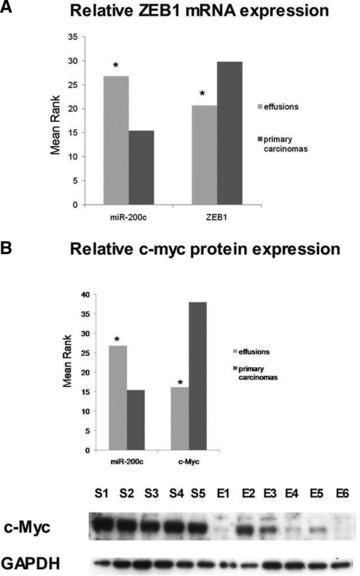
Cellular miRNA expression is tightly regulated. One of the post-transcriptional regulatory mechanisms involves changes in the expression of miRNA machinery proteins, i.e. Drosha, Dicer, miRISC components such as the Ago family members, and related proteins. We analysed Ago1, Ago2 and Dicer mRNA levels and Ago2 protein levels in primary and metastatic OC. Expression of all three genes was significantly higher in effusions (P < 0.001 for Ago1 and Ago2, P= 0.002 for Dicer, Fig. 4A). Ago2 protein expression was significantly higher in effusions compared to primary carcinomas (P= 0.001, Fig. 4B).
Fig 4.
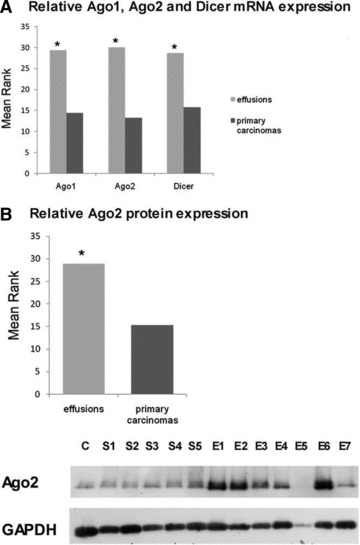
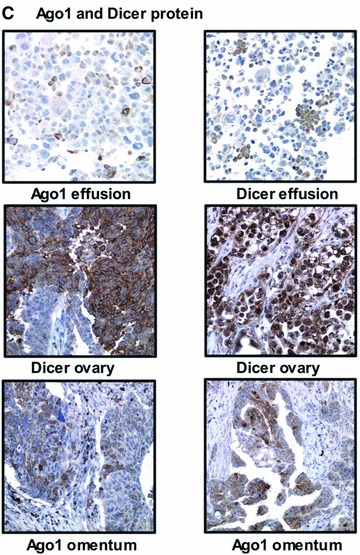
Ago and Dicer expression in OC. (A) mRNA levels of the miRNA processing machinery. Ago1, Ago2 and Dicer are more highly expressed in effusions compared to primary OC (Y-axis shows mean rank; *P < 0.05 for all). (B) Western blot for Ago2 protein. Levels are higher in effusions compared to primary OC (Y-axis shows mean rank; *P < 0.05). A representative blot of five solid OC (S) and seven effusions (E) is shown. C: MCF-7 cell line. (C) Dicer and Ago1 expression in effusions (two serous carcinomas), primary carcinomas (serous carcinoma on the left, clear cell carcinoma on the right), and solid metastases (poorly differentiated serous carcinoma on the left, well-differentiated serous carcinoma on the right) by immunohistochemistry.
Immunohistochemistry analysis showed Ago1 and Dicer expression in 27/27 and 21/27 effusions, respectively (Fig. 4C). In primary carcinomas, Ago1 and Dicer were expressed in 23/25 and 24/25 tumours, respectively, whereas both proteins were detected in 34/39 solid metastases each (Fig. 4C). In contrast to the Western blotting results, this analysis failed to show any significant differences between the three anatomic sites for Ago1 (P= 0.644) or Dicer (P= 0.077). A two-tier analysis of primary carcinomas and effusions showed comparable results for Ago1 (P= 0.451), whereas Dicer expression was higher in primary carcinomas (P= 0.03).
Discussion
Gene expression profiling of cancers was postulated to identify molecular signatures associated with poor prognosis. Recently, it was reported that approximately 50% of all annotated human miRNAs are located in areas of the genome associated with cancer [43]. Organ-specific miRNA expression profiles were described [44], as well as miRNAs that are deregulated in three or more of six different solid cancer types studied by Volinia et al.[8]. Rosenfeld et al. established an algorithm for using miRNA expression as biomarker for tracing the tissue of origin of cancers of unknown origin [45]. In the majority of studies published to date, miRNA profiles in clinical cancer specimens were compared to normal tissue of the corresponding organ or to cell lines derived from normal cells.
Because the majority of OC patients are diagnosed with advanced-stage disease, characterizing molecular events related to tumour progression is central to our understanding of this disease, and to our ability to design targeted therapy for metastatic disease. We therefore chose to analyse the miRNA expression profiles in primary OC and effusions from patients with disease spread beyond the ovary. Using this approach, we identified a miRNA set that differs from the profiles identified by comparing OC to benign ovarian cells, and that we believe represents molecular alterations that are involved in OC tumour progression. We identified three groups of miRNA: (1) highly expressed in primary OC and effusions; (2) overexpressed in primary OC and (3) overexpressed in effusions.
Comparison of previous studies of miRNA expression in OC to our data reveals certain similarities and certain differences, the latter possibly reflecting the different reference tissue used for comparison. miR-125b and miR-145 were found to be decreased in OC compared to cell lines [15], as well as in serous OC compared to normal tissue [17]. miR-214 expression was shown to be repressed in OC compared to benign cells by Nam et al.[17], whereas opposite results were reported by Yang et al.[14]. Our findings show that miR-125b, miR-145 and miR-214 are repressed in effusions compared to primary OC, suggesting a role in the inhibition of tumour progression. Alternatively, this difference may be due to the unique microenvironment of effusions, as previously discussed [33].
miR-182 was reported to be elevated in tumour cell lines [15] and in advanced-stage OC [18] compared to normal tissue, and the region containing this miR was concordantly found to be amplified in OC [15]. miR-200c was found to be elevated in tumour cell lines [12], serous OC [17] and advanced-stage OC [18] compared to normal tissue. In our study both miR-182 and miR-200c were overexpressed in effusions compared to primary OC, suggesting a role in disease progression.
miR-210 expression is stimulated under hypoxic conditions and regulated by HIF signalling, and this miR is often deleted in OC [46]. miR-210 [18], miR-222 [12, 15] and let 7f [16] were reported to be repressed in OC in comparison to normal tissue. In the present study, miR-210, miR-222 and let-7f were found to be elevated in effusion-derived OC cells compared to those in primary carcinomas, again suggesting a potential role in tumour progression from primary tumour to effusion or effect of the microenvironment. In view of the reported effect of hypoxia on miR-210 expression [46], one may speculate that the higher level of miR-210 in effusions represents effect of the microenvironment on miRNA expression, because cancer cells in effusions have no direct access to vessels.
Several of the findings observed in the array set (set 1) with respect to anatomic site-related miRNA expression were preserved in set 2, analysed using qRT-PCR. However, this was not universally the case. Opposite results were found in the two sets with respect to miR-99a expression, which was overexpressed in primary carcinomas in set 1 and in effusions in set 2. miRNAs 200c and 23a were similarly expressed at both anatomic sites in set 1, but overexpressed in effusions in set 2, whereas the opposite was true for miR-29a. The reason for the miR-99a discrepancy is the fact that there were two primary carcinomas in set 1 that had unusually high levels of this miRNA, thereby considerably affecting the results. When these two tumours were excluded from the miR-99a analysis, results were similar in both sets. As for the three other miRNAs, we attribute the differences to the fact that two different tumour sets were analysed. This clearly emphasizes the need to have an independent set, preferably larger than the array set, for data generated by high-throughput analyses, as done in the present study.
The above-detailed data suggest a dynamic miRNA equilibrium in OC cells that is considerably affected by the anatomic site in which they grow. However, our understanding of the potential biological role of these differences is limited by the large number of miRNA targets, many of which have not yet been defined. In an effort to characterize the implications of our findings for OC biology, we analysed the expression of ZEB1, c-Myc, PAK1 and PTEN, putative targets of miRNA-200c and miRNA-222. The levels of all four targets were inversely related to those of their regulatory miRNAs, suggesting that they may be indeed regulated by the latter.
We have previously shown that E-cadherin and catenins, part of the E-cadherin adhesion complex, are up-regulated in OC cells in effusions compared to corresponding primary tumours and solid metastases [47]. We further demonstrated that the E-cadherin transcriptional repressors Snail, Slug and Sip1, are differentially expressed at these anatomic sites, with an inverse association with E-cadherin expression [48]. In the present study we report on similar findings (i.e. lower expression in effusions) with respect to ZEB1, the latter presumably regulated at least in part by miR-200c. Low miR-200c and high ZEB1 would therefore induce down-regulation of E-cadherin, as seen in solid primary and metastatic OC, whereas high miR-200c, low ZEB1 and up-regulated E-cadherin characterize tumour cells in effusions. This hypothesis is supported by the finding of significantly higher E-cadherin mRNA expression in effusions compared to primary carcinomas in the present study. Our data are also in agreement with a recent publication that links the involvement of miR-200 family to EMT to OC [28].
p21-activated kinase (PAK1) is a serine/threonine protein kinase, involved in major cellular aspects, including regulation of the cytoskeleton and motility, neurogenesis, angiogenesis, metastasis, apoptosis and cell survival. We previously reported that PAK1 expression by immunohistochemistry in OC effusions is an independent prognostic marker, with opposite clinical impact in pre- and post-chemotherapy effusions [49]. Recently, we reported on a role for PAK1 in regulating E-cadherin through Snail in OC cells in vitro[50]. As ZEB1, PAK1 is more highly expressed in primary OC, where it is postulated to suppress E-cadherin expression. Its down-regulation in effusions is another mechanism promoting the re-expression of E-cadherin at this anatomic site.
The biological significance related to the reduced c-Myc expression in effusions is uncertain, as no studies to date have analysed the clinical role of this oncogene in OC effusions. In primary tumours, c-Myc overexpression was reported predominantly in clear cell and endometrioid carcinomas at both the gene and protein level [51, 52]. Data regarding the clinical role of c-Myc status in primary OC have predominantly been negative. c-Myc mRNA expression was associated better response to chemotherapy and was an independent prognostic factor for overall survival in one study [53], whereas c-Myc gene amplification or mRNA expression was not associated with any clinicopathological parameters, including survival, in three other studies [54–56]. Irrespective of the clinical relevance of c-Myc in OC, a recent study [57] may provide a molecular rationale to its down-regulation in effusions. Song et al. transfected Caov-3 cells with mutated c-Myc or si-RNA and observed reduced lysophosphatidic acid dependent vascular endothelial growth factor (VEGF) production and promoter activation, suggesting that c-Myc contributes to VEGF induction by lysophosphatidic acid. We previously reported that VEGF mRNA synthesis in OC effusions is reduced compared to patient-matched primary carcinomas and solid metastases, which we hypothesized to be related to the reduced need for angiogenesis at this anatomic site [58]. One may therefore speculate that the reduced c-Myc expression in effusions is at least partially related to the reduced need for VEGF.
An additional miRNA target we studied was the tumour suppressor phosphatase and tensin homologue deleted on chromosome 10 (PTEN), a negative regulator of the phosphatidylinositol 3-kinase (PI3K) signalling pathway. We recently reported on the low expression of PTEN, and on the frequent expression of DJ-1, a negative regulator of PTEN, in OC effusions [59]. We further reported on the association between DJ-1 expression in effusions and poor progression-free survival, and observed a similar clinical role for mTOR, a downstream target activated by the PI3K pathway [59, 60]. The present finding of an inverse association between miR-222 and PTEN in OC effusions suggests another mechanism for activating the pro-survival PI3K pathway at this anatomic site. As inhibition of the PI3K pathway is currently evaluated for its role as targeted therapy for OC [61], it is tempting to speculate that therapeutic inhibition of miR-222 may provide another mechanism of silencing this critical pathway.
The significant differences between primary and effusion-derived cancer cells in the levels of miRNAs associated with the malignant phenotype and tumour progression prompted us to evaluate the potential changes in the enzyme machinery responsible for generating miRNA, which includes Drosha, Dicer and the Ago1 and Ago2 enzymes. Merritt et al. recently reported that low expression of Dicer and Drosha is significantly associated with advanced-disease stage and suboptimal cytoreduction, respectively. Low levels of both molecules were associated with poor survival, independently so for Dicer in multivariate analysis [29]. Comparable data for Dicer were recently published by Faggad et al.[30], although Flavin et al. found no association between Dicer expression and patient survival [21]. In our study, the expression of Ago1, Ago2 and Dicer was significantly higher in effusions compared to primary carcinomas using Western blotting, though not by immunohistochemistry, suggesting altered miRNA regulation at the former anatomic site. Better understanding of the dynamics of Ago1 and Dicer expression by immunohistochemistry along tumour progression in OC and their clinical role requires analysis of a larger number of patient-matched tumours. The clinical role of Ago and Dicer expression in effusions is currently analysed in a larger cohort at our lab.
The material analysed in this study consisted predominantly of serous carcinomas in all experiments. However, a small number of tumours of other histological type were included in the analyses. We did not observe any significant differences between the serous and non-serous tumours in any of the experiments. However, analysis of a larger number of tumours from the non-serous histological variants is required in order to settle this issue.
In summary, we identified miRNAs that are highly expressed in both primary and metastatic OC, as well as miRNAs that are differentially expressed with respect to anatomic site, suggesting a role for miRNAs in tumour progression in this cancer. We further demonstrated an inverse association between miRNA expression and levels of their putative targets, supporting their suppressive role in the synthesis of these molecules.
Conflict of interest
The authors confirm that there are no conflicts of interest.
Acknowledgments
This work was supported by the Inger and Jon Fredriksen Foundation for Ovarian Cancer Research and the Norwegian Cancer Society.
References
- 1.Lee RC, Feinbaum RL, Ambros V. The C. elegans heterochronic gene lin-4 encodes small RNAs with antisense complementarity to lin-14. Cell. 1993;75:843–54. doi: 10.1016/0092-8674(93)90529-y. [DOI] [PubMed] [Google Scholar]
- 2.Conrad R, Barrier M, Ford LP. Role of miRNA and miRNA processing factors in development and disease. Birth Defects Res C Embryo Today. 2006;78:107–17. doi: 10.1002/bdrc.20068. [DOI] [PubMed] [Google Scholar]
- 3.Filipowicz W, Bhattacharyya SN, Sonenberg N. Mechanisms of post-transcriptional regulation by microRNAs: are the answers in sight. Nat Rev Genet. 2008;9:102–14. doi: 10.1038/nrg2290. [DOI] [PubMed] [Google Scholar]
- 4.Bartel DP. MicroRNAs: genomics, biogenesis, mechanism, and function. Cell. 2004;116:281–97. doi: 10.1016/s0092-8674(04)00045-5. [DOI] [PubMed] [Google Scholar]
- 5.Esquela-Kerscher A, Slack FJ. Oncomirs – microRNAs with a role in cancer. Nat Rev Cancer. 2006;6:259–69. doi: 10.1038/nrc1840. [DOI] [PubMed] [Google Scholar]
- 6.Calin GA, Croce CM. MicroRNA signatures in human cancers. Nat Rev Cancer. 2006;6:857–66. doi: 10.1038/nrc1997. [DOI] [PubMed] [Google Scholar]
- 7.Iorio MV, Ferracin M, Liu CG, et al. MicroRNA gene expression deregulation in human breast cancer. Cancer Res. 2005;65:7065–70. doi: 10.1158/0008-5472.CAN-05-1783. [DOI] [PubMed] [Google Scholar]
- 8.Volinia S, Calin GA, Liu CG, et al. A microRNA expression signature of human solid tumors defines cancer gene targets. Proc Natl Acad Sci USA. 2006;103:2257–61. doi: 10.1073/pnas.0510565103. [DOI] [PMC free article] [PubMed] [Google Scholar]
- 9.Zhang L, Huang J, Yang N, et al. microRNAs exhibit high frequency genomic alterations in human cancer. Proc Natl Acad Sci USA. 2006;103:9136–41. doi: 10.1073/pnas.0508889103. [DOI] [PMC free article] [PubMed] [Google Scholar]
- 10.Ding XC, Weiler J, Grosshans H. Regulating the regulators: mechanisms controlling the maturation of microRNAs. Trends Biotechnol. 2009;27:27–36. doi: 10.1016/j.tibtech.2008.09.006. [DOI] [PubMed] [Google Scholar]
- 11.Jemal A, Siegel R, Ward E, et al. Cancer statistics, 2008. CA Cancer J Clin. 2008;58:71–96. doi: 10.3322/CA.2007.0010. [DOI] [PubMed] [Google Scholar]
- 12.Iorio MV, Visone R, Di Leva G, et al. MicroRNA signatures in human ovarian cancer. Cancer Res. 2007;67:8699–707. doi: 10.1158/0008-5472.CAN-07-1936. [DOI] [PubMed] [Google Scholar]
- 13.Lee CH, Subramanian S, Beck AH, et al. MicroRNA profiling of BRCA1/2 mutation-carrying and non-mutation-carrying high-grade serous carcinomas of ovary. PLoS One. 2009;4:e7314. doi: 10.1371/journal.pone.0007314. [DOI] [PMC free article] [PubMed] [Google Scholar]
- 14.Yang H, Kong W, He L, et al. MicroRNA expression profiling in human ovarian cancer: miR-214 induces cell survival and cisplatin resistance by targeting PTEN. Cancer Res. 2008;68:425–33. doi: 10.1158/0008-5472.CAN-07-2488. [DOI] [PubMed] [Google Scholar]
- 15.Zhang L, Volinia S, Bonome T, et al. Genomic and epigenetic alterations deregulate microRNA expression in human epithelial ovarian cancer. Proc Natl Acad Sci USA. 2008;105:7004–9. doi: 10.1073/pnas.0801615105. [DOI] [PMC free article] [PubMed] [Google Scholar]
- 16.Dahiya N, Sherman-Baust CA, Wang TL, et al. MicroRNA expression and identification of putative miRNA targets in ovarian cancer. PLoS One. 2008;3:e2436. doi: 10.1371/journal.pone.0002436. [DOI] [PMC free article] [PubMed] [Google Scholar]
- 17.Nam EJ, Yoon H, Kim SW, et al. MicroRNA expression profiles in serous ovarian carcinoma. Clin Cancer Res. 2008;14:2690–5. doi: 10.1158/1078-0432.CCR-07-1731. [DOI] [PubMed] [Google Scholar]
- 18.Wyman SK, Parkin RK, Mitchell PS, et al. Repertoire of microRNAs in epithelial ovarian cancer as determined by next generation sequencing of small RNA cDNA libraries. PLoS One. 2009;4:e5311. doi: 10.1371/journal.pone.0005311. [DOI] [PMC free article] [PubMed] [Google Scholar]
- 19.Bendoraite A, Knouf EC, Garg KS, et al. Regulation of miR-200 family microRNAs and ZEB transcription factors in ovarian cancer: evidence supporting a mesothelial-to-epithelial transition. Gynecol Oncol. 2010;116:117–25. doi: 10.1016/j.ygyno.2009.08.009. [DOI] [PMC free article] [PubMed] [Google Scholar]
- 20.Pampalakis G, Diamandis EP, Katsaros D, et al. Down-regulation of dicer expression in ovarian cancer tissues. Clin Biochem. 2010;43:324–7. doi: 10.1016/j.clinbiochem.2009.09.014. [DOI] [PubMed] [Google Scholar]
- 21.Flavin RJ, Smyth PC, Finn SP, et al. Altered eIF6 and Dicer expression is associated with clinicopathological features in ovarian serous carcinoma patients. Mod Pathol. 2008;21:676–84. doi: 10.1038/modpathol.2008.33. [DOI] [PubMed] [Google Scholar]
- 22.Bhattacharya R, Nicoloso M, Arvizo R, et al. MiR-15a and MiR-16 control Bmi-1 expression in ovarian cancer. Cancer Res. 2009;69:9090–5. doi: 10.1158/0008-5472.CAN-09-2552. [DOI] [PMC free article] [PubMed] [Google Scholar]
- 23.Chen R, Alvero AB, Silasi DA, et al. Regulation of IKKbeta by miR-199a affects NF-kappaB activity in ovarian cancer cells. Oncogene. 2008;27:4712–23. doi: 10.1038/onc.2008.112. [DOI] [PMC free article] [PubMed] [Google Scholar]
- 24.Eitan R, Kushnir M, Lithwick-Yanai G, et al. Tumor microRNA expression patterns associated with resistance to platinum based chemotherapy and survival in ovarian cancer patients. Gynecol Oncol. 2009;114:253–9. doi: 10.1016/j.ygyno.2009.04.024. [DOI] [PubMed] [Google Scholar]
- 25.Yang N, Kaur S, Volinia S, et al. MicroRNA microarray identifies Let-7i as a novel biomarker and therapeutic target in human epithelial ovarian cancer. Cancer Res. 2008;68:10307–14. doi: 10.1158/0008-5472.CAN-08-1954. [DOI] [PMC free article] [PubMed] [Google Scholar]
- 26.Boren T, Xiong Y, Hakam A, et al. MicroRNAs and their target messenger RNAs associated with ovarian cancer response to chemotherapy. Gynecol Oncol. 2009;113:249–55. doi: 10.1016/j.ygyno.2009.01.014. [DOI] [PubMed] [Google Scholar]
- 27.Flavin R, Smyth P, Barrett C, et al. miR-29b expression is associated with disease-free survival in patients with ovarian serous carcinoma. Int J Gynecol Cancer. 2009;19:641–7. doi: 10.1111/IGC.0b013e3181a48cf9. [DOI] [PubMed] [Google Scholar]
- 28.Hu X, Macdonald DM, Huettner PC, et al. A miR-200 microRNA cluster as prognostic marker in advanced ovarian cancer. Gynecol Oncol. 2009;114:457–64. doi: 10.1016/j.ygyno.2009.05.022. [DOI] [PubMed] [Google Scholar]
- 29.Merritt WM, Lin YG, Han LY, et al. Dicer, Drosha, and outcomes in patients with ovarian cancer. N Engl J Med. 2008;359:2641–50. doi: 10.1056/NEJMoa0803785. [DOI] [PMC free article] [PubMed] [Google Scholar]
- 30.Faggad A, Budczies J, Tchernitsa O, et al. Prognostic significance of Dicer expression in ovarian cancer-link to global microRNA changes and oestrogen receptor expression. J Pathol. 2010;220:382–91. doi: 10.1002/path.2658. [DOI] [PubMed] [Google Scholar]
- 31.Laios A, O’Toole S, Flavin R, et al. Potential role of miR-9 and miR-223 in recurrent ovarian cancer. Mol Cancer. 2008;7:35. doi: 10.1186/1476-4598-7-35. [DOI] [PMC free article] [PubMed] [Google Scholar]
- 32.Bearfoot JL, Choong DY, Gorringe KL, et al. Genetic analysis of cancer-implicated MicroRNA in ovarian cancer. Clin Cancer Res. 2008;14:7246–50. doi: 10.1158/1078-0432.CCR-08-1348. [DOI] [PubMed] [Google Scholar]
- 33.Davidson B. Biological characteristics of cancers involving the serosal cavities. Crit Rev Oncog. 2007;13:189–227. doi: 10.1615/critrevoncog.v13.i3.10. [DOI] [PubMed] [Google Scholar]
- 34.Lossos IS, Czerwinski DK, Wechser MA, et al. Optimization of quantitative real-time RT-PCR parameters for the study of lymphoid malignancies. Leukemia. 2003;17:789–95. doi: 10.1038/sj.leu.2402880. [DOI] [PubMed] [Google Scholar]
- 35.Gregory PA, Bert AG, Paterson EL, et al. The miR-200 family and miR-205 regulate epithelial to mesenchymal transition by targeting ZEB1 and SIP1. Nat Cell Biol. 2008;10:593–601. doi: 10.1038/ncb1722. [DOI] [PubMed] [Google Scholar]
- 36.Park SM, Gaur AB, Lengyel E, et al. The miR-200 family determines the epithelial phenotype of cancer cells by targeting the E-cadherin repressors ZEB1 and ZEB2. Genes Dev. 2008;22:894–907. doi: 10.1101/gad.1640608. [DOI] [PMC free article] [PubMed] [Google Scholar]
- 37.Korpal M, Lee ES, Hu G, et al. The miR-200 family inhibits epithelial-mesenchymal transition and cancer cell migration by direct targeting of E-cadherin transcriptional repressors ZEB1 and ZEB2. J Biol Chem. 2008;283:14910–4. doi: 10.1074/jbc.C800074200. [DOI] [PMC free article] [PubMed] [Google Scholar]
- 38.Peter ME. Let-7 and miR-200 microRNAs: guardians against pluripotency and cancer progression. Cell Cycle. 2009;8:843–52. doi: 10.4161/cc.8.6.7907. [DOI] [PMC free article] [PubMed] [Google Scholar]
- 39.Pelengaris S, Khan M, Evan G. c-MYC: more than just a matter of life and death. Nat Rev Cancer. 2002;2:764–76. doi: 10.1038/nrc904. [DOI] [PubMed] [Google Scholar]
- 40.Benaud CM, Dickson RB. Adhesion-regulated G1 cell cycle arrest in epithelial cells requires the downregulation of c-Myc. Oncogene. 2001;20:4554–67. doi: 10.1038/sj.onc.1204609. [DOI] [PubMed] [Google Scholar]
- 41.Sells MA. Pictures in cell biology. PAK1 kinase activity affects the character of cell morphology and movement. Trends Cell Biol. 1999;9:355. doi: 10.1016/s0962-8924(99)01642-6. [DOI] [PubMed] [Google Scholar]
- 42.Carnero A, Blanco-Aparicio C, Renner O, et al. The PTEN/PI3K/AKT signalling pathway in cancer, therapeutic implications. Curr Cancer Drug Targets. 2008;8:187–98. doi: 10.2174/156800908784293659. [DOI] [PubMed] [Google Scholar]
- 43.Calin GA, Sevignani C, Dumitru CD, et al. Human microRNA genes are frequently located at fragile sites and genomic regions involved in cancers. Proc Natl Acad Sci USA. 2004;101:2999–3004. doi: 10.1073/pnas.0307323101. [DOI] [PMC free article] [PubMed] [Google Scholar]
- 44.Visone R, Croce CM. MiRNAs and cancer. Am J Pathol. 2009;174:1131–8. doi: 10.2353/ajpath.2009.080794. [DOI] [PMC free article] [PubMed] [Google Scholar]
- 45.Rosenfeld N, Aharonov R, Meiri E, et al. MicroRNAs accurately identify cancer tissue origin. Nat Biotechnol. 2008;26:462–9. doi: 10.1038/nbt1392. [DOI] [PubMed] [Google Scholar]
- 46.Giannakakis A, Sandaltzopoulos R, Greshock J, et al. miR-210 links hypoxia with cell cycle regulation and is deleted in human epithelial ovarian cancer. Cancer Biol Ther. 2008;7:255–64. doi: 10.4161/cbt.7.2.5297. [DOI] [PMC free article] [PubMed] [Google Scholar]
- 47.Davidson B, Berner A, Nesland JM, et al. E-cadherin and alpha-, beta-, and gamma-catenin protein expression is up-regulated in ovarian carcinoma cells in serous effusions. J Pathol. 2000;192:460–9. doi: 10.1002/1096-9896(2000)9999:9999<::AID-PATH726>3.0.CO;2-M. [DOI] [PubMed] [Google Scholar]
- 48.Elloul S, Silins I, Trope CG, et al. Expression of E-cadherin transcriptional regulators in ovarian carcinoma. Virchows Arch. 2006;449:520–8. doi: 10.1007/s00428-006-0274-6. [DOI] [PubMed] [Google Scholar]
- 49.Davidson B, Shih IM, Wang TL. Different clinical roles for p21-activated kinase-1 in primary and recurrent ovarian carcinoma. Hum Pathol. 2008;39:1630–6. doi: 10.1016/j.humpath.2008.03.009. [DOI] [PubMed] [Google Scholar]
- 50.Elloul S, Vaksman O, Tuft Stavnes H, et al. Mesenchymal-to-Epithelial transition determinants as characteristics of ovarian carcinoma effusions. Clin Exp Metastasis. 2010;27:161–72. doi: 10.1007/s10585-010-9315-2. [DOI] [PubMed] [Google Scholar]
- 51.Plisiecka-Halasa J, Karpińska G, Szymańska T, et al. P21WAF1, P27KIP1, TP53 and C-MYC analysis in 204 ovarian carcinomas treated with platinum-based regimens. Ann Oncol. 2003;14:1078–85. doi: 10.1093/annonc/mdg299. [DOI] [PubMed] [Google Scholar]
- 52.Dimova I, Raitcheva S, Dimitrov R, et al. Correlations between c-myc gene copy-number and clinicopathological parameters of ovarian tumours. Eur J Cancer. 2006;42:674–9. doi: 10.1016/j.ejca.2005.11.022. [DOI] [PubMed] [Google Scholar]
- 53.Iba T, Kigawa J, Kanamori Y, et al. Expression of the c-myc gene as a predictor of chemotherapy response and a prognostic factor in patients with ovarian cancer. Cancer Sci. 2004;95:418–23. doi: 10.1111/j.1349-7006.2004.tb03225.x. [DOI] [PMC free article] [PubMed] [Google Scholar]
- 54.Diebold J, Suchy B, Baretton GB, et al. DNA ploidy and MYC DNA amplification in ovarian carcinomas. Correlation with p53 and bcl-2 expression, proliferative activity and prognosis. Virchows Arch. 1996;429:221–7. doi: 10.1007/BF00198337. [DOI] [PubMed] [Google Scholar]
- 55.Darcy KM, Brady WE, Blancato JK, et al. Prognostic relevance of c-MYC gene amplification and polysomy for chromosome 8 in suboptimally-resected, advanced stage epithelial ovarian cancers: a Gynecologic Oncology Group study. Gynecol Oncol. 2009;114:472–9. doi: 10.1016/j.ygyno.2009.05.012. [DOI] [PMC free article] [PubMed] [Google Scholar]
- 56.Tanner B, Hengstler JG, Luch A, et al. C-myc mRNA expression in epithelial ovarian carcinomas in relation to estrogen receptor status, metastatic spread, survival time, FIGO stage, and histologic grade and type. Int J Gynecol Pathol. 1998;17:66–74. doi: 10.1097/00004347-199801000-00012. [DOI] [PubMed] [Google Scholar]
- 57.Song Y, Wu J, Oyesanya RA, et al. Sp-1 and c-Myc mediate lysophosphatidic acid-induced expression of vascular endothelial growth factor in ovarian cancer cells via a hypoxia-inducible factor-1-independent mechanism. Clin Cancer Res. 2009;15:492–501. doi: 10.1158/1078-0432.CCR-08-1945. [DOI] [PMC free article] [PubMed] [Google Scholar]
- 58.Davidson B, Reich R, Kopolovic J, et al. Interleukin-8 and vascular endothelial growth factor mRNA levels are down-regulated in ovarian carcinoma cells in serous effusions. Clin Exp Metastasis. 2002;19:135–44. doi: 10.1023/a:1014582911680. [DOI] [PubMed] [Google Scholar]
- 59.Davidson B, Hadar R, Schlossberg A, et al. Expression and clinical role of DJ-1, a negative regulator of PTEN, in ovarian carcinoma. Hum Pathol. 2008;39:87–95. doi: 10.1016/j.humpath.2007.05.014. [DOI] [PubMed] [Google Scholar]
- 60.Bunkholt Elstrand M, Dong HP, Ødegaard E, et al. Mammalian target of rapamycin is a biomarker of poor survival in metastatic ovarian carcinoma. Hum Pathol. 2010 doi: 10.1016/j.humpath.2009.09.017. 10:1016/j.humpath.2009.09.017. [DOI] [PubMed] [Google Scholar]
- 61.Campos SM, Ghosh S. A current review of targeted therapeutics for ovarian cancer. J Oncol. 2010;2010:149362. doi: 10.1155/2010/149362. [DOI] [PMC free article] [PubMed] [Google Scholar]