

Abstract
To develop a non-human primate model of systemic bone loss after ovariectomy, 24 ovariectomized (OVX) and eight control (non-OVX) female baboons Papio ursinus were investigated over a period of 48 months using bone mineral density (BMD), iliac crest bone histomorphometry, bone turnover markers, and variables of calcium metabolism. Lumbar spine (L1–L4) BMD measured by dual energy X-ray absorptiometry (DXA) decreased in OVX animals in the first 12 months (−7.6%) and showed a slow trend towards recovery after 24 months. Controls showed a slow increase in spinal BMD over 4 years (+9.7%). Total hip BMD decreased slowly up to 48 months in all animals (OVX −12.6%versus controls −10%); this indicated that OVX had a limited effect on total hip BMD. Forearm BMD did not change. The significant decrease in trabecular bone volume (TBV) of the iliac crest from baseline to 12 months was followed by some recovery. Microarchitectural deterioration of trabecular bone in OVX animals was demonstrated by a decline in trabecular number and an increase in trabecular spacing. These changes were also evident on sections of whole vertebrae, proximal femora and iliac crests. Changes in iliac TBV reflected spinal but not hip BMD changes in the OVX animals. Static and dynamic histomorphometric variables indicated that bone turnover was increased for 36 months following OVX. Controls showed no changes in histomorphometric variables. Bone specific alkaline phosphatase (ALPs) in OVX animals remained elevated throughout the study; osteocalcin (OC) was significantly elevated only at 6 and 12 months, and deoxypyridinoline (Pyr-D) was elevated at 12 months but declined after 24 months. ALPs was thus more sensitive to the long-term effects of OVX than were OC or Pyr-D. Controls showed no changes in bone turnover markers. This study showed consistent deleterious changes in lumbar BMD, bone histomorphometry with microarchitectural deterioration together with altered biochemical markers of bone turnover in the first 12 months after OVX. Since these changes resemble those in post-menopausal women, the non-human primate Papio ursinus is suitable for the study of bone loss in post-menopausal women.
Keywords: systemic bone loss, ovariectomy, densitometry, histomorphometry, primates
Introduction
Ovariectomy has been associated with systemic bone loss in several animal models including non-human and human primates [1–4]. Bone loss following acute oestrogen deficiency in women takes about 5 years to plateau[2]. Non-human primates undergo decreased bone mass and bone strength with increased bone turnover after ovariectomy (OVX) [3, 4], with advancing age [5] and after prolonged immobilization [6]. Bone histomorphometric studies in human and non-human primates show similar characteristics [7–9] since non-human primates also undergo bone remodeling. As in oophorectomized and post-menopausal women, OVX non-human primates lose bone relative to both baseline values and to intact controls [8, 10, 11]. The OVX non-human primate is currently the best characterized OVX large animal model for post-menopausal bone loss [5]. To date, only seven untreated OVX baboons have been followed for up to 24 months [10] and one study reported data on untreated OVX cynomolgus monkeys followed for 28 months [11]. The present study investigated oestrogen deficiency in the non-human primate Papio ursinus over 4 years after OVX to determine the long-term effect of OVX on bone mineral density (BMD), bone histology, histomorphometry and biochemical variables.
Materials and methods
Animals
Thirty-two adult female Chacma baboons (Papio ursinus) (24 OVX and eight non-OVX controls) were studied. Females had been selected by body weight from a group of feral baboons that had fulfilled the following inclusion criteria: all animals were healthy in that bone, kidney, liver, cardiovascular, blood, muscle, pancreatic, intestinal and neural functions were within the normal range, as evaluated by clinical, biochemical and haematological analyses [12]. All animals were skeletally mature as shown by closure of the distal growth plates of the radius and ulna [7, 13] and evidence of wear of the occlusal surfaces of the third molarss [14]. All animals were held in the Central Animal Services of the University for at least 6 months prior to experimentation and had normal regular menstrual cycles as shown by regular perineal sex skin swelling. After standard quarantine procedures, the animals were housed individually in suspended wire-mesh cages in the non-human primate unit of the Central Animal Services of the University [7, 13]. The rooms in which the animals were caged were kept under slightly negative pressure (−25 kPa) with controlled ventilation (18 filtered air changes per hour), temperature (22.2°C), humidity (40 ± 10%), and photo period (light on from 6 a.m. to 6 p.m.) [13]. The diet of the baboons consisted of commercially available baboon cubes containing 20% protein, 0.85% phosphorus (calcium/ phosphorus ratio 1.1–1.5:1) and vitamin D 80 μg/100 g. In addition, all animals were fed a balanced protein/fat/carbohydrate diet with vitamin and mineral supplements containing 30% protein, 0.7% calcium, 1% phosphorus, vitamin D 60 μg/100 g, sweet potatoes, pumpkins and fruits with tap water ad libitum [15]. The estimated vitamin D intake per day was between 90 and 120 μg [15]. Research protocols were approved by the Animal Ethics Screening Committee of the University (Clearance Certificate 94/01/5) and the study was conducted according to the Guidelines for Care and Use of Experimental Animalsprepared by the University, and in compliance with the National Code for Animal Use in Research, Education and Diagnosis in South Africa[16].
Ovariectomy procedure
Twenty-four baboons were matched by body weight with eight controls, and ovariectomized. Eight adult animals were used as non-OVX controls. The animals were immobilized by intramuscular ketamine hydrochloride (8 mg/kg i.m.) and an intravenous (i.v.) catheter was inserted into the radial or saphenous vein. After atropine sulphate (0.02 mg/kg i.v.), general anaesthesia was induced with thiopentone sodium (6 mg/kg) and maintained by halothane in oxygen following endotracheal intubation [13]. Under sterile conditions, uterus and ovaries were excised and the abdomen closed in layers with atraumatic resorbable sutures.
Bone densitometry
Dual energy X-ray absorptiometry (DXA) was used to evaluate the BMD of the lumbar spine (L1–L4), total hip and radius at one-third length from the distal end at 0, 6, 12, 18, 24, 36 and 48 months [17]. All bone scans were performed with the animal supine. The lumbar spine was scanned from below the intervertebral disc space of L4-5 to above the intervertebral disc space of L1-T12. The left hip was scanned from a level of approximately 10 cm above the pubic symphysis to approximately 10 cm below the greater trochanter. The left radius was scanned in the prone position. The bone densitometer used was a Hologic QDR-1000 DXA supine scanner (Waltham, MA, USA) [17]. Daily DXA calibration of phantoms showed a coefficient of variation of 0.42% for BMD with a projected long-term variation of 0.52% with a 0.02% change per year [17]. For BMD measurements, animals were immobilized as described for OVX and general anaesthesia was induced and maintained by thiopentone sodium (10 mg/kg i.v.).
Transiliac bone biopsy
Prior to biopsy all animals were doubly tetracycline labeled using tetracycline hydrochloride 20 mg/kg body weight by i.m. injection, given daily for 2 days, and after a 10 day drug-free interval again for 3 days [7, 13]. The bone samples were obtained within 3–7 days after the last dose of tetracycline. Following induction of anaesthesia as described above, the animals were positioned in lateral recumbency. Through a 5–6 cm incision along the iliac crest both muscles and periosteum were dissected and a triangular piece of bone consisting of both cortices and intervening cancellous bone were removed from the anterior end of the iliac crest just behind the anterior superior iliac spine. The inferior extent of the specimen corresponded to the standard biopsy site in man. To obtain annual biopsies left and right sides were alternated. The repeat biopsy on any one side was taken just posterior to the previous biopsy site. Bone specimens were dehydrated in ascending grades of ethanol and embedded undecalcified in polymethylmethacrylate resin (K-Plast; Medim, Busek, Germany). Non-consecutive serial section pairs were cut at 6 μm on a Polycut-S microtome (Reichert, Heidelberg, Germany). One section of each pair was stained free-floating with Goldner's trichrome and the other was mounted unstained.
Sections of undecalcified specimens of whole lumbar vertebral bodies, head and neck of femora, and iliac crests harvested at euthanasia were stained with Goldner's trichrome and mounted.
Histomorphometric analysis
Measurements were confined to trabecular bone. Sections were examined by the point-counting and intersect-counting method using a Zeiss Integrations Platte II at a magnification of x100. Trabecular thickness, osteoid thickness, wall thickness and interlabel distance were measured at a magnification of 400x using a calibrated eyepiece micrometer. Stained sections were examined for structural and static bone-turnover variables [18]. Unstained sections were examined for kinetic (tetracycline-based) variables under ultraviolet light, and for wall thickness under polarized light [18]. Measured histomorphometric variables were trabecular bone volume (TBV) in tissue volume BV/TV (%), trabecular thickness Tb.Th (μm), wall thickness W.Th (μm), osteoid volume in bone volume OV/BV (%), osteoid thickness O.Th (μm), osteoid-coverd bone surface OS/BS (%), eroded bone surface ES/BS (%), mineral apposition rate MAR (μm/day), single labeled surface sLS/BS (%) and double labeled surface dLS/BS (%). Derived variables were calculated as follows:
trabecular number Tb.N (N per mm of a straight line) = 10 (BV/TV)/Tb.Th;
trabecular separation Tb.Sp (μm) = (1000/Tb.N) – Tb.Th;
mineralizing surface MS/BS (%) = dLS/BS +½ sLS/BS;
bone formation rate BFR/BS (μm3/μm2/day) = MAR (MS/BS);
adjusted apposition rate Aj.AR (μm/day) = (BFR/BS)/(OS/BS);
mineralizarion lag time Mlt (d) = O.Th/Aj.AR;
osteoid maturation time (d) = O.Th/MAR;
formation period FP (d) = W.Th/Aj.AR;
total period Tt.P (d) = FP (BS/OS);
activation frequency Ac.f (N/year) = 1/Tt.P;
remodeling period Rm.P (d) = FP (ES/BS + OS/BS)/(OS/BS).
Four section pairs were analysed in each biopsy.
Hematology and serum and urine biochemistry
At 0, 6, 12, 18, 24, 36 and 48 months venous blood and urine samples were collected under Ketamine anaesthesia. Urine was obtained by urethral catheterization 12 hr after the last feed. At this time animals were also weighed. The haematological profile consisted of a full blood and platelet count. Serum sodium (mM/L), potassium (mM/L), chloride (mM/L), urea (mM/L), creatinine (μM/L), glucose (mM/L), calcium (mM/L), inorganic phosphate (mM/L), total proein (g/L), albumin (g/L), cholesterol (mM/L), total bilirubin (mM/L), alkaline phosphatase (U/L), alanine transferase (U/L), aspartate transferase (U/L), lactate dehydrogenase (U/L), gamma glutamyl transaminase (U/L) and estradiol E2 (pg/mL) were analysed with Boehringer Mannheim/Hitachi ES700 and 747 Analysers. Urinary sodium (mM/L), potassium (mM/L), calcium (mM/L), phosphate (mM/L), magnesium (mM/L) and creatinine (mM/L), were analysed on a Boehringer Mannheim/Hitachi 717 Analyser. Osteocalcin (pg/mL) was analysed by a competitive immunoassay (Metra Biosystem, Inc, Mountain View, CA, USA) using monoclonal anti-osteocalcin antibodies raised against bovine osteocalcin. Intra- and inter-assay coefficients of variation (CV) of the method were <10% and <9.8%, respectively; the sensitivity of the method 0.45 ng/mL. Bone specific alkaline phosphatase ALPs (U/L) was analysed using a monoclonal antibody coated onto a microtiter plate to capture ALPs in the sample (Metra Biosystem, Inc, Mountain View, CA, USA). Intra- and inter-assay CV were <3.5% and <7.9%, respectively; the sensitivity of the assay was 0.7 U/L. Intact parathyroid hormone (PTH) (pg/mL) was analysed by RIA (Incstar Corporation, Stillwater, MN, USA). The intra- and inter-assay CVs were <3.6% and <4.9%, respectively; the sensitivity of the assay was 0.7 pg/mL. 1,25-dihydroxyvitamin D (1,25(OH)2D) (ng/L) was analysed by RIA (Nichols Institute, San Juan Capistrano, CA, USA). Intra- and inter-assay CVs were <8% and <16.8%, respectively; the sensitivity of the test was 2.1 ng/L. Calcitonin (pg/mL) was analysed by RIA (Nichols Institute, San Juan Capistrano, CA, USA). Intra- and inter-assay CVs were <8.3% and <11.6%, respectively; the sensitivity of the assay was pg/mL. Total urinary deoxypyridinoline (Dpd) (mM/L) was analysed by competitive enzyme immunoassay in microtiter format utilizing a monoclonal anti-Dpd antibody coated onto the plate to capture Dpd (Metra Biosystem). Intra- and inter-assay CVs were <9.55 and <10.3%, respectively; the sensitivity of the assay was 1.1 nM/L. Dpd results were corrected for urinary concentration of creatinine.
Statistical analysis
To compare measurements obtained at of 6, 12, 24, 36 and 48 after ovariectomy with baseline data at 0 months, values were tested with a paired sample t-test with Bonferroni correction for multiple comparisons [19]. An unpaired sample t-test with Bonferroni correction for multiple comparisons was used to test OVX versus non-OVX baboons [19]. All data shown in Tables are mean ± standard deviation (S.D.); in graphs are mean ± standard errors (S.E.M.). The significant probability value for each class variable was accepted as significant at p < 0.05.
Results
At baseline, OVX animals did not differ from non-OVX animals apart from higher values of iliac crest trabecular bone volume and trabecular number (Tables 1 and 2). Although both OVX and non-OVX baboons gained weight, a significant difference from baseline was only noted in the OVX group at 36 and 48 months post-OVX, i.e. 22.6 and 25.7 kg, respectively versus 18.4 kg on day 0. One OVX baboon had to be euthanazed after 24 months because a chronic staphylococcal infection of the nasal cavities did not respond to appropriate antibiotic therapy. The remainder of the animals remained in good health throughout the study as was confirmed by normal haematological and biochemical profiles [12].
1.
Structural, static and dynamic iliac crest histomorphometric data for ovariectomized baboons during 36 months of observation
| Variable | Time (months) | ||||||||||||
|---|---|---|---|---|---|---|---|---|---|---|---|---|---|
| 0 (N = 24) | 12 (N = 24) | 24 (N = 8) | 36 (N = 10) | ||||||||||
| Structural | |||||||||||||
| BV/TV (%) | 16.9 ± 4.6 | 11.5 ± 3.3*** | 15.5 ± 4.6 | 13.2 ± 4.2 | |||||||||
| Tb.Th (μm) | 101.7 ± 17.3 | 105.6 ± 15.3 | 116.9 ± 17.3 | 111.8 ± 17.9 | |||||||||
| Tb.N (N/mm) | 1.62 ± 0.37 | 1.08 ± 0.28*** | 1.36 ± 0.43 | 1.22 ± 0.35 | |||||||||
| Tb.Sp (μm) | 548.4 ± 159 | 888 ± 325*** | 693.5 ± 279 | 806 ± 270* | |||||||||
| W.Th (μm) | 24.2 ± 3.9 | 34.9 ± 6.5*** | 32.9 ± 7.7 | 28 ± 2.9** | |||||||||
| Static bone turnover | |||||||||||||
| OV/BV (%) | 0.1 ± 0.16 | 1.02 ± 0.8*** | 0.4 ± 0.35** | 0.34 ± 0.28** | |||||||||
| OS/BS (%) | 11.1 ± 19.9 | 32.9 ± 22.1** | 24.3 ± 12** | 27.3 ± 21.9 | |||||||||
| O.Th (μm) | 10.4 ± 2.7 | 14.6 ± 2.8*** | 13.7 ± 3.9** | 13.2 ± 3.8* | |||||||||
| ES/BS (%) | 1.78 ± 2 | 5.48 ± 2.5*** | 3.1 ± 2.3 | 4.11 ± 3.38* | |||||||||
| Dynamic | |||||||||||||
| MAR (μm/day) | 0.82 ± 0.12 | 1.14 ± 0.18*** | 1.05 ± 0.2** | 1.02 ± 0.26 | |||||||||
| dLS/BS (%) | 6.1 ± 6.8 | 17.7 ± 9.1*** | 13.9 ± 7** | 7.7 ± 5.9 | |||||||||
| sLS/BS (%) | 5.7 ± 3.1 | 6.6 ± 3.2 | 6 ± 5.1 | 6.4 ± 4.6 | |||||||||
| MS/BS (%) | 8.8 ± 7 | 20 ± 9*** | 17 ± 7** | 12 ± 6 | |||||||||
| Aj.AR (μm/day) | 1.5 ± 1.1 | 0.9 ± 0.49* | 0.75 ± 0.21* | 0.51 ± 0.24* | |||||||||
| BFR/BS (mm3/mm3/day) | 10.3 ± 8.9 | 27.8 ± 13.5*** | 21.4 ± 10.8** | 15.5 ± 10.8 | |||||||||
| Mlt d | 13.2 ± 10.5 | 22.3 ± 19.1* | 16.7 ± 6.1 | 32.6 ± 21.9* | |||||||||
| Omt d | 12.7 ± 2.7 | 12.8 ± 3.5 | 13.2 ± 3.6 | 13.4 ± 4.1 | |||||||||
| FP d | 29.2 ± 24.6 | 54.7 ± 43.1* | 47.8 ± 23.7** | 66 ± 29.8*** | |||||||||
| Ac.f/year | 3.4 ± 3.6 | 5.6 ± 3.8 | 5.4 ± 3.9 | 6.4 ± 6.5 | |||||||||
| Rm.P d | 44.5 ± 50.6 | 63.5 ± 43.6 | 54.3 ± 24.3 | 79.3 ± 32.2 * | |||||||||
| Tt.P d | 252 ± 202 | 90 ± 77*** | 123 ± 108 | 132 ± 105 | |||||||||
Data are means ± S.D. *p < 0.05, **p < 0.01, ***p < 0.001 versus baseline time 0.BV/TV, bone volume in tissue volume; Tb.Th, trabecular thickness; Tb.N, trabecular number; Tb.Sp, trabecular separation; W.Th, wall thickness; OV/BV, osteoid volume in bone volume; OS/BS, osteoid covered bone surface; O.Th, osteoid thickness; ES/BS, eroded bone surface; MAR, mineral apposition rate; dLS/BS, double labeled bone surface; sLS/BS, single labeled bone surface; MS/BS, mineralizing bone surface; Aj.AR, adjusted apposition rate; BFR/BS, bone formation rate; Mlt, mineralization lag time; Omt, osteoid maturation time; FP, formation period; Ac.f, activation frequency; Rm.P, remodeling period and Tt.P, total period.
2.
Structural, static and dynamic iliac crest histomorphometric data for non-ovariectomized baboons during 36 months of observation
| Variable | Time (months) | |||||||
|---|---|---|---|---|---|---|---|---|
| 0 (N = 8) | 12 (N = 8) | 36 (N = 8)γ | ||||||
| Structural | ||||||||
| BV/TV (%)a | 12 ± 3.8 * | 12.2 ± 3.7 | 13 ± 4.6 | |||||
| Tb.Th (μm) | 97 ± 19.7 | 90.13 ± 12* | 88.5 ± 14* | |||||
| Tb.N (N/mm) | 1.28 ± 0.42* | 1.36 ± 0.28* | 1.53 ± 0.53 | |||||
| Tb.Sp (μm) | 682 ± 169 | 672 ± 122 | 623 ± 154 | |||||
| W.Th (μm) | 21.9 ± 3.4 | 22 ± 25*** | 22 ± 1.9** | |||||
| Static bone turnover | ||||||||
| OV/BV (%) | 0.11 ± 0.2 | 0.09 ± 0.15*** | 0.058 ± 0.06*** | |||||
| OS/BS (%) | 4.2 ± 6.3 | 5.5 ± 4** | 4.5 ± 3.8** | |||||
| O.Th (μm) | 8.3 ± 5.3 | 8.93 ± 3.5*** | 7.5 ± 3.2** | |||||
| ES/BS (%) | 1.14 ± 0.74 | 2.23 ± 1.3** | 2.17 ± 1.3 | |||||
| Dynamic | ||||||||
| MAR (μm/day) | 0.78 ± 0.18 | 0.76 ± 0.16*** | 0.64 ± 0.29* | |||||
| dLS/BS (%) | 3.9 ± 2.3 | 2.9 ± 1.3*** | 2.4 ± 2.3 | |||||
| sLS/BS (%) | 3.9 ± 2.6 | 3.4 ± 1.8* | 3.1 ± 2.5 | |||||
| MS/BS (%) | 5.7 ± 2.8 | 5.2 ± 2.4*** | 3.8 ± 3.4** | |||||
| Aj.AR (μm/day) | 1.9 ± 2.7 | 0.96 ± 0.77 | 1.01 ± 1.6 | |||||
| BFR/BS (mm3/mm3/day) | 6 ± 0.3 | 5.8 ± 3*** | 4.5 ± 3* | |||||
| Mlt d | 11.7 ± 9.2 | 12.5 ± 11 | 15.4 ± 17.4 | |||||
| Omt d | 11.4 ± 6.2 | 11.5 ± 7 | 12.1 ± 8.4 | |||||
| FP d | 31.4 ± 19.1 | 27 ± 17.2 | 60 ± 40.8 | |||||
| Ac.f/year | 1.4 ± 1.4 | 1.8 ± 1.9 | 2.1 ± 3.2 | |||||
| Rm.P d | 51.1 ± 40.2 | 46.4 ± 26.2 | 79.5 ± 71.6 | |||||
| Tt.P d | 348 ± 314 | 333 ± 210*** | 297 ± 146 | |||||
Densitometry
Lumbar spine BMD was measured in vertebrae L1–L4 and analysed as total BMD (L1–L4) (Fig. 1). Post-OVX total lumbar BMD declined rapidly in the first 6 months, remained low between 6 and 24 months, and showed a slow trend towards recovery at 36 and 48 months (Fig. 1). The greatest decline from baseline was −7.6% at 12 months. Values post-OVX were always lower than in controls. Non-OVX animals showed a slow but steady increase in total lumbar BMD throughout the study. The overall gain in lumbar BMD in controls during the 4-year period was 9.7%, and the difference between non-OVX and OVX animals was 10.8% after 4 years (p < 0.01, Fig. 1).
1.
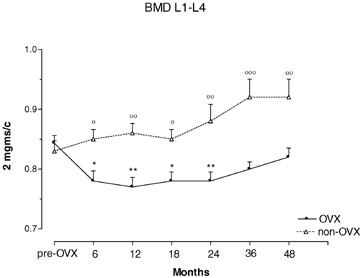
Total lumbar spine (L1–L4) bone mineral density (BMD) in ovariectomized (OVX) and non-ovariectomized control (non-OVX) baboons during 48 months of observation. *p < 0.05, **p < 0.01, versus baseline time 0. °p < 0.05, °°p < 0.01, °°°p < 0.001 versus OVX animals. Values are means ± S.E.M.
Hip BMD in OVX animals had declined non-significantly by 6 months but showed a significant reduction from baseline values at 48 months (Fig. 2). Non-OVX animals had higher though not significant baseline hip BMD measurements compared to OVX animals; control non-OVX animals also lost bone from 18 months onwards (Fig. 2). The rate of bone loss per year was 3.1 and 2.7% in OVX versus non-OVX animals, respectively (OVX versus controls, NS). The overall decline in hip BMD over 4 years was 12.6% in the OVX group and 10.9% in controls (OVX versus controls, NS).
2.
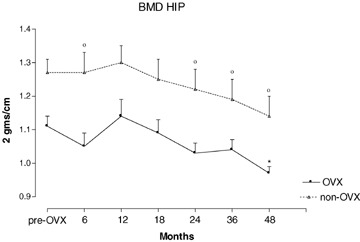
Values for total hip bone mineral density (BMD) during 48 months of observation in ovariectomized (OVX) and non-ovariectomized (non-OVX) baboons. *p < 0.05 versus baseline time 0; °p < 0.05 versus OVX animals. Values are mean ± S.E.M.
Forearm BMD showed no significant change within either group, nor did the groups differ (not shown).
Histomorphometry
Transiliac bone biopsy data obtained at 0, 12, 24 and 36 months in the OVX group and at 0, 12 and 36 months (no 24 months data) in non-OVX controls are presented in Tables 1 and 2. With the exception of higher values for BV/TV and Tb.N in OVX animals, baseline histomorphometric data did not differ between OVX and non-OVX animals. Whereas histomorphometric analyses of bone biopsies of OVX animals showed evidence of bone loss and increase in bone turnover during the course of the study, those of non-OVX controls animals showed no significant changes in any variable (Tables 1 and 2). In OVX animals, the structural variables BV/TV, Tb.N and Tb. Sp showed the most marked deterioration in the first 12 months after OVX. There were three distinct changes in trabecular BV/TV over the 36 months period, namely a significant bone loss of 31.9% 12 months after OVX, a significant bone gain of 34.8% between 12 and 24 months, and a non-significant bone loss of 14.8% between 24 and 36 months post-OVX (Table 1). The overall trabecular bone loss attributable to ovariectomy after 36 months of observation was 21.8%. Surprisingly, Tb.Th and W.Th in OVX baboons showed a rise relative to baseline and controls in the course of the study (Tables 1 and 2). In OVX animals, values of the static bone turnover variables OV/BV, OS/BS, O.Th and ES/BS rose significantly and remained elevated relative to baseline and controls (Tables 1 and 2) with the largest change at 12 months. In OVX animals, the measured dynamic bone turnover variables MAR and dLS/BS rose maximally in the first 12 months relative to baseline and controls. Values remained elevated, except for a return of dLS/BS to baseline levels at 36 months; single labels remained unaffected (Tables 1 and 2). Since MAR and dLS/BS appear in the formulae of derived dynamic variables, changes in measured dynamic variables necessarily affected derived variables. BFR/BS rose, again maximally by 12 months, relative to baseline and controls, but Aj.AR steadily declined in the course of the study because the increase in OS/BS was greater than that of MS/BS and MAR. This suggests that a portion of the osteoid was ‘inactive’ which reflects inefficiency of teams of osteoblasts, likely as a result of OVX. The absence of any marked increases in Mlt and O.Th rules out osteomalacia. The FP in OVX animals was elevated throughout the study relative to baseline. The Rm.P rose to a lesser extent. The Tt.P remained reduced throughout the study relative to baseline and controls. Although OVX animals showed increased Ac.f during the entire study, this reached statistical significance compared to baseline and controls only at 12 months. This suggests that in OVX animals, maximal increase in bone turnover occurred at 12 months.
Sections of whole specimen mounts of vertebral bodies show fewer and thinner trabecular elements in the OVX than in the control group (Fig. 3). This is particularly noticeable adjacent to the superior and inferior endplates. Trabecular bone is also sparse in the femoral neck and the iliac crest of the OVX animal (Fig. 3). These appearances are in keeping with the recorded decline in spinal bone density and the iliac crest histomorphometric data in OVX animals.
3.
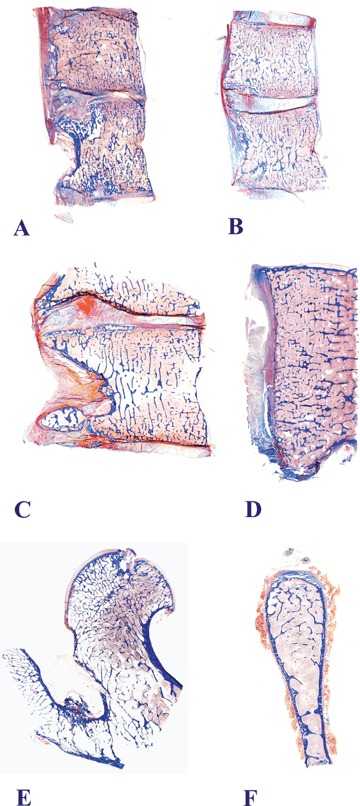
Macro-photography of sections of whole specimens of lumbar vertebrae, a proximal femur and an iliac crest prepared at euthanasia ending the long-term experiment of systemic bone loss in the non-human primate Papio ursinus. Lumbar vertebrae of non-OVX control animal (A). Vertebrae of OVX animals (B–D) show fewer and thinner trabecular elements than those of a control animal (A). This is particularly noticeable under the superior and inferior endplates. Trabecular bone is also sparse in the femoral neck (E) and the iliac crest (F) of OVX animals. Undecalcified whole mount sections cut at 5 μm stained free-floating with Goldner's trichrome (A and B, original magnification 1.2×; C, original magnification 1.6×; D, original magnification 3×; E, original magnification 1.8×; F, original magnification 2.6×).
Serum and urine biochemistry
Baseline values of the biochemical variables tested did not differ between OVX and non-OVX control animals (Tables 3 and 4). As a result of OVX, serum estradiol (E2) levels dropped significantly during the first 6 months but remained detectable at all time points without significant differences (Table 3). Non-OVX animals had four to six times higher E2 levels than OVX animals throughout the study (Table 3). OVX and non-OVX animals showed raised values 1,25(OH2)vitamin D and serum calcium across the time periods (Table 3). Bone specific alkaline phosphatase (ALPs) was significantly elevated in OVX animals at all time intervals compared to both baseline and controls, and no trends towards recovery were noted (Table 4, Fig. 4). Non-OVX baboons showed no significant changes in ALPs at any time. Serum osteocalcin (OC) levels were elevated in OVX animals only at 6 and 12 months, compared to baseline and controls (Table 4, Fig. 5). In OVX baboons, serum calcium levels were significantly higher relative baseline and controls at 6, 12, 18, 24 and 48 months but not at 36 months post-ovariectomy (Table 3). In non-OVX baboons, serum calcium levels rose by 36 and 48 months post-ovariectomy (Table 3). Serum phosphorus levels rose in OVX baboons between 6 and 24 months post-ovariectomy (Table 3). Serum parathyroid hormone (PTH) levels in OVX baboons were elevated relative to baseline only at 48 months (Table 3). Serum calcitonin levels did not change significantly in either group and across the time periods (Table 3). A significant increase in 1,25(OH2)vitamin D was found in OVX animals throughout the study, and in control animals between 18 and 36 months (Table 3). Deoxypyrodinoline excretion in OVX animals showed a marked increase at 12 months but returned gradually to pre-OVX levels 4 years after OVX (Table 4) (Fig. 6); control animals showed no significant change in deoxypyrodinoline excretion. Values for urinary calcium and phosphorus excretion did not change in either group and are shown in Table 4.
3.
Serum values in OVX and non-OVX baboons measured over 48 months
| Time (months) | OVX (N = 24) | Non-OVX (N = 8) | p value (OVX versus non-OVX) animals |
|---|---|---|---|
| Estradiol (pg/mL) | |||
| 0 | 160 ± 87*** | 172 ± 86 | NS |
| 6 | 33 ± 20*** | 190 ± 88 | <0.001 |
| 12 | 34 ± 17*** | 222 ± 218 | <0.001 |
| 18 | 32 ± 13*** | 187 ± 120 | <0.001 |
| 24 | 29 ± 21*** | 127 ± 139 | <0.001 |
| 36 | 26 ± 5*** | 138 ± 89 | <0.001 |
| 48 | 28 ± 6*** | 138 ± 88 | <0.001 |
| PTH (pg/mL) | |||
| 0 | 35.6 ± 19 | 39.8 ± 18.1 | NS |
| 6 | 42.4 ± 28.4 | 59.9 ± 46.1 | NS |
| 12 | 33.4 ± 22 | 51 ± 14.8 | NS |
| 18 | 45.9 ± 26 | 73 ± 26.4 | NS |
| 24 | 47.6 ± 24.7 | 72.9 ± 37 | NS |
| 36 | 51.4 ± 44.1 | 69 ± 22.9 | NS |
| 48 | 82 ± 50γ | 67 ± 33.7 | NS |
| Calcitonin (pg/mL) | |||
| 0 | 10 ± 3.9 | 11.6 ± 4.1 | NS |
| 6 | 10 ± 5.6 | 11.4 ± 4.3 | NS |
| 12 | 10.9 ± 6.1 | 11.2 ± 3.8 | NS |
| 18 | 12.1 ± 6.1 | 11.7 ± 4.3 | NS |
| 24 | 13.5 ± 9.3 | 10.5 ± 5.6 | NS |
| 36 | 10.7 ± 7.2 | 11.8 ± 7.3 | NS |
| 1,25 (OH)2D (ng/L) | |||
| 0 | 25.2 ± 1.7 | 27.5 ± 5.1 | NS |
| 6 | 38.5 ± 20.8*** | 29 ± 5.2 | NS |
| 12 | 62.3 ± 31.4*** | 65 ± 28 | NS |
| 18 | 81.2 ± 46.6*** | 88.3 ± 33 | NS |
| 24 | 102.8 ± 38.7*** | 95.6 ± 52 | NS |
| 36 | 71.5 ± 32.6*** | 94.9 ± 38.7 | NS |
| 48 | 69.3 ± 26.2*** | 61.9 ± 17.19 | NS |
| Ca (mM/L) | |||
| 0 | 2.14 ± 0.15 | 2.13 ± 0.11 | NS |
| 6 | 2.39 ± 0.11*** | 2.16 ± 0.08 | <0.001 |
| 12 | 2.35 ± 0.13*** | 2.16 ± 0.08 | <0.01 |
| 18 | 2.40 ± 0.09*** | 2.18 ± 0.11 | <0.001 |
| 24 | 2.30 ± 0.14*** | 2.17 ± 0.10 | <0.05 |
| 36 | 2.26 ± 0.15 | 2.34 ± 0.14 | NS |
| 48 | 2.44 ± 0.11*** | 2.35 ± 0.15 | NS |
| Pi (mM/L) | |||
| 0 | 0.98 ± 0.3 | 1.26 ± 0.43 | NS |
| 6 | 1.45 ± 0.35*** | 1.14 ± 0.18 | <0.05 |
| 12 | 1.49 ± 0.35*** | 1.33 ± 0.25 | NS |
| 18 | 1.38 ± 0.36** | 1.34 ± 0.23 | NS |
| 24 | 1.27 ± 0.34*** | 1.28 ± 0.22 | NS |
| 36 | 1.09 ± 0.43 | 1.28 ± 0.15 | NS |
| 48 | 1.32 ± 0.3* | 1.32 ± 0.32 | NS |
4.
Biochemical markers of bone turnover, and urinary calcium and phosphate excretion in ovariectomized and non ovariectomized baboons measured over 48 months
| Time (months) | OVX (N = 24) | Non-OVX (N = 8) | p value (OVX versus non-OVX) |
|---|---|---|---|
| Bone specific alkaline phospahatase (U/L) | |||
| 0 | 40.4 ± 27.2 | 25.8 ± 8 | NS |
| 6 | 99.9 ± 41.8*** | 36 ± 18 | <0.001 |
| 12 | 102.3 ± 24.9*** | 31 ± 6 | <0.001 |
| 18 | 87 ± 27*** | 23 ± 3.7 | <0.001 |
| 24 | 84 ± 25*** | 22 ± 3.6 | <0.001 |
| 36 | 82 ± 21.3** | 21.3 ± 9.3 | <0.001 |
| 48 | 115.7 ± 31* | 37 ± 15 | <0.001 |
| Osteocalcin (ng/mL) | |||
| 0 | 6.1 ± 3.7 | 3.8 ± 1.9 | NS |
| 6 | 11.1 ± 3.5*** | 2.8 ± 0.7 | <0.001 |
| 12 | 10.3 ± 4.2** | 3.4 ± 1 | <0.001 |
| 18 | 6.1 ± 2 | 3.2 ± 1 | NS |
| 24 | 6.7 ± 1.6 | 3.7 ± 1 | NS |
| 36 | 6.1 ± 1.3 | 3.1 ± 1.1 | NS |
| 48 | 6.1 ± 2.3 | 2.6 ± 0.8 | NS |
| uDeoxypyridinoline/Creatinine (nM/mM) | |||
| 0 | 7.9 ± 2.6 | 6.6 ± 2.3 | NS |
| 6 | 5.9 ± 5.9 | 6.5 ± 2.1 | NS |
| 12 | 21.9 ± 21.5* | 6.7 ± 1.2 | NS |
| 18 | 16.4 ± 21.5 | 8.1 ± 1.3 | NS |
| 24 | 13.1 ± 17.8 | 6.5 ± 2.8 | NS |
| 36 | 10.4 ± 10.1 | 9.5 ± 3.7 | NS |
| 48 | 6.8 ± 2.5 | 13 ± 11 | NS |
| uCalcium/Creatinine (mM/mM) | |||
| 0 | 0.48 ± 0.29 | 0.47 ± 0.33 | NS |
| 6 | 0.49 ± 0.34 | 0.45 ± 0.3 | NS |
| 12 | 0.51 ± 0.4 | 0.41 ± 0.36 | NS |
| 18 | 0.3 ± 0.1 | 0.37 ± 0.18 | NS |
| 24 | 0.45 ± 0.39 | 05 ± 0.37 | NS |
| 36 | 0.31 ± 0.3 | 0.49 ± 0.32 | NS |
| 48 | 0.59 ± 0.76 | 0.52 ± 0.34 | NS |
| uPhosphate/Creatinine (mM/mM) | |||
| 0 | 0.38 ± 0.77 | 0.22 ± 0.4 | NS |
| 6 | 0.34 ± 0.82 | 0.29 ± 0.5 | NS |
| 12 | 0.18 ± 0.27 | 0.39 ± 0.4 | NS |
| 18 | 0.14 ± 0.12 | 0.24 ± 0.2 | NS |
| 24 | 0.23 ± 0.46 | 0.24 ± 0.2 | NS |
| 36 | 0.21 ± 0.41 | 0.37 ± 0.43 | NS |
| 48 | 0.22 ± 0.26 | 0.37 ± 0.36 | NS |
4.
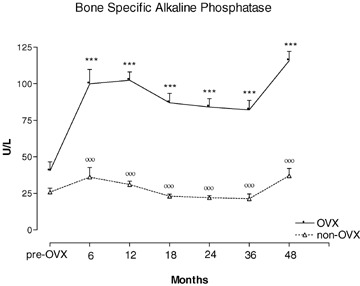
Serum bone specific alkaline phosphatase (ALPs) concentration measured during 48 months of observation in OVX and non-OVX baboons. ***p < 0.001, versus time 0. °°°p < 0.001 versus OVX. Values are given as mean ± S.E.M.
5.
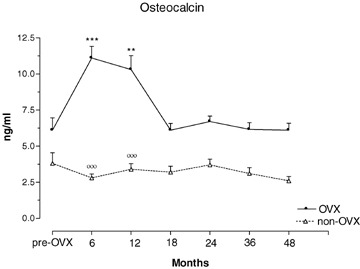
Serum osteocalcin concentrations in OVX and non-OVX baboons during 48 months of observation. **p < 0.01, ***p < 0.001, versus time 0. °°°p < 0.001 versus OVX. Values are given as mean ± S.E.M.
6.
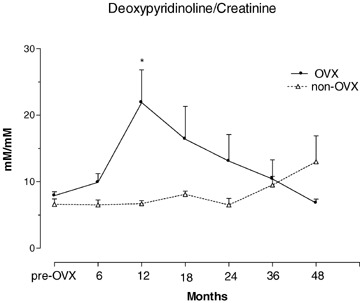
Urinary excretion of deoxypiridinoline in OVX and non-OVX baboons during 48 months observation. *p < 0.01, versustime 0. Values are given as mean ± S.E.M.
Discussion
This long-term study on OVX non-human primates Papio ursinus showed bone loss in the lumbar spine and in iliac crest trabecular bone with evidence of increased bone turnover. Non-OVX animals, on the other hand, showed no such changes, but rather gained bone in the lumbar spine. Bone loss in the hip occurred in both groups indicating that OVX had little additional effect on total hip BMD. In OVX animals, the greatest concordance of loss in lumbar BMD, decline in iliac crest trabecular bone volume, increase in static and dynamic histomorphometric bone turnover variables and increase in biochemical markers of bone turnover were seen at 12 months. Changes in the first 12 months were comparable to those in post-menopausal women; thereafter changes varied. This primate model is therefore most relevant to human post-menopausal bone loss up to 12 months post-OVX.
All animals gained weight as did feral primates provided with diets and housing conditions similar to domestically reared animals previously described [11, 13]. Weight gain in OVX baboons might have been increased by the low oestrogen levels which had declined abruptly after OVX (Table 3).
At what age baboons reach peak bone mass is not known. The presence of epiphyseal closure was not found to coincide with peak bone mass in Rhesus monkeys and human beings. [20, 21]. The trend towards an increase in lumbar BMD in all our animals the second half of the study may mean that peak bone mass had not yet been attained at entry into the study. In the experimental animals, OVX-induced bone loss may have partly obscured any rise to peak bone mass.
Accelerated bone loss after surgical or medical oophorectomy has been well documented in other non-human primate studies [8, 22] and in women following artificial menopause [2, 23]. Lumbar vertebral BMD in untreated OVX women was reported to decrease by 8% in the first year after OVX [2] (similar to the reported reduction of −7.6% of the present study), and by 12% at 2 years [24]. This reduction in BMD occurred earlier in the axial than in the peripheral skeleton, and in trabecular than in cortical bone [24], presumably because of the larger surface to volume ratio in trabecular bone. Similar to our data, other investigators [4, 10] also found recovery after early spinal bone loss in untreated OVX baboons, and spinal BMD gain in non-OVX baboons.
Whereas lumbar bone loss in our OVX animals ceased by 12 months, that of the hip showed a more protracted decline, and the forearm none at all. The site-specific differences in magnitude and rate of bone loss may be related to the ratio of trabecular to cortical bone of the site, with the spine having the highest, the hip an intermediate, and the forearm the lowest ratio. Moreover, bone turnover in axial trabecular bone may be higher than in peripheral trabecular bone, as was described in human beings [25]. Trabecular bone with its larger surface to volume ratio than cortical bone responds more rapidly to stimuli initiating increased bone turnover such as oestrogen deprivation. Bone turnover operates through the remodeling cycle as surface-bound phenomenon [1]. An increase in bone turnover is associated with bone loss because of the creation of additional resorption lacunae. This phase was reflected in the increased eroded surface in the biopsies and the rapid decline in spinal BMD in the first 6 months after OVX. The sum of the numerous resorption cavities constitutes the remodeling space, i.e. bone that is missing [26]. As resorption switches to formation, the remodeling space diminishes somewhat but the continued elevation of activation frequency as a result of oestrogen deficiency maintains an increased remodeling space. A new steady stateat a lower BMD has thus been reached as is reflected in the flat section of the spinal BMD curve in our study. As a result of the greater surface area in trabecular compared to cortical bone one would expect the rate of bone loss following OVX to be greatest in the spine, intermediate in the hip, and least in the forearm, as was the case in the present study. The long duration of the study revealed that the rate of bone loss in the hip of intact animals was similar after 12 months to that of OVX animals. We cannot explain this similarity except to assume that the low level of activity in both animal groups may have had an overriding effect on bone loss at this site relative to that of estrogen deprivation. Whereas chronic muscle weakness may cause osteopenia and weaken bone in human beings [27], the precise role of physical activity in the maintenance of adult human bone mass remains unclear [28], and no data are available on the non-human primate hip. Jerome and co-workers [3] showed that OVX decreased femoral neck strength in non-human primates, however no data on hip BMD were given and the role of physical activity was also not presented [3]. Studies in post-menopausal women showed an accelerated phase of bone loss in the proximal femur, maximal in the first year after the menopause [29]; however only a small percentage of women sustained a fast rate of bone loss over several years. Because of the uncertain effect of lack of physical activity on hip bone loss in the baboon in captivity, the appropriateness of hip BMD data of this model for the study of the effects of estrogen deprivation and its treatment must be questioned.
Published data on bone histomorphometry data in the baboon are scant [4, 7, 8, 10]. Similarities between human and baboon trabecular bone are thought to make the baboon well suited for the study of microstructure and bone turnover of trabecular bone with relevance to human beings because of comparable remodeling [7]. The decline in trabecular bone volume (BV/TV) and trabecular number (Tb.N) in our OVX baboons, and the increase in trabecular separation (Tb.Sp) in the presence of high bone turnover in the 12-month biopsies are presumably the result of trabecular perforations by osteoclastic resorption [30]. Similar changes have been found in post-menopausal women [31, 32]. The regain in BV/TV in our OVX animals by 24 months may have resulted from the increase in W.Th and the concomitant thickening of trabeculae which may have been the consequence of a longer formation period in the presence of an increased bone formation rate. Monkeys were also found to have increased wall thickness 2 years post-OVX [8] and OVX-baboons studied by others had regained most of their trabecular bone volume by 24 months [10]. While thickening of trabeculae accompanying bone loss was also recorded in man [33, 34], wall thickness (W.Th) in normal post-menopausal women was found to decline with age [9] as a result of defective osteoblast recruitment [35]. The non-concordance of bone loss and gain between iliac crest bone biopsies and lumbar or hip BMD may lie in the fact that the bone biopsy examined only trabecular bone, whereas the lumbar and hip regions of densitometric interest also contain a considerable proportion of cortical bone. Trabecular bone with its larger bone surface is more rapidly altered by increased bone turnover than is cortical bone.
The three-fold increase in our OVX animals of eroded surface (ES/BS) and osteoid surface (OS/BS) is a result of the increase in activation frequency (Ac.f) of new remodeling sites and corroborates previous findings in OVX baboons [10]. The comparable rise in OS/BS and ES/BS suggests preserved coupling between erosion and subsequent formation. The slight increase in ES/BS in our control animals may have been contributed to by lack of mobility in captivity, similar to the stimulatory effect on bone erosion by immobility in paraplegics [36]. The increase in osteoid thickness (O.Th) after OVX may reflect an increased proportion of younger, active, and therefore wider osteoid seams [37] resulting from increased activation frequency in the presence of coupling. Other investigators observed a similar phenomenon in OVX primates compared to controls [8, 10]. This interpretation in our OVX animals is supported by the greater mineral apposition rate (MAR) which reflects increased vigour of individual osteoblasts. A similar constellation of increased O.Th and MAR in OVX non-human primates has also been described previously [8, 10].
Bone loss in the face of increased bone formation and preserved coupling in our OVX animals must be presumed to have come about through increased bone resorption activity. Although the resorption period (Rs.P) could not be calculated (no osteoclast data), it had likely remained largely unchanged in view of the parallel rise of the remodeling period (Rm.P) and the formation period (FP). Thus the increase in ES/BS may be taken to reflect increased resorption activity and/or osteoclast numbers.
In summary, the histomorphometric differences between our non-human primate OVX model and post-menopausal women were the recovery from post-OVX trabecular bone loss, and an increase in MAR, O.Th and W.Th in the animals against no recovery from bone loss, and decline in MAR, O.Th and W.Th in post-menopausal women. These differences may in part be due to absence of the aging factor in the animals. For this reason, the OVX baboon model has relevance only to the early post-menopausal years in women before aging exerts its additional detrimental effects on bone formation.
The three bone turnover markers alkaline phosphatase (ALPs), osteocalcin (OC) and Dpd rose in the first year post-OVX and thus reflected the increased bone turnover seen on histomorphometry. The reason for the later rise in Dpd than that of the formation markers is unclear. Stimulation of both osteoblastogenesis and osteoclastogenesis by estrogen deficiency may have played a role [38], but the great variability of Dpd among OVX animals may have obscured the true pattern of changes. The marked increase in ALPs post-OVX was similar to that seen in oophorectomized women [39] and in pharmacologically and surgically ovariectomized non-human primates [8, 10, 40]. Whereas ALPs in our OVX animals remained elevated for the full 48 months post-OVX, OC concentrations returned to pre-OVX levels 18 months after surgery. Similar OC changes had been observed in OVX monkeys [8] and in monkeys given gonadotropin releasing hormone agonist [40]. Comparable findings have also been reported in post-menopausal women [40]. Our data suggest that ALPs may be a better marker of bone formation in a long-term OVX non-human primate model since OC may be an index of bone turnover rather than of formation alone [41]. Dpd reached a peak only at 12 months and thereafter declined which is in keeping with other findings in ovariectomized baboons [10] and monkeys [42], and in an immobilization model of osteoporosis in monkeys [38].
The rise in serum calcium (sCa) and phosphate (sPi) in our OVX animals is in keeping with similar findings in OVX baboons by Thompson [4] and Balena [10]. This change may be attributable to estrogen deficiency since estrogen replacement therapy in OVX monkeys was associated with lower levels of sCa and sPi than in untreated OVX monkeys [11]. Oophorectomized women too showed significantly elevated Ca levels after OVX compared to intact patients, although this change had remained within normal limits [43]. The rise in sCa levels in our OVX animals may have been attributable to the increase in bone resorption. The increased circulating concentrations of 1,25(OH)2D were unlikely the sole cause since a lesser rise in sCa occurred in control animals despite a similar increase in 1,25(OH)2D levels. An absence of a change in urinary Ca and Pi in our OVX animals is also in keeping with findings by other investigators [4, 10]. Oophorectomized women, on the other hand, showed higher urinary Ca/creatinine ratios [43] than healthy post-menopausal women. Osteoporotic women also had higher urinary concentrations of Ca than healthy women [44]. The raised serum concentrations of 1,25(OH)2D in both animal groups in the present study may have been related to the high vitamin D concentrations in the diet. Of between 90 and 120 μg/day. Whereas no recommended daily dose of vitamin D for baboons is available, the daily requirement by human beings ranges between 15 and 25 μg, although higher doses have been used. On a per kg body weight basis the amount of daily vitamin D intake was approximately 3 times the human dose. Raised levels of 1,25(OH)2D were also recorded in other studies of OVX baboons [4] and dogs [45] although neither study gives the vitamin D intake of the animals [4, 45]. Ideally, an animal model with relevance to bone loss in post-menopausal women should rather be given a lower dose of vitamin D in view of sub-optimal serum concentrations of 1,25(OH)2D, and impaired intestinal calcium absorption in elderly women and patients with osteoporosis [46]. It remains unclear why PTH levels showed a tendency to increase with time after OVX. Other data in baboons noted slightly lower PTH levels in OVX animals than in controls [4]. Calcitonin levels showed no significant changes in either this or similar studies on baboons [4, 10].
Studies in rodents have shown that vitamin D deficiency reduces deposition of transforming growth factor-β (TGF-β) isoforms in the bone matrix indicating that vitamin D and bone-derived TGF-βs are required for normal repair and homeostasis of the skeleton [47]. Further studies by Finkelman et al.[48] showed that OVX selectively reduces the concentration of TGF-β isoforms in rodent bone matrix [48]. Collectively, the studies of Finkelman et al. [47, 48] indicate that the diminished skeletal TGF-β in vitamin D deficient and OVX rodents plays a role in the pathogenesis of systemic bone loss, fractures and microfractures that occur in oestrogen-deficient states [47, 48].
TGF-β is a critical morphogen responsible for skeletal volume regulating the mechanical properties and composition of the bone matrix [49]. The above findings in OVX and vitamin D deficient rodents are consistent with reports that bone matrix that has reduced osteoinductive activity is deficient in TGF-β proteins [47] and that bone matrix prepared from OVX rats has reduced osteoinductive potential compared with matrix similarly prepared from sham-operated control animals [50]. This is of particular importance when considering that in primates and in primates only, the TGF-β isoforms so far tested in the non-human primate Papio ursinus induce rapid endochondral bone differentiation in heterotopic extraskeletal sites [51, 52]. The temporal and spatial expressions of TGF-β1 mRNA indicate a specific temporal transcriptional window during which expression of TGF-β1 is mandatory for successful and optimal osteogenesis [53]. It may be of interest to measure TGF-β proteins in OVX non-human primates to assess the potential contribution of TGF-β isoforms to OVX bone loss in this model.
Limitations of the study on this cohort of OVX and non-OVX non-human primates Papio ursinus are the relatively small numbers with reference to histomor-phometric evaluation, unequal sample size of experimental and control animals, and the use of feral animals whose exact age is not known.
This study has shown a maximal deleterious effect of OVX on bone in the first 12 months after OVX. During this period, the loss of lumbar BMD, microarchitectural deterioration of trabecular bone, and increased bone turnover as judged by histomorphometry and biochemical markers of bone turnover were consistent with and resembled those of post-menopausal osteoporosis. The present data indicate that the OVX non-human primate Papio ursinus is a suitable model for the study of post-menopausal bone loss, especially in the first 12 months post-OVX.
Acknowledgments
This study is supported by grants of the South African Medical Research Council, the University of the Witwatersrand, Johannesburg, the National Research Foundation and by ad hoc grants to the Bone Research Unit. We thank Barbara van den Heever, June Teare and Ruqayya Parak for the preparation of undecalcified histological sections, Nathaniel Lentsha Ramoshebi and the staff of the Central Animal Services of the University for critical help in the handling of the primates.
References
- 1.Dempster DW, Linsday R. Pathogenesis of osteoporosis. Lancet. 1993;341:797–804. doi: 10.1016/0140-6736(93)90570-7. [DOI] [PubMed] [Google Scholar]
- 2.Stepan JJ, Pospichal J, Presl J, Pacovsky V. Bone loss and biochemical indices of bone remodeling in surgically induced postmenopausal women. Bone. 1987;8:279–84. doi: 10.1016/8756-3282(87)90002-0. [DOI] [PubMed] [Google Scholar]
- 3.Jerome CP, Turner CH, Lees CJ. Decreased bone mass and strength in ovariectomized Cynomolgus monkeys (Macaca fascicularis. Calcif Tissue Int. 1997;60:265–70. doi: 10.1007/s002239900227. [DOI] [PubMed] [Google Scholar]
- 4.Thompson DD, Seedor JG, Quartuccio H, Solomon H, Fioravanti C, Davidson J, Klein H, Jackson R, Clair J, Frankenfield D, Brown E, Simmons HA, Rodan GA. The bisphosphonate, alendronate, prevents bone loss in ovariectomized baboons. J Bone Miner Res. 1992;7:951–60. doi: 10.1002/jbmr.5650070812. [DOI] [PubMed] [Google Scholar]
- 5.Aufdemorte TB, Fox WC, Miller D, Buffum K, Holt R, Carey KD. A non-human primate model for the study of osteoporosis and oral bone loss. Bone. 1993;14:581–86. doi: 10.1016/8756-3282(93)90197-i. [DOI] [PubMed] [Google Scholar]
- 6.Young DR, Niklowitz WJ, Steele CR. Tibial changes in experimental disuse osteoporosis in the monkey. Calcif Tissue Int. 1983;35:304–08. doi: 10.1007/BF02405051. [DOI] [PubMed] [Google Scholar]
- 7.Schnitzler CM, Ripamonti U, Mesquita JM. Histomorphometry of iliac crest trabecular bone in adult male baboons in captivity. Calcif Tissue Int. 1993;52:447–54. doi: 10.1007/BF00571335. [DOI] [PubMed] [Google Scholar]
- 8.Jerome CP, Carlson CS, Register TC, Bain FT, Jayo MJ, Weaver DS, Adams MR. Bone functional changes in intact, ovariectomized, and ovariectomized hormone-supplemented adult Cynomolgus monkeys (Macaca fascicularis) evaluated by serum markers and dynamic histomorphometry. J Bone Miner Res. 1994;9:527–40. doi: 10.1002/jbmr.5650090413. [DOI] [PubMed] [Google Scholar]
- 9.Recker RR, Kimmel DB, Parfitt AM, Davies, Keshawarz N, Hinders S. Static and tetracycline-based bone histomorphometric data from 34 normal post-menopausal females. J Bone Miner Res. 1988;3:133–44. doi: 10.1002/jbmr.5650030203. [DOI] [PubMed] [Google Scholar]
- 10.Balena R, Toolan BC, Shea M, Markatos A, Myers ER, Lee SC, Opas EE, Seedor JG, Klein H, Frankenfield D, Quartuccio H, Fioravanti C, Clair J, Brown E, Hayes WC, Rodan GA. The effects of 2-year treatment with the aminobisphosphonate alendronate on bone metabolism, bone histomor-phometry and bone strength in ovariectomized non-human primates. J Clin Invest. 1993;92:2577–86. doi: 10.1172/JCI116872. [DOI] [PMC free article] [PubMed] [Google Scholar]
- 11.Jayo MJ, Register TC, Carlson CS. Effect on bone of oral hormone replacement therapy initiated 2 years after ovariectomy in young adult monkeys. Bone. 1998;23:361–6. doi: 10.1016/s8756-3282(98)00106-9. [DOI] [PubMed] [Google Scholar]
- 12.Melton DA, Melton CL. Blood parameters of the wild chacma baboon, Papio ursinus. S Afr J Zool. 1982;17:85–90. [Google Scholar]
- 13.Ripamonti U. Bone induction in nonhuman primates. An experimental study on the baboon (Papio ursinus. Clin Orthop Rel Res. 1991;269:284–94. [PubMed] [Google Scholar]
- 14.Bramblett CA. Non-metric skeletal age changes in the Darajani baboon. Am J Phys Anthrop. 1968;30:161–72. [Google Scholar]
- 15.Dreyer JJ, Du Bruyn DB. Composition of a food mixture developed at the NNRI for supplementation of predominantly cereal diets. S Afric Med J. 1968;42:600–04. [PubMed] [Google Scholar]
- 16.Public Service Department. National code for animal use in research, education, diagnosis and testing of drugs and related substances in South Africa. Pretoria, South Africa: Public Service Department; 1990. [Google Scholar]
- 17.Dal Mas I, Biscardi A, Ripamonti U. Comparison of two hologic DXA Systems (QDR 1000 and QDR 4500/A) for in vivo bone mass measurement in the baboon (Papio ursinus. J Clin Densitometry. 2002;5:313–18. doi: 10.1385/jcd:5:3:313. [DOI] [PubMed] [Google Scholar]
- 18.Parfitt AM, Drezner MK, Glorieux FH, Kanis JA, Malluche HH, Meunier PJ, Ott SM, Recker RR. Bone histomorphometry: nomenclature, symbols and units. Report of the ASBMR histomorphometry committee. J Bone Miner Res. 1987;2:595–610. doi: 10.1002/jbmr.5650020617. [DOI] [PubMed] [Google Scholar]
- 19.Glanz SA. In: Primer of biostatistics. Jeffer JD, Englis MR, editors. McGraw-Hill; 1992. pp. 67–110. [Google Scholar]
- 20.Champ JE, Binkley N, Havighurst T, Colman RJ, Kemnitz JW, Roecker EB. The effect of advancing age on bone mineral content of female Rhesus monkeys. Bone. 1996;19:485–92. doi: 10.1016/s8756-3282(96)00243-8. [DOI] [PubMed] [Google Scholar]
- 21.Recker RR, Davies KM, Hinders SM, Heaney RO, Stegman MR, Kimmel DB. Bone gain in young adult women. JAMA. 1992;268:2403–08. [PubMed] [Google Scholar]
- 22.Jayo MJ, Weaver DS, Adams MR, Rakin SE. Effects on bone of surgical menopause and estrogen therapy with or without progesterone replacement in Cynomolgus monkeys. Am J Obstet Gynecol. 1990;193:614–8. doi: 10.1016/0002-9378(90)91212-u. [DOI] [PubMed] [Google Scholar]
- 23.Christiansen C, Christiansen MS, McNair P, Hagen C, Stocklund K-E, Transbol IB. Prevention of early postmenopausal bone loss: Controlled 2-year study in 315 normal females. Eur J Clin Invest. 1980;10:273–9. doi: 10.1111/j.1365-2362.1980.tb00033.x. [DOI] [PubMed] [Google Scholar]
- 24.Genant HK, Cann CE, Ettinger B, Gordan GS. Quantitative computed tomography of vertebral spongiosa: a sensitive method for detecting early bone loss after oophorectomy. Ann Int Med. 1982;97:699–705. doi: 10.7326/0003-4819-97-5-699. [DOI] [PubMed] [Google Scholar]
- 25.Parfitt AM. Misconceptions (2): turnover is always higher in cancellous than in cortical bone. Bone. 2002;30:807–9. doi: 10.1016/s8756-3282(02)00735-4. [DOI] [PubMed] [Google Scholar]
- 26.Melsen F, Mosekilde L, Brixen K, Steinicke T. ADFR – The concept and its performance. In: Marcus R, Feldman D, Kelsey J, editors. Osteoporosis. New York: Academic Press; 1996. pp. 1145–58. [Google Scholar]
- 27.Frost HM. Changing views about “Osteoporoses” (a 1998 overview) Osteoporos Int. 1999;10:345–52. doi: 10.1007/s001980050239. [DOI] [PubMed] [Google Scholar]
- 28.Snow CM, Shaw JM, Matkin CC. Physical activity and risk for osteoporosis. In: Marcus R, Feldman D, Kelsey J, editors. Osteoporosis. San Diego: Academic Press; 1996. pp. 511–28. [Google Scholar]
- 29.Pouillès JM, Trémollières F, Ribot C. Variability of vertebral and femoral postmenopausal bone loss: a longitudinal study. Osteoporos Int. 1996;6:320–24. doi: 10.1007/BF01623392. [DOI] [PubMed] [Google Scholar]
- 30.Parfitt AM. Age-related structural changes in trabecular and cortical bone: cellular mechanisms and biomechanical consequences. Calcified Tissue Int. 1984;36:S123–8. doi: 10.1007/BF02406145. [DOI] [PubMed] [Google Scholar]
- 31.Han ZH, Palnitkar S, Rao DS, Nelson D, Parfitt AM. Effect of ethnicity and age or menopause on the structure and geometry of iliac bone. J Bone Miner Res. 1996;11:1967–75. doi: 10.1002/jbmr.5650111219. [DOI] [PubMed] [Google Scholar]
- 32.Han ZH, Palnitkar S, Rao DS, Nelson D, Parfitt AM. Effects of ethnicity and age or menopause on the remodeling and turnover of iliac bone: Implications for mechanisms of bone loss. J Bone Miner Res. 1997;12:498–508. doi: 10.1359/jbmr.1997.12.4.498. [DOI] [PubMed] [Google Scholar]
- 33.Vesterby A, Gundersen HJG, Melsen F, Mosekilde L. Normal postmenopausal women show iliac crest trabecular thickening on vertical sections. Bone. 1989;10:333–9. doi: 10.1016/8756-3282(89)90129-4. [DOI] [PubMed] [Google Scholar]
- 34.Parfitt AM, Mathews AR, Villanueva AR, Kleerekoper M. Relationship between surface, volume, and thickness of iliac trabecular bone in aging and in osteoporosis. J Clin Invest. 1983;72:1396–409. doi: 10.1172/JCI111096. [DOI] [PMC free article] [PubMed] [Google Scholar]
- 35.Parfitt AM, Villanueva AR, Foldes J, Rao DS. Relations between histologic indices of bone formation: Implications for the pathogenesis of spinal osteoporosis. J Bone Miner Res. 1995;10:466–73. doi: 10.1002/jbmr.5650100319. [DOI] [PubMed] [Google Scholar]
- 36.Minaire P, Meunier P, Edouard C, Bernard J, Courpron P, Bourret J. Quantitative histological data on disuse osteoporosis. Calcif Tissue Res. 1974;17:57–73. doi: 10.1007/BF02547214. [DOI] [PubMed] [Google Scholar]
- 37.Parfitt AM. Osteonal and hemiosteonal remodelling. J Cell Biochem. 1994;55:273–86. doi: 10.1002/jcb.240550303. [DOI] [PubMed] [Google Scholar]
- 38.Jilka RL. Cytokines, bone remodeling and estrogen deficiency: a 1998 update. Bone. 1998;23:75–81. doi: 10.1016/s8756-3282(98)00077-5. [DOI] [PubMed] [Google Scholar]
- 39.Stepan JJ, Presl J, Broulik P, Pacovsky V. Serum osteocalcin levels and bone alkaline phosphatase isoenzyme after oophorectomy and in primary hyperparathyroidism. J Clin Endocrinol Metab. 1987;64:1079–82. doi: 10.1210/jcem-64-5-1079. [DOI] [PubMed] [Google Scholar]
- 40.Mann DR, Gould KG, Collins DC. A potential primate model for bone loss resulting from medical oophorectomy or menopause. J Clin Endocrinol Metab. 1990;71:105–10. doi: 10.1210/jcem-71-1-105. [DOI] [PubMed] [Google Scholar]
- 41.Delmas PD, Garnero P. Utility of biochemical markers of bone turnover in osteoporosis. In: Marcus R, Feldman D, Kelsey J, editors. Osteoporosis. San Diego: Academic Press; 1996. pp. 1075–1088. [Google Scholar]
- 42.Jerome CP. Primate models of osteoporosis. Lab Anim Sci. 1998;48:618–62. [PubMed] [Google Scholar]
- 43.Ohta H, Makita K, Suda Y, Ikeda T, Masuzawa T, Nozowa S. Influence of oophorectomy on serum levels of sex steroids and bone metabolism and assessment of bone mineral density in lumbar trabecular bone by QCT-C value. J Bone Miner Res. 1992;6:659–65. doi: 10.1002/jbmr.5650070610. [DOI] [PubMed] [Google Scholar]
- 44.Seibel MJ, Cosman F, Shen V, Gordon S, Dempster DW, Ratcliffe A, Linsday R. Urinary hydrohypyridinum crosslinks of collagen as markers of bone resorption and estrogen efficacy in postmenopausal osteoporosis. J Bone Miner Res. 1993;8:881–9. doi: 10.1002/jbmr.5650080714. [DOI] [PubMed] [Google Scholar]
- 45.Snow GR, Cook MA, Anderson C. Oophorectomy and cortical bone remodelling in the beagle. Calcif Tissue Int. 1984;36:586–90. doi: 10.1007/BF02405371. [DOI] [PubMed] [Google Scholar]
- 46.Heaney RP. Nutrition and risk for osteoporosis. In: Marcus R, Feldman D, Kelsey J, editors. Osteoporosis. San Diego: Academic Press; 1996. p. 483. [Google Scholar]
- 47.Finkelman RD, Linkhart TA, Mohan S, Lau WK-H, Baylink DJ, Bell NH. Vitamin D deficiency causes a selective reduction in deposition of transforming growth factor β in rat bone: Possible mechanism for impaired osteoinduction. Proc Natl Acad Sci USA. 1991;88:3657–60. doi: 10.1073/pnas.88.9.3657. [DOI] [PMC free article] [PubMed] [Google Scholar]
- 48.Finkelman RD, Bell NH, Strong DD, Demers LM, Baylink DJ. Ovariectomy selectively reduces the concentration of transforming growth factor β in rat bone: Implications for estrogen deficiency-associated bone loss. Proc Natl Acad Sci USA. 1992;89:12190–3. doi: 10.1073/pnas.89.24.12190. [DOI] [PMC free article] [PubMed] [Google Scholar]
- 49.Balooch G, Balooch M, Nalla RK, Schilling S, Filvaroff E, Marshall GW, Marshall SJ, Ritchie RO, Derynck R, Alliston T. TGF-β regulates the mechanical properties and composition of bone matrix. Proc Natl Acad Sci USA. 2005;102:18813–8. doi: 10.1073/pnas.0507417102. [DOI] [PMC free article] [PubMed] [Google Scholar]
- 50.Cesnjaj M, Stavljenic A, Vukicevic S. Decreased osteoinductive potential of bone matrix from ovariectomized rats. Acta Orthop Scand. 1991;62:471–5. [PubMed] [Google Scholar]
- 51.Ripamonti U, Duneas N, Van Den Heever B, Bosh C, Crooks J. Recombinant transforming growth factor-β1 induces endochondral bone in the baboon and synergizes with recombinant osteogenic protein-1 (bone morphogenetic protein-7) to initiate rapid bone formation. J Bone Miner Res. 1997;12:1584–95. doi: 10.1359/jbmr.1997.12.10.1584. [DOI] [PubMed] [Google Scholar]
- 52.Ripamonti U. Soluble, insoluble and geometric signals sculpt the architecture of mineralized tissues. J Cell Mol Med. 2004;8:169–80. doi: 10.1111/j.1582-4934.2004.tb00272.x. [DOI] [PMC free article] [PubMed] [Google Scholar]
- 53.Ripamonti U. Bone induction by recombinant human osteogenic protein-1 (hOP-1, BMP-7) in the primate Papio ursinus with expression of mRNA of gene products of the TGF-β superfamily. J Cell Mol Med. 2005;9:911–28. doi: 10.1111/j.1582-4934.2005.tb00388.x. [DOI] [PMC free article] [PubMed] [Google Scholar]