

Abstract
Ulcerative colitis (UC) is an inflammatory bowel disease with alterations of colonic motility, which influence clinical symptoms. Although morpho-functional abnormalities in the enteric nervous system have been suggested, in UC patients scarce attention has been paid to possible changes in the cells that control colonic motility, including myenteric neurons, glial cells and interstitial cells of Cajal (ICC). This study evaluated the neural-glial components of myenteric ganglia and ICC in the colonic neuromuscular compartment of UC patients by quantitative immunohistochemical analysis. Full-thickness archival samples of the left colon were collected from 10 patients with UC (5 males, 5 females; age range 45–62 years) who underwent elective bowel resection. The colonic neuromuscular compartment was evaluated immunohistochemically in paraffin cross-sections. The distribution and number of neurons, glial cells and ICC were assessed by anti-HuC/D, -S100β and -c-Kit antibodies, respectively. Data were compared with findings on archival samples of normal left colon from 10 sex- and age-matched control patients, who underwent surgery for uncomplicated colon cancer. Compared to controls, patients with UC showed: (i) reduced density of myenteric HuC/D+ neurons and S100β+ glial cells, with a loss over 61% and 38%, respectively, and increased glial cell/neuron ratio; (ii) ICC decrease in the whole neuromuscular compartment. The quantitative variations of myenteric neuro-glial cells and ICC indicate considerable alterations of the colonic neuromuscular compartment in the setting of mucosal inflammation associated with UC, and provide a morphological basis for better understanding the motor abnormalities often observed in UC patients.
Keywords: ulcerative colitis, myenteric ganglionic cells, HuC/D, S100β, interstitial cells of Cajal
Introduction
Ulcerative colitis (UC) is a chronic inflammatory bowel disorder associated with functional changes, including abnormal colonic motility and transit, which may contribute to abdominal pain and diarrhoea [1–3] experienced by patients with active disease or in remission [4]. These motor disturbances are suggestive of alterations of colonic neuromuscular components, including enteric neurons, interstitial cells of Cajal (ICC) and smooth muscle cells, whose structural and functional integrity are essential requirements to ensure physiological patterns of coordinated motor activity in the gut [5–8].
Although colonic dysmotility in UC patients has been well established, scarce attention has been paid to underlying alterations of the anatomical structures involved in the control of large bowel neuromuscular activity. Furthermore, heterogeneous methodological approaches, differing mainly in terms of histological techniques (e.g. orientation and sectioning, ganglionic cell counting, etc.), have been previously employed in evaluating the enteric nervous system (ENS) in normal and UC colonic samples, thus yielding hardly comparable, or even conflicting, results. Although some efforts have been previously made to obtain reliable quantitative estimations of ganglionic cells and ICC, careful morphological examinations and development of standardized protocols are still particularly required in the field of gastrointestinal neuromuscular pathology, in order to overcome the heterogeneity of available data [9–11]. Based on the above considerations, and following the recommendations issued by the International Working Group on Gastrointestinal Neuromuscular Disease [9, 10], we designed the present study, which was conducted on left colonic samples from UC patients and control patients, with the purpose of performing an accurate and standardized quantitative immunohistochemical analysis of the neural-glial components of myenteric ganglia and ICC populations in this gut region. Gaining knowledge in this setting is critical for a better definition of mechanisms underlying colonic dysfunction in patients with UC.
Materials and methods
Patients and tissue samples
The study was carried out on full-thickness archival samples of left (descending and sigmoid) colon obtained from 10 patients (5 males, 5 females; age range 45–62 years) with UC, who had undergone elective bowel resection due to left-sided colitis from the dentate line to the splenic flexure, lasting over 5 years. All patients had been scheduled for surgical intervention owing to a persistent condition of refractoriness to immunosuppressant therapy and/or steroid dependence. The investigation was focused on the left colon for two reasons: (1) normative values from otherwise normal left-side colon have been previously published by our group [12]; (2) to minimize inter-individual variability when comparing data from different segments of the colon. Care was taken to select areas including teniae with macroscopic involvement: the external surface appeared normal or slightly contracted, the mucosa diffusely congested, granular and haemorrhagic with ulcers linearly distributed in particular at level of the attachment of teniae. Archival colonic samples from ten patients (5 males, 5 females; age range 42–60 years), who had undergone surgery for uncomplicated left colon cancer and without previous history of abdominal surgery, inflammatory bowel disease or intestinal obstruction, served as controls. Control samples were also selected from areas including teniae at least 10 cm away from any macroscopically visible lesion. Because the study was performed on archival material, no individual patient identification was involved, and no study-driven clinical intervention was performed, a simplified Institutional Review Board approval was obtained.
Routinely fixed and processed full-thickness colonic samples were serially cross-sectioned to obtain 10 μm-thick sections with circular layer and myenteric ganglia cut longitudinally. Serial sections, 1/18 sections for a distance of 180 μm to prevent counting the same neuron in adjacent sections, were evaluated by two independent observers for each selected colonic specimen. Before use, slides were deparaffinized, rehydrated and processed for routine haematoxylin and eosin staining or immunohistochemistry. The morphological features of the colon were assessed on haematoxylin and eosin stained specimens by the pathologists (D.C., M.C.): the microscopic analysis of samples obtained from UC patients confirmed the presence of classical mucosal/submucosal lesions consistent with UC as well as the occurrence of plexitis/ganglionitis in the myenteric plexus of all UC patients according to previously published data [13, 14]. A normal morphology was detected in colonic samples from all control patients.
Immunohistochemistry
Myenteric neurons, glial cells and ICC were identified by anti-HuC/D, anti-S100β and anti-c-Kit antibodies, respectively. Antibody and reagent details are reported in Table 1. 3,3′-Diaminobenzidine tetrahydrochloride (DAB, DakoCytomation, Glostrup, Denmark) and DAB enhanced with nickel chloride (10% nickel chloride; Sigma-Aldrich, St. Louis, MO, USA) were employed as chromogen substrates to obtain brown and black reaction products depending on protocols.
Table 1.
Antibodies used in the present study
| Primary antibodies | Clone | Host | Dilution | Code and source | References |
|---|---|---|---|---|---|
| HuC/D | MAb | Mouse | 1:100 | A-21271, Molecular Probes, Eugene, OR, USA | [19] |
| S100β | MAb | Mouse | 1:2000 | S2532, Sigma-Aldrich | [35] |
| c-Kit (CD117) | PAb | Rabbit | 1:200 | A4502, DakoCytomation | [36] |
| Secondary antibodies | Host | Dilution | Code and source | ||
| Biotinylated antimouse IgG (H + L) | Goat | 1:200 | BA-9200, Vector, Burlingame, CA, USA | ||
| Biotinylated anti-rabbit IgG (H + L) | Goat | 1:200 | BA-1000, Vector | ||
| Biotinylated anti-rabbit, antimouse IgG from LSAB®+ System-HRP | Swine | Ready to use | K 0690, DakoCytomation |
All primary antibodies were cross-reacting with the respective antigens of human origin. MAb: monoclonal antibody; PAb: polyclonal antibody. HuC/D: human neuronal proteins HuC and HuD; S100β: bovine S100β protein; c-Kit: human c-Kit (CD117); H + L: heavy and light chains; LSAB: labelled streptavidin biotin; HRP: horseradish peroxidase.
Negative controls for primary antibodies were obtained by omitting or substituting them with preimmune rabbit or mouse serum (1:100). Endogenous peroxidases were assayed by incubating slides with either DAB alone or nickel enhanced-DAB alone. Avidin-binding activity was tested by using streptavidin-horseradish peroxidase complex/DAB or /nickel enhanced-DAB. All reactions were performed at room temperature and in humid chambers, unless otherwise stated. Care was taken to select well oriented and well stained microscopic fields for each immunostained structure of interest. Cell counts were carried out by investigators blinded to the clinical diagnosis.
Identification and quantitative analysis of ganglion cells
To detect myenteric neurons and glial cells, a double immunolabelling with anti-HuC/D and -S100β antibodies was performed as previously described [12]. Briefly, after heat-induced epitope retrieval and non-specific binding block, the following reagents were applied sequentially: primary antibodies (anti-HuC/D and anti-S100β), detection kit LSAB®+ system-HRP and chromogen substrate, which consisted of DAB and nickel enhanced-DAB for HuC/D and S100β, respectively.
Five cross-sections from one colonic specimen serially cut per patient (1/18 sections) were examined as previously reported [12]: the first section processed for immunohistochemistry was the 18th section after the haematoxylin and eosin slice examined by the pathologists. For each section, 30 non-adjacent randomly selected, microscopic fields, taken along the myenteric ganglionic ridge, were examined in order to count immunolabelled cells and estimate the respective ganglionic areas, which were expressed as a percentage of the respective microscopic field area. Samples were examined at 400× magnification by a light microscope equipped with a digital camera (DFC480; Leica, Cambridge, UK), and ganglionic areas were estimated by highlighting them using an Image Analysis System Quantimet, Qwinv 500 plus (Cambridge Instruments, Cambridge, UK). A ganglionic area of at least 1.4 mm2 was examined for each patient and it was expressed as percentage of the total neuromuscular tissue area examined (at least 10.35 mm2/each patient).
Neurons were counted when their nuclei and/or perikarya displayed HuC/D+ signals, in order to avoid underestimation of neuronal number. For each patient, the number of HuC/D+ neurons and S100β+ cells as well as the respective ganglionic area percentage were expressed as sums (Σs) of values obtained from examination of five serial sections (30 fields/section). Cell density (cell number/mm2) and glial cell/neuron ratio were calculated from the respective Σs values. Data from different patients or control patients were also averaged and expressed as mean ± S.D.
Identification and quantitative analysis of ICC and mast cells
c-Kit-immunolabelled ICC were revealed by nickel-DAB enhancement and counterstained with nuclear fast red (Fluka, Buchs, Switzerland). Only c-Kit+ cells with red nuclei were considered for ICC counting by means of a squared grid. Strongly c-Kit-immunostained cells, with morphological appearance and size of mast cells, were taken as internal positive controls, excluded from the analysis of ICC and counted apart.
Five cross-sections (1/18 sections) for each colonic specimen were examined. For each section, 30 randomly selected microscopic fields were captured at 200× magnification. Ten fields were then focused on the circular muscle (CM), 10 on the myenteric region (MP) and 10 on the longitudinal muscle (LM) to count ICC-CM, ICC-MP and ICC-LM, respectively. The MP comprises the ridge of myenteric ganglia and the CM-LM interface intercalated between ganglia; thus, ICC-MP counting included periganglionic ICC located within the CM and LM bundles adjacent to myenteric ganglia and interganglionic ICC. Each microscopic field was analysed by the Qwinv 500 plus Quantimet System to obtain the accurate value of immunolabelled tissue-covered areas.
For each patient, a total tissue area of at least 20 mm2 was examined and partitioned in 0.5, 10.5 and 9.0 mm2 for MP, CM and LM, respectively. The ICC density of each patient was expressed as ΣICC and mast cells/Σtissue area found in the five serial sections (30 fields/section).
Quantitative determination of ICC area
The ICC area was estimated in serial sections adjacent to those used for cell counting and subjected to nickel-DAB/c-Kit immunolabelling without nuclear fast red counterstaining. For each section, 30 microscopic fields, focused on the neuromuscular compartment, were captured at 200× magnification and analysed by the Image Analysis System Quantimet (Qwinv 500 plus). Each field was subjected to intensity thresholding (from 150/255 to 185/255 depending on signal-to-noise ratio) in order to highlight the immunoreactive area, which was expressed as percentage of the total tissue area examined (percentage positive pixels [PPP]), according to Bettolli et al.[15]. For each patient, the percentage of c-Kit+ area was expressed as mean ± S.D. of positive areas estimated on the 30 fields examined for each of five sections (at least 20 mm2 of colonic tissue examined/patient). For each group, the value of c-Kit+ area was expressed as mean ± S.D. of individual area percentages estimated in patients or control patients.
Statistical analysis
Linear regression analysis, performed by commercial software (GraphPad Prism®, version 3.0; GraphPad Software, Inc., San Diego, CA, USA), was employed to analyse correlation between ganglionic areas and the respective cell counts estimated for each slice within each patient and in different patients. Student’s t-test for paired data (two tailed) was performed to assess the statistical differences between groups. A P-value <0.05 was considered statistically significant.
Results
Routine light microscopy
In control patients, neurons and associated glia formed a homogeneous cluster of cells aggregated in well visualizable and readily detectable myenteric ganglia showing normal appearance (Fig. 1A). In the colon of UC patients, myenteric ganglia showed several empty lacunar spaces, associated with depletion of neuronal cell bodies, and some ganglia were ‘ectopic’, being embedded within the CM or LM layers, outside from their typical location (i.e. the MP) [16]. Signs of myenteric ganglionitis/plexitis were observed in all UC samples and consisted of an inflammatory infiltrate (<4 cells) including eosinophils, lymphocytes or, occasionally, plasma cells adjacent to or within myenteric ganglia or nerve bundles (Fig. 1B).
Fig 1.
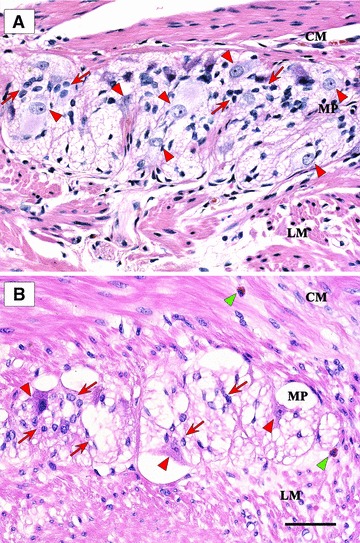
Haematoxylin and eosin stained sections showing myenteric ganglia of full-thickness human left colon. (A) Control patient: a compact ganglion with normal architecture, bulky neurons (arrowheads) and several glial cells (arrows); (B) UC patient: a vacuolated ganglion with a few neurons (red arrowheads) and glial cells (red arrows); two eosinophil granulocytes (green arrowhead), one along the myenteric plexus (MP) region and one in the CM; LM, longitudinal muscle. Scale bar: 50 μm.
Immunohistochemistry
Myenteric neurons and glial cells
Neurons were identified by their HuC/D immunostained nucleus and/or cytoplasm, and glial cells by a sharp nuclear/cytoplasmic S100β immunoreaction. All control patients had colonic myenteric ganglia filled homogeneously with HuC/D-labelled neurons and S100β-labelled glial cells (Fig. 2A), whereas a loss of myenteric neurons and glial cells was observed in UC patients (Fig. 2B).
Fig 2.
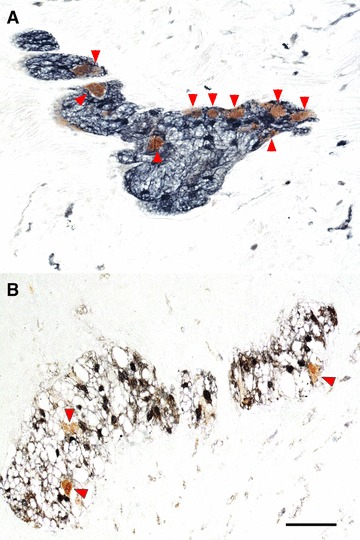
Myenteric ganglia of full-thickness human left colon, in control patients (A) and UC patients (B), double-immunostained with antibodies to the neuronal marker HuC/D (brown) and the glial cell marker S100β (black): neuronal cell bodies (arrowheads) are reduced in number in UC patients, as compared to controls. Scale bar: 50 μm.
The mean of ganglionic area percentage, relative to the microscopic field area, in UC patients (2.35 ± 0.54%) was higher as compared to controls (1.48 ± 0.60%) with a significant increment of +59% (individual values in Table 2). In control patients, the mean values of neuron and glial cell density were 604.89 ± 29.65/mm2 and 2536.62 ± 126.67/mm2, respectively, whereas in the inflamed colon the respective values decreased significantly, accounting for 237.56 ± 59.93/mm2 and 1578.48 ± 258.14/mm2. A constant ratio between myenteric S100β+ glial cells and HuC/D+ neurons was observed in control patients and UC patients. In particular, the number of glial cells exceeded that of neurons by approximately 4.19 ± 0.10-fold in normal colon and 6.84 ± 1.06-fold in UC, with a significant increment in UC (individual and mean patients’ values are listed in Tables 2 and 3, respectively).
Table 2.
HuC/D+ neurons and S100β+ glial cells in myenteric ganglionic areas (mm2), respective densities and glial cell/neuron ratio in left colonic samples from control patients (C) and UC patients (UC)
| Neurons* | Glial cells† | Ganglionic area‡, (%)§ | Neuron density# | Glial cell density$ | Glial cell/neuron ratio** | |
|---|---|---|---|---|---|---|
| C | ||||||
| 1 | 699 | 3039 | 1.238 (11.96) | 564.62 | 2454.77 | 4.35 |
| 2 | 864 | 3566 | 1.299 (12.55) | 665.13 | 2745.19 | 4.13 |
| 3 | 849 | 3652 | 1.355 (13.09) | 626.57 | 2695.20 | 4.30 |
| 4 | 818 | 3425 | 1.397 (13.50) | 585.54 | 2451.68 | 4.19 |
| 5 | 830 | 3546 | 1.436 (13.87) | 577.99 | 2469.36 | 4.27 |
| 6 | 913 | 3899 | 1.482 (14.32) | 616.06 | 2630.90 | 4.27 |
| 7 | 934 | 3841 | 1.553 (15.00) | 601.42 | 2473.28 | 4.11 |
| 8 | 1015 | 4248 | 1.616 (15.61) | 628.09 | 2628.71 | 4.19 |
| 9 | 978 | 3956 | 1.670 (16.14) | 585.63 | 2368.86 | 4.04 |
| 10 | 1023 | 4189 | 1.711 (16.53) | 597.90 | 2448.28 | 4.09 |
| UC | ||||||
| 11 | 462 | 3288 | 1.622 (15.67) | 284.77 | 2027.07 | 7.12 |
| 12 | 534 | 3290 | 1.706 (16.49) | 312.73 | 1927.92 | 6.16 |
| 13 | 372 | 2672 | 1.774 (17.14) | 209.72 | 1506.52 | 7.18 |
| 14 | 519 | 3082 | 2.085 (20.15) | 248.72 | 1477.88 | 5.94 |
| 15 | 391 | 3272 | 2.341 (22.62) | 166.98 | 1397.37 | 8.37 |
| 16 | 409 | 3354 | 2.465 (23.82) | 165.93 | 1360.70 | 8.20 |
| 17 | 486 | 3829 | 2.581 (24.94) | 188.28 | 1483.26 | 7.88 |
| 18 | 878 | 4901 | 2.766 (26.72) | 317.62 | 1772.16 | 5.58 |
| 19 | 579 | 3650 | 3.006 (29.05) | 192.60 | 1214.16 | 6.30 |
| 20 | 897 | 5036 | 3.113 (30.08) | 288.28 | 1617.70 | 5.61 |
Table 3.
Density of myenteric neurons (N) and glial cells (GC), ICC and mast cells in the neuromuscular compartment of left colon in control patients (C) and UC patients (UC)
| Marker | Cell type | C | UC | P |
|---|---|---|---|---|
| HuC/D | N | 604.89 ± 29.65 | 237.56 ± 59.93 | <0.0001 |
| S100β | GC | 2536.62 ± 126.67 | 1578.48 ± 258.14 | <0.0001 |
| c-Kit | ICC-CM | 135.60 ± 9.95 | 30.26 ± 11.17 | <0.0001 |
| c-Kit | ICC-MP | 1054.07 ± 115.20 | 362.46 ± 88.92 | <0.0001 |
| c-Kit | ICC-LM | 127.90 ± 14.15 | 45.62 ± 11.04 | <0.0001 |
| c-Kit | Mast cells-CM | 1.98 ± 0.89 | 5.14 ± 1.74 | <0.001 |
| c-Kit | Mast cells-MP | 0.20 ± 0.32 | 12.99 ± 4.16 | <0.0001 |
| c-Kit | Mast cells-LM | 4.89 ± 1.94 | 18.27 ± 2.67 | <0.0001 |
CM (circular muscle), MP (myenteric plexus), LM (longitudinal muscle); values are expressed as mean ± S.D. of cell density (cell number/mm2); a P-value <0.05 was considered statistically significant by Student’s t-test (UC versus controls).
Data obtained from neuron and glial cell counting were analysed by linear regression. Significant correlations between neuron or glial cell counts and the respective ganglionic areas were observed in all control patients, whereas only two UC patients showed significant correlation for neurons and seven patients for glial cells (Fig. S1; Table S1). Linear regression analysis among patients showed that neuron density correlated significantly both in controls (r= 0.918, P= 0.0002) and UC patients (r= 0.632, P= 0.0496). Likewise, significant correlations were found for glial cell density in control patients (r= 0.890, P= 0.0006) and UC patients (r= 0.754, P= 0.0117) (Fig. S2).
c-Kit+ cells: ICC and mast cells
A marked c-Kit immunoreaction was detected in the ICC of neuromuscular layer and mast cells (used as internal controls) (Fig. 3A). In colonic specimens from control patients, c-Kit immunoreactive ICC appeared as dendritic cell bodies typically located within the CM (ICC-CM) and LM (ICC-LM) layers as well as in the MP (ICC-MP) (Figs 3, 4A, D, G and 5A). Intramuscular ICC were spindle-shaped cells with long bipolar processes mostly running parallel to the axis of smooth muscle cells (Fig. 3B). In the intermuscular region, ICC-MP appeared as multipolar cells and formed a network encasing the myenteric ganglia (Figs 3C and 4D). In colonic samples from UC patients, the overall morphological appearance and distribution pattern of ICC were markedly altered: the c-Kit+ network was rarefied and often disrupted in each layer, and most of ICC displayed considerable morphological alterations with blunted and shortened branching (Figs 4B, E, H and 5B).
Fig 3.
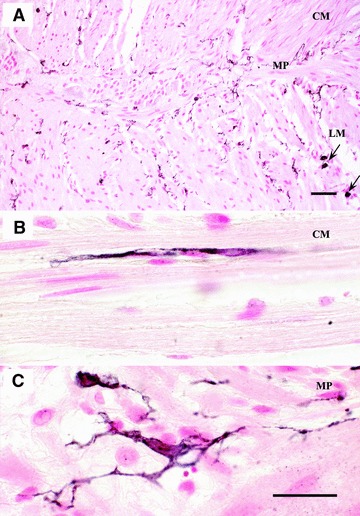
Full-thickness normal human left colon immunostained for c-Kit to detect the ICC (black stain), counterstained with nuclear fast red. ICC (A) are typically distributed within the CM (ICC-CM) and LM (ICC-LM) layers as well as along the MP (ICC-MP); markedly immunoreactive mast cells are present in the external muscular layer (arrows) (B) a bipolar ICC orientated along the main axis of smooth muscle cells in the circular layer (C) a representative example illustrating ICC-MP with their numerous processes in the myenteric plexus (MP) region. Scale bars: 50 μm (A) and 25 μm (B, C).
Fig 4.
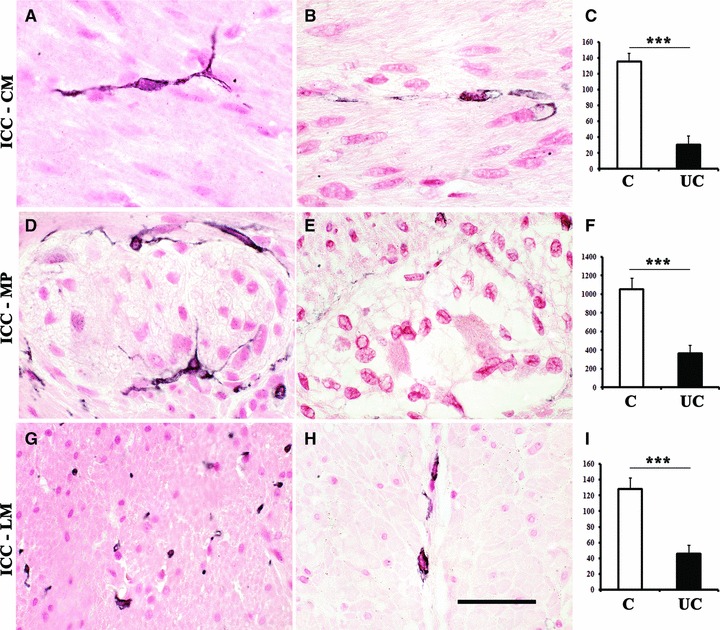
Evaluation of distribution, morphology (A, B, D, E, G, H) and counting (C, F, I) of c-Kit immunolabelled and nuclear fast red-counterstained ICC (black) at the level of CM (ICC-CM) and LM (ICC-LM) layers, and the myenteric plexus region (ICC-MP) of full-thickness human left colon in control patients (A, D, G) and UC patients (B, E, H). In colonic specimens from UC patients, few ICC are detectable and they appear markedly altered: most of them exhibit blunted and shortened branching (B, E, H). Column graphs display ICC counting (white: control, black: UC) which is given as means ± S.D. of individual ICC densities normalized to area (mm2) for ICC-CM (C), ICC-MP (F) and ICC-LM (I). ***P < 0.0001 versus control. Scale bar: 50 μm.
Fig 5.
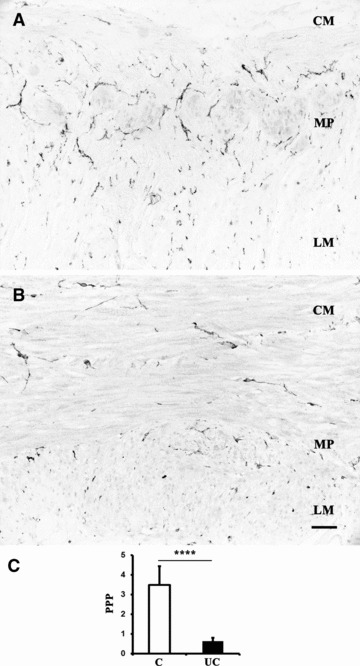
Neuromuscular compartment of full-thickness human left colon: c-Kit-nickel-DAB immunostaining to evaluate ICC area in colonic sections from control patients (A) and UC patients (B). Quantitative image analysis (C) of c-Kit immunoreactivity is expressed as PPP in control patients (white column) and UC patients (black column). Column graphs display the mean ± S.D. of individual values for each group. ****P < 0.00001 versus control. Scale bar: 50 μm.
Only the c-Kit+ spindle- and/or dendritic-shaped cells with a nuclear fast red counterstained nucleus (Fig. 4) were considered for ICC counting and density estimation. The overall ICC density within the neuromuscular compartment was 1317/mm2 in control colon, with a significant decrease to 438/mm2 in UC, and ICC counting carried out separately within each layer allowed to observe a significant decrease in ICC density at every level in UC patients. In particular, the highest density of ICC in control colon was found within the myenteric plexus region (1054.07 ± 115.20/mm2), followed by the CM (135.60 ± 9.95/mm2) and LM (127.90 ± 14.15/mm2) layers. In UC patients the ICC density was 362.46 ± 88.92/mm2 in the MP, 30.26 ± 11.17 and 45.62 ± 11.04/mm2 in the CM and LM layers, respectively (Fig. 4C, F, I; Table 3). On the other hand, increased numbers of mast cells were found within the whole neuromuscular compartment of UC patients versus controls with the following density values: myenteric plexus region (12.99 ± 4.16 versus 0.20 ± 0.32/mm2), CM (5.14 ± 1.74 versus 1.98 ± 0.89/mm2) and LM (18.27 ± 2.67 versus 4.89 ± 1.94/mm2) layers (Table 3).
Quantitative analysis of the area covered by ICC was performed on c-Kit immunostained slides without counterstaining (Fig. 5A, B). A significant decrease in ICC area was observed in UC patients, in whom ICC covered an area corresponding to 0.62 ± 0.18%, as compared to 3.49 ± 0.94% detected in control patients (Fig. 5C).
Discussion
Enteric neurons and glial cells, together with ICC, represent the main regulators of motor functions in the gut wall, ensuring coordinated patterns of smooth muscle activity [1, 3]. This carefully regulated neural/myogenic network is markedly altered in the setting of bowel inflammation, resulting in gut dismotility [5, 17]. However, despite the increasing incidence of UC and its debilitating symptoms, few studies have evaluated the occurrence of morphological alterations in the anatomical structures regulating colonic motility. Previous histopathological data suggested that the ENS and ICC can be targeted by the inflammatory disease in patients with UC [14, 17, 18]. However, there is also evidence suggesting that a primary damage to the enteric glia can cause inflammatory bowel disease, leading to secondary alterations of enteric neurons [19]. The present study was performed to examine the cell composition of myenteric ganglia and ICC distribution in the colon of UC patients in accordance with recently identified technical and methodological criteria of crucial importance for a correct interpretation of neuronal-glia-ICC data [9, 10].
Significant quantitative changes in both myenteric ganglia and ICC were detected by our analysis. Myenteric ganglia were markedly altered in all colonic samples from UC patients. In accordance with previous reports [13], there was a ganglionic vacuolization associated with depletion of neurons and glial cells and a minimal inflammatory infiltration. In particular, the density of HuC/D+ neurons was significantly decreased by about 61% and S100β+ glial cells by about 38%. These data are at variance with those by Villanacci et al.[18], who showed that in UC the number of myenteric neurons did not change significantly. However, this discrepancy can be explained by several reasons: (1) the enrolled patients were younger than those included in our study (i.e. 35–52 versus 45–62 years); (2) neuron-specific enolase was used as neuronal marker and (3) neuronal density was referred to microscopic field areas. In contrast, in our study, HuC/D was preferred over other pan-neuronal markers, as it labels selectively the neural cell bodies, thus increasing the accuracy of quantitative analysis by avoiding confounding factors such as neuropil and nerve endings [10, 12, 20–22], and it has been included among the neuronal markers recommended for immunohistochemical studies of gastrointestinal neuromuscular diseases [9]. Despite these advantages, HuC/D is a marker which stains one single protein, and this limitation may result in inflated estimates of enteric neuronal loss, particularly in aged tissues, as suggested by Phillips et al.[23], who studied enteric neurons from aged rats. In accordance with these findings, different degrees of HuC/D labelling were recorded also in myenteric neurons of the patients evaluated both in the present study and a previous one from our group [12]. Although the sensitivity of HuC/D immunostaining, extensively tested together with the panneuronal cuprolic blue, is considered to be equivalent to cuprolic blue for enteric neuronal quantification [12, 21, 22, 24], we cannot certainly rule out that some neurons failed to express the HuC/D protein due to aging. According to the present findings, the glia/neuron ratio ranged from 3.72 to 4.19, a value lower than that estimated in previous reports (5.9–8.7) [25–27]. Again, such apparent discrepancies might depend on different criteria for cell counts. The present analysis included also neurons with HuC/D+ cytoplasm without a visible nucleus and glial cells specifically labelled for S100β antigen, whereas in previous studies ganglionic cells were identified either as neurons when clearly nucleated, or as glial cells when endowed with small basophil nuclei.
In our study, correlations between myenteric cell counts and the respective ganglionic areas were found for each control patient, but not for all UC patients. In particular, significant correlations were obtained only in two patients for neurons and seven patients for glial cells. In addition, the overall regression analysis of cell density for each group yielded highly significant values for neurons and glial cells in the control group, whereas few significant values, in particular for neurons, were obtained in UC patients. Taken together, these data suggest that neuronal rather than glial cell density was more affected in the UC patients herein examined. The present findings raise the important question of whether the neuronal loss in UC involves indiscriminately all myenteric neurons or selectively affects specific subsets. In a previous study on UC, Neunlist et al.[28] found a neurochemical phenotype shift from acetylcholine to substance P. However, when studying trinitrobenzene sulphonate (TNBS)-induced colitis in guinea-pigs, Linden et al.[29] observed an indiscriminate loss of myenteric neurons. Overall, this is a very important issue, which has not been addressed in the present study and remains open to future investigations.
ENS abnormalities, underlying gut motility disorders, are often associated with altered density, distribution and/or morphology of ICC [30]. Accordingly, we found marked morphological and quantitative alterations of ICC in all UC patients. Indeed, all ICC types (ICC-CM, ICC-LM and ICC-MP) were significantly decreased by over 50%, as compared to control patients. These results, which are at variance with previous reports showing an increased number of intramuscular ICC and unchanged ICC-MP in UC colon [14, 18], might be explained by differences in patients’ population, segments of colon examined and morphometric approaches. The decrease in c-Kit labelled cells identifiable as ICC, as observed in our UC colonic tissues, might also result from an actual loss of ICC or a mere loss of their c-Kit reactivity, a dilemma which could be resolved only by means of transmission electron microscopy. Of interest, our morphological approach revealed that most of the ICC displayed blunted and shortened branching. These morphological alterations, together with reduction in the number of these cells, might contribute to a malfunctioning network. An attempt to assess ICC structural abnormalities in the colon of UC patients has been previously made by Rumessen [8] who, however, focused his evaluations only on submuscular ICC. Using electron microscopy, this author found that ICC had large intracytoplasmatic bodies. Briefly, our data do not allow explaining whether ICC abnormalities in UC patients result from direct effects of inflammatory mediators [14, 17, 18], secondary changes reflecting primary glial damage [19] or inflammatory-related remodelling processes, thereby leading to alterations in the mechanical properties of colonic wall.
Whether mast cells play also an active role in the pathophysiology of inflammation in UC remains to be determined. This is a relevant issue, because in the human gut mast cells are involved in the maintenance of intramuscular ICC viability, through paracrine production of the stem cell factor, which acts as a ligand for the c-Kit receptor [31]. In addition, mast cells can contribute to fibrogenesis and neuroplasticity [32] and possible functional interactions between mast cells and ICC have been suggested in intestinal muscularis externa [33]. However, these cells have been also found to reduce myenteric neuron survival in culture [34]. In the present study, we observed increased numbers of mast cells within the colonic neuromuscular compartment. These findings are in line with previous studies showing a significantly increased mast cell density in the colonic muscle layer of UC patients [32].
In conclusion, the present findings provide a thorough morphological and quantitative analysis showing changes in myenteric neurons, glial cells and ICC in the left colon of patients with UC. Because these cells play critical roles in the regulation of colonic functions, including motility, our data on enteric neuronal-glia-ICC network abnormalities shed light on the mechanisms underlying gut dysfunctions observed in the subset of UC patients with long-lasting chronic disease.
Acknowledgments
This study was supported in part by funds raised from the Interdepartmental Centre for Research in Clinical Pharmacology and Experimental Therapeutics, University of Pisa. R.D.G. was supported by grants from the Italian Ministry of University and Research (COFIN project 2007EN8F7T_005) and R.F.O. funds from the University of Bologna. R.D.G. was a recipient of grants from the ‘Fondazione Del Monte di Bologna e Ravenna’ and the ‘Fondazione Cassa di Risparmio di Bologna’ (Bologna, Italy). The authors are indebted to Professor Jan Huizinga, McMaster University, Hamilton, Canada, for his critical reading and insightful comments on the manuscript.
Conflict of interest
The authors declare that they have no conflict of interest.
Supporting Information
Scatter plots of HuC/D+ neuron(•: filled circles) and S100β+ glial cell(○: open circles) counts versus the respective ganglionic areas estimated in each double-immunostained cross-section (5 sections/patient) of left colon in control patients (from 1 to 10) and UC patients (from 11 to 20); nc: no correlation.
Scatter plots of HuC/D+ neurons andS100β+ glial cells in control patients (•:filled circles) and UC patients (○: open circles)versus the respective ganglionic areas estimated cumulatively in five double immunostained cross-sections of left colon from each patient.
Correlation analysis and linear regression testfor HuC/D and S100β cell counts versus myenteric ganglionic areas of left colonic samples in control subjects (C) and UC patients (UC)
References
- 1.Quigley EMM. What we have learned about colonic motility: normal and disturbed. Curr Opin Gastroenterol. 2010;26:53–60. doi: 10.1097/MOG.0b013e328332c977. [DOI] [PubMed] [Google Scholar]
- 2.Reddy SN, Bazzocchi G, Chan S, et al. Colonic motility and transit in health and ulcerative colitis. Gastroenterology. 1991;101:1289–97. doi: 10.1016/0016-5085(91)90079-z. [DOI] [PubMed] [Google Scholar]
- 3.Wood JD. Enteric Nervous System: reflex, pattern generators and motility. Curr Opin Gastroenterol. 2008;24:149–58. doi: 10.1097/MOG.0b013e3282f56125. [DOI] [PubMed] [Google Scholar]
- 4.Bassotti G, Villanacci V, Mazzocchi A, et al. Colonic propulsive and postprandial motor activity in patients with ulcerative colitis in remission. Eur J Gastroenterol Hepatol. 2006;18:507–10. doi: 10.1097/00042737-200605000-00008. [DOI] [PubMed] [Google Scholar]
- 5.De Giorgio R, Barbara G, Furness JB, et al. Novel therapeutic targets for enteric nervous system disorders. Trends Pharmacol Sci. 2007;28:473–81. doi: 10.1016/j.tips.2007.08.003. [DOI] [PubMed] [Google Scholar]
- 6.Furness JB. The enteric nervous system. 1st ed. Oxford: Blackwell; 2006. [Google Scholar]
- 7.Schemann M, Neunlist M. The human nervous system. Neurogastroenterol Motil. 2004;1:55–9. doi: 10.1111/j.1743-3150.2004.00476.x. [DOI] [PubMed] [Google Scholar]
- 8.Rumessen JJ. Ultrastructure of interstitial cell of Cajal at the colonic submuscular border in patients with ulcerative colitis. Gastroenterology. 1996;111:1447–55. doi: 10.1016/s0016-5085(96)70005-7. [DOI] [PubMed] [Google Scholar]
- 9.Knowles CH, De Giorgio R, Kapur RP, et al. Gastrointestinal neuromuscular pathology: guidelines for histological techniques and reporting on behalf of the Gastro 2009 International Working Group. Acta Neuropathol. 2009;118:271–301. doi: 10.1007/s00401-009-0527-y. [DOI] [PubMed] [Google Scholar]
- 10.Knowles CH, De Giorgio R, Kapur RP, et al. The London classification of gastrointestinal neuromuscular pathology: report on behalf of the Gastro 2009 International Working Group. Gut. 2010:882–7. doi: 10.1136/gut.2009.200444. [DOI] [PubMed] [Google Scholar]
- 11.Sanders KM, Ward SM. Interstitial cells of Cajal: a new perspective on smooth muscle function. J Physiol. 2006;576:721–6. doi: 10.1113/jphysiol.2006.115279. [DOI] [PMC free article] [PubMed] [Google Scholar]
- 12.Ippolito C, Segnani C, De Giorgio R, et al. Quantitative evaluation of myenteric ganglion cells in normal human left colon: implications for histopathological analysis. Cell Tissue Res. 2009;336:191–201. doi: 10.1007/s00441-009-0770-5. [DOI] [PubMed] [Google Scholar]
- 13.Geboes K, Collins S. Structural abnormalities of the nervous system in Crohn’s disease and ulcerative colitis. Neurogastroenterol Motil. 1998;10:189–202. doi: 10.1046/j.1365-2982.1998.00102.x. [DOI] [PubMed] [Google Scholar]
- 14.Ohlsson B, Veress B, Lindgren S, et al. Enteric ganglioneuritis and abnormal interstitial cells of Cajal: features of inflammatory bowel disease. Inflamm Bowel Dis. 2007;13:721–6. doi: 10.1002/ibd.20095. [DOI] [PubMed] [Google Scholar]
- 15.Bettolli M, De Carli C, Jolin-Dahel K, et al. Colonic dysmotility in post surgical patients with Hirschsprung’s disease. Potential significance of abnormalities in the interstitial cells of Cajal and the enteric nervous system. J Pediatr Surg. 2008;43:143–8. doi: 10.1016/j.jpedsurg.2007.10.067. [DOI] [PubMed] [Google Scholar]
- 16.Faussone-Pellegrini MS, Pantalone D, Cortesini C. Smooth muscle cells, interstitial cells of Cajal and myenteric plexus interrelationships in the human colon. Acta Anat. 1990;139:31–44. doi: 10.1159/000146975. [DOI] [PubMed] [Google Scholar]
- 17.Di Nardo G, Blandizzi C, Volta U, et al. Review article: molecular, pathological and therapeutic features of human enteric neuropathies. Aliment Pharmacol Ther. 2008;28:25–42. doi: 10.1111/j.1365-2036.2008.03707.x. [DOI] [PubMed] [Google Scholar]
- 18.Villanacci V, Bassotti G, Nascimbeni R, et al. Enteric nervous system abnormalities in inflammatory bowel diseases. Neurogastroenterol Motil. 2008;20:1009–16. doi: 10.1111/j.1365-2982.2008.01146.x. [DOI] [PubMed] [Google Scholar]
- 19.Cornet A, Savidge TC, Cabarrocas J, et al. Enterocolitis induced by autoimmune targeting of enteric glial cells: a possible mechanism in Crohn’s disease. PNAS. 2001;98:13306–11. doi: 10.1073/pnas.231474098. [DOI] [PMC free article] [PubMed] [Google Scholar]
- 20.De Giorgio R, Bovara M, Barbara G, et al. Anti-HuD-induced neuronal apoptosis underlying paraneoplastic gut dismotility. Gastroenterology. 2003;125:70–9. doi: 10.1016/s0016-5085(03)00664-4. [DOI] [PubMed] [Google Scholar]
- 21.Ganns D, Schrödl F, Neuhuber W, et al. Investigation of general and cytoskeletal markers to estimate numbers and proportions of neurons in the human intestine. Histol Histopathol. 2006;21:41–51. doi: 10.14670/HH-21.41. [DOI] [PubMed] [Google Scholar]
- 22.Murphy EMA, Defontgalland D, Costa M, et al. Quantification of subclasses of human colonic myenteric neurons by immunoreactivity to Hu, choline acetyltransferase and nitric oxide synthase. Neurogastroenterol Motil. 2007;19:126–34. doi: 10.1111/j.1365-2982.2006.00843.x. [DOI] [PubMed] [Google Scholar]
- 23.Phillips RJ, Kieffer EJ, Powley TL. Loss of glia and neurons in the myenteric plexus of the aged Fisher 344 rat. Anat Embryol. 2004;209:19–30. doi: 10.1007/s00429-004-0426-x. [DOI] [PubMed] [Google Scholar]
- 24.Phillips RJ, Hargrave SL, Rhodes BS, et al. Quantification of neurons in the myenteric plexus: an evaluation of putative pan-neuronal markers. J Neurosci Methods. 2004;133:99–107. doi: 10.1016/j.jneumeth.2003.10.004. [DOI] [PubMed] [Google Scholar]
- 25.Hoff S, Zeller F, von Weyhern CW, et al. Quantitative assessment of glial cells in the human and guinea pig enteric nervous system with an anti-Sox8/9/10 antibody. J Comp Neurol. 2008;509:356–71. doi: 10.1002/cne.21769. [DOI] [PubMed] [Google Scholar]
- 26.Wedel T, Spiegler J, Soellner S, et al. Enteric nerves and interstitial cells of Cajal are altered in patients with slow-transit constipation and megacolon. Gastroenterology. 2002;123:1459–67. doi: 10.1053/gast.2002.36600. [DOI] [PubMed] [Google Scholar]
- 27.Wedel T, Büsing V, Heinrichs G, et al. Diverticular disease is associated with an enteric neuropathy as revealed by morphometric analysis. Neurogastroenterol Motil. 2010;22:407–e94. doi: 10.1111/j.1365-2982.2009.01445.x. [DOI] [PubMed] [Google Scholar]
- 28.Neunlist M, Aubert P, Toquet C, et al. Changes in chemical coding of myenteric neurons in ulcerative colitis. Gut. 2003;52:84–90. doi: 10.1136/gut.52.1.84. [DOI] [PMC free article] [PubMed] [Google Scholar]
- 29.Linden DR, Couvrette JM, Ciolino A, et al. Indiscriminate loss of myenteric neurones in the TNBS-inflamed guinea-pig distal colon. Neurogastroenterol Motil. 2005;17:751–60. doi: 10.1111/j.1365-2982.2005.00703.x. [DOI] [PubMed] [Google Scholar]
- 30.Streutker CJ, Huizinga JD, Driman DK, et al. Interstitial cells of Cajal in health and disease. Part I: normal ICC structure and function with associated motility disorders. Histopathology. 2007;50:176–89. doi: 10.1111/j.1365-2559.2006.02493.x. [DOI] [PubMed] [Google Scholar]
- 31.Zarate N, Wang XY, Tougas G, et al. Intramuscular interstitial cells of Cajal associated with mast cells survive nitrergic nerves in achalasia. Neurogastroenterol Motil. 2006;18:556–68. doi: 10.1111/j.1365-2982.2006.00788.x. [DOI] [PubMed] [Google Scholar]
- 32.Stoyanova II, Gulubova MV. Mast cells and inflammatory mediators in chronic ulcerative colitis. Acta Histochem. 2002;104:185–92. doi: 10.1078/0065-1281-00641. [DOI] [PubMed] [Google Scholar]
- 33.Mikkelsen HB. Interstitial cells of Cajal, macrophages and mast cells in the gut musculature: morphology, distribution, spatial and possible functional interactions. J Cell Mol Med. 2010;14:818–32. doi: 10.1111/j.1582-4934.2010.01025.x. [DOI] [PMC free article] [PubMed] [Google Scholar]
- 34.Sand E, Themner-Persson A, Ekblad E. Mast cells reduce survival of myenteric neurons in culture. Neuropharmacology. 2009;56:522–30. doi: 10.1016/j.neuropharm.2008.10.007. [DOI] [PubMed] [Google Scholar]
- 35.Nishiyama H, Knöpfel T, Endo S, et al. Glial protein S100B modulates long-term neuronal synaptic plasticity. Proc Natl Acad Sci USA. 2002;99:4037–42. doi: 10.1073/pnas.052020999. [DOI] [PMC free article] [PubMed] [Google Scholar]
- 36.M-C Struijs, Diamond IR, Pencharz PB, et al. Absence of the interstitial cells of Cajal in a child with chronic pseudoobstruction. J Pediatr Surg. 2008;43:E25–9. doi: 10.1016/j.jpedsurg.2008.09.017. [DOI] [PubMed] [Google Scholar]
Associated Data
This section collects any data citations, data availability statements, or supplementary materials included in this article.
Supplementary Materials
Scatter plots of HuC/D+ neuron(•: filled circles) and S100β+ glial cell(○: open circles) counts versus the respective ganglionic areas estimated in each double-immunostained cross-section (5 sections/patient) of left colon in control patients (from 1 to 10) and UC patients (from 11 to 20); nc: no correlation.
Scatter plots of HuC/D+ neurons andS100β+ glial cells in control patients (•:filled circles) and UC patients (○: open circles)versus the respective ganglionic areas estimated cumulatively in five double immunostained cross-sections of left colon from each patient.
Correlation analysis and linear regression testfor HuC/D and S100β cell counts versus myenteric ganglionic areas of left colonic samples in control subjects (C) and UC patients (UC)