

Abstract
Early detection of resistance to platinum-based therapy is critical for improving the treatment of ovarian cancers. We have previously found that increased expression of annexin A3 is a mechanism for platinum resistance in ovarian cancer cells. Here we demonstrate that annexin A3 can be detected in the culture medium of ovarian cancer cells, particularly these cells that express high levels of annexin A3. Levels of annexin A3 were then determined in sera from ovarian cancer patients using an enzyme-linked immunosorbent assay. Compared with those from normal donors, sera from ovarian cancer patients contain significantly higher levels of annexin A3. Furthermore, serum levels of annexin A3 were significantly higher in platinum-resistant patients than in platinum-sensitive patients. To gain insight into the mechanism of secretion, the ovarian cancer cell lines were examined using both transmission electron microscopy and immunoelectron microscopy. Compared with parent cells, there are significantly more vesicles in the cytoplasm of ovarian cancer cells that express high levels of annexin A3, and at least some vesicles are annexin A3-positive. Moreover, some vesicles appear to be fused with the cell membrane, suggesting that annexin A3 secretion may be associated with exocytosis and the release of exosomes. This is supported by our observation that ovarian cancer cells expressing higher levels of annexin A3 released increased numbers of exosomes. Furthermore, annexin A3 can be detected in exosomes released from cisplatin-resistant cells (SKOV3/Cis) by immunoblotting and immunoelectron microscopy.
Keywords: annexin A3, ovarian cancer, platinum, drug resistance, biomarker
Introduction
Ovarian cancer is the leading cause of gynaecological cancer mortality. Its treatment usually consists of optimal cytoreductive surgery and platinum-based combination chemotherapies. Although the platinum compounds cisplatin and carboplatin are among the most effective anticancer drugs, development of resistance to the platinum-based therapies has emerged as a major obstacle in the treatment of ovarian cancers. As a result, the 5-year survival rate for advanced ovarian cancer (stages III and IV) is only about 20–30%[1]. It has become apparent that early detection of drug resistance and prompt adjustment of the chemotherapy regimen are critically important for improving the outcome of ovarian cancer treatment.
There have been extensive studies on the mechanisms of platinum resistance in ovarian cancers. A number of genes, including GST-pi, LRP, MDR1, XIAP, HER2/neu, hMLH2 and hMSH1 have been found associated with platinum resistance in ovarian cancer cells [2–6]. However, it is still not well understood whether and how these genes can confer specific resistance to the platinum drugs. It also remains to be determined whether any of the associated gene products can be used as biomarkers for the early detection of platinum resistance in ovarian cancer patients. Through proteomic analysis, we have found that the expression of a number of proteins, including annexin A3, destrin, cofilin 1, glutathione-S-transferase omega 1 and cytosolic NADP+-dependent isocitrate dehydrogenase, are significantly altered in platinum-resistant ovarian cancer cells [7]. Further studies demonstrated that the expression of annexin A3 is also significantly increased in tumours from platinum-resistant ovarian cancer patients [8]. Moreover, enforced expression of annexin A3 specifically conferred platinum resistance to ovarian cancer cells both in culture and in an animal model, whereas down-regulation of annexin A3 in the platinum-resistant ovarian cancer cells made them more sensitive to cisplatin [8]. These results indicated that increased annexin A3 plays a critical role in platinum resistance and raised the possibility that it could be a biomarker for resistance to platinum-based therapies in ovarian cancer patients.
Annexins are a family of Ca2+ and phospholipid-binding proteins that are ubiquitously expressed in various cells. The 12 human and vertebrate annexins are catalogued into group A of the family and designed A1–A13 [9]. They all contain a conserved ∼70 amino acid residue annexin repeat that is responsible for Ca2+ and phospholipids binding. A number of studies have shown that annexins are able to induce the generation of an inward vesicle, a formation of lipid domains and intermembrane contact, which participates cellular processes such as membrane-cytoskeleton organization, membrane trafficking, endocytosis, exocytosis and cytokinesis [10]. These activities appear to be responsible for the diversified functions of annexins, which include mediating the anti-inflammation action of glucocorticoids, participating in the regulation of blood coagulation and modulating ion channel transportation [11]. In addition, the ability of annexin A5 to bind phosphatidylserine also makes it a valuable tool to detect apoptotic cells [12]. However, there are relatively few studies on the functions of annexin A3, the 36-kD protein expressed in the cytoplasm of many cells [13].
In this study, we demonstrate that annexin A3 is secreted from ovarian cancer cells. The amount of secretion is associated with the level of intracellular annexin A3 and platinum resistance. Both electron microscopy studies and biochemical analysis indicated that the secretion is associated with exocytosis and the release of exosomes. We also found that the level of annexin A3 in sera from platinum-resistant ovarian cancer patients is significantly higher than that of normal donors as well as that of platinum-sensitive ovarian cancer patients, indicating that annexin A3 may serve as a potential biomarker for ovarian cancer and platinum resistance.
Materials and methods
Cell lines and culture conditions
Drug-sensitive epithelial ovarian cancer cell lines (SKOV3 and A2780), their cisplatin-resistant derivatives (SKOV3/Cis and A2780/Cis) and the cell lines transfected with control plasmid (SKOV3/m, A2780/m, SKOV3/Cis/m and A2780/Cis/m), an annexin A3-expressing vector (SKOV3/Ann and A2780/Ann) or an antisense annexin A3-expressing vector (SKOV3/Cis/R and A2780/Cis/R) were described previously [8]. The vectors were constructed by inserting PCR-generated annexin A3 cDNA into the EcoR I site of pcDNA3.1. Their orientations were determined by direct sequencing. The primers used for generating annexin A3 cDNA are 5’-GAATTCCATCATGGCATCTATCTGGGTT-3’ (sense) and 5’-GAATTCGTCATCTCCACCACAGA-3’) (antisense). The cells were maintained in DMEM (high-glucose) supplemented with 10% foetal bovine serum (FBS).
Immunoblotting
Immunoblotting was performed as described [14]. Briefly, cells were lysed with RIPA buffer and protein concentrations were determined using a BCA kit (Thermo Fisher Scientific, WI, USA). Following SDS-PAGE, proteins were transferred onto PVDF membrane, probed with specific antibodies (anti-annexin A3 1:1000, anti-Hsp70 1:1000 and anti-β-actin 1:1000), and visualized with horseradish peroxidase-conjugated secondary antibody and chemiluminescence (Thermo Fisher Scientific). Anti-annexin A3 antibody was kindly provided by Dr. Joel D. Ernst (University of California, San Francisco, CA, USA). Anti-Hsp 70 and anti-β-actin antibodies were from Sigma-Aldrich (H5147 and A5316, respectively).
Detection of extracellular annexin A3
Cells (1.5 × 10⁶) seeded in 100-mm culture dish were cultured with complete DMEM overnight and then with 10 ml DMEM without 10% FBS for 48 hrs. The 10 ml of conditional medium was collected and concentrated to 200 μl with an Amicon Ultra-15 centrifugal filter (Millipore, MA, USA). Equal amounts of concentrated conditional medium from different ovarian cancer cell lines were analysed by anti-annexin A3 immunoblotting. Another aliquote of conditional medium was collected without concentration, and annexin A3 expression was measured using a human annexin A3 ELISA kit (Cusabio, Wuhan, China).
Ovarian cancer patients and serum samples
Fifty ovarian cancer patients who were diagnosed with epithelial ovarian cancers between January 2007 and September 2007 at Peking Union Medical College Hospital, were enrolled in this study, which was reviewed and approved by the Ethics Committee of Peking Union Medical College Hospital. All clinical diagnoses were confirmed by a pathology examination. Blood samples were collected with consensus from these patients before they received cytoreductive surgery and/or standard platinum-based chemotherapies. All patients enrolled underwent cytoreductive surgeries that left no tumour tissues with >2 cm diameters and therefore were defined as optimal cytoreduction according to the guideline of National Comprehensive Cancer Network and our hospital. Among them, 14 patients received their second cytoreductive surgery 11–24 months after the last chemotherapy. These patients were followed regularly for more than 1 year after completion of their chemotherapies to determine whether they were sensitive or resistant to platinum-based chemotherapies according to the commonly used clinical definition [15]. Blood samples were also collected from 30 normal female donors during the same period. Sera from these blood samples were aliquoted in 1.5- or 0.5-ml amber vials and stored under −25°C for a maximum of a week before long-term storage at −80°C.
ELISA
The level of annexin A3 in sera of ovarian cancer patients was determined using the ELISA kit for human annexin A3 (Cusabio) according to the manufacturer’s instructions. Each sample was assessed in triplicate.
Transmission electron microscopy (TEM)
Cells were fixed and processed as described [16]. Briefly, after treatment with 1% osmium tetroxide for 1 hr at 4°C, samples were dehydrated in ascending grades of ethanol and embedded in spur resin. Following overnight polymerization, ultrathin sections (70–80 nm) were made using an ultramicrotome. The sections were laid on copper grids, stained with uranyl acetate and lead citrate, and examined under the transmission electron microscope (JEOLTEM 1010, JEOL, Japan). Exosomes on grids were fixed in 1% glutaraldehyde and negatively stained with 1% uranyl acetate before examining with TEM.
Immunoelectron microscopy (IEM)
IEM was performed as described with a few modifications [17–18]. Briefly, cells were fixed with 4% paraformaldehyde and 1% glutaral in 0.1 M phosphate buffer at 4°C for 4 hrs. After embedding in L.R. White, ultrathin sections (70–80 nm) were cut and laid on nickel formvar-carbon filmed grids. Following incubation with the rabbit anti-annexin A3 antibody (1:100) and 12-nm colloid gold-labelled donkey anti-rabbit antibody (1:50) sequentially, the grids were stained with ammonium molybdate-trehalose and examined with the transmission electron microscope (JEOLTEM 1010, JEOL).
Exosome purification
Cells (1×10⁷) were cultured with DMEM without FBS for 24 hrs to avoid potential contamination of exosomes from serum-derived products [19]. For purification of exosomes, 60 ml of culture medium was cleared by centrifugation at 1000 ×g for 10 min. and concentrated to ∼1.5 ml using a Centricon Plus-20 filter capsule (Millipore). It was then transferred onto the top of 30% sucrose-deuterium oxide (D2O) and ultracentrifuged at 100,000 ×g for 40 min. at 4°C. The exosome layer was collected, washed and resuspended with phosphate buffer saline (PBS) for further experiments. Quantities of exosomes were expressed as total amount of protein in the exosome preparation from one million cells (μg/106 cells). For IEM, fresh exosomes were adsorbed to glow-discharged 400-mesh carbon-coated parlodion copper grids (Pella) for 2 min., rinsed briefly with PBS, and incubated sequentially with anti-annexin A3 and gold-labelled secondary antibody.
Statistical analysis
Data were analysed using the SPSS 12.0 statistical software package. Continuous variables were examined with a Student’s t-test. A Mann–Whitney U-test was used to analyse clinical data and ELISA results. Differences between groups were considered to be significant when P < 0.05. The reported P values were two tailed. A scatter plot of annexin A3 expression in serum was drawn using Graphpad Prism 5.0.1 software. A survival curve was used to describe the association between annexin A3 and progress-free time.
Results
Release of annexin A3 from cultured ovarian cancer cells
Although annexins do not contain a signal sequence for protein secretion [20], some family members, including A1, A2, A3 and A6, have been found outside cells under many circumstances [21–23]. Therefore, we asked whether increased expression of annexin A3 in ovarian cancer cells can lead to their secretion to culture medium. Compared with those from parent SKOV3 and A2780 cells, concentrated supernatants from platinum-resistant cells SKOV3/Cis and A2780/Cis contained significantly higher levels of annexin A3 (Fig. 1). Supernatants from SKOV3 and A2780 cells transfected with an annexin A3 expressing plasmid also had elevated levels of annexin A3 (Fig. 1A and B). Furthermore, down-regulation of annexin A3 in SKOV3/Cis and A2780/Cis with antisense annexin A3 significantly decreased the amount of annexin A3 in the medium (Fig. 1A and B). These results indicate that annexin A3 can be secreted into culture medium and the secretion is significantly increased in cells that express elevated levels of cytoplasmic annexin A3.
Fig 1 (A).
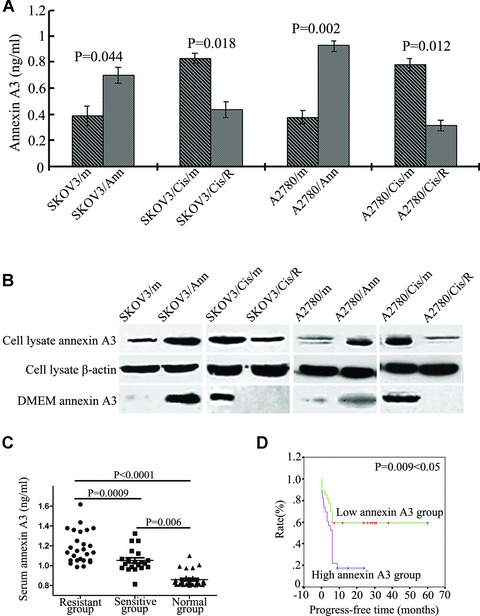
Annexin A3 levels in the conditional culture medium from the ovarian cancer cells were measured by ELISA. (B) Proteins from the ovarian cancer cell lysates and concentrated culture media were analysed by anti-annexin A3 immunoblotting. Enforced expression of annexin A3 in SKOV3 and A2780 cells resulted in the increased secretion of annexin A3 in the culture medium. Down-regulation of annexin A3 in platinum-resistant ovarian cancer cells SKOV3/Cis andA2780/Cis, which express high levels of annexin A3, reduced the secretion of annexin A3. (C) Annexin A3 levels in sera from the 30 normal female donors and the 50 ovarian cancer patients were determined by ELISA [particular high levels of annexin A3 (2.0461, 3.4453, 8.8125 and 18.3081 ng/ml, respectively) cannot be seen in the graph because the Y-axis range is 2.0 ng/ml]. The patients are divided into platinum-sensitive (n= 20) and resistant (n= 30) groups based on clinical data. There are significant differences in the serum levels of annexin A3 among normal donors, the sensitive group and the resistant group. Data were analysed with a Mann–Whitney U-Test. P values were all two-sided. (D) Progress-free times of the 50 ovarian cancer patients. There is a significant difference between the high annexin A3 group (serum A3 > 1.13 ng/ml) and the low annexin A3 group (serum A3 < 1.13 ng/ml) (P= 0.009 < 0.05).
Expressions of annexin A3 in sera from ovarian cancer patients
The role of annexin A3 in platinum resistance and its secretion by ovarian cancer cells led us to ask whether it can be detected in the sera of normal donors and patients with ovarian cancers. Using a commercially available ELISA kit, we first examined annexin A3 in sera from 30 normal female donors. As shown in Table 1, the average level of annexin A3 in these sera is 0.8590 ng/ml, with a relatively small variation among different individuals (S.D. = 0.0744 ng/ml), which is close to the standard deviation of assessing the same samples in triplicates. The levels of annexin A3 in the sera from 50 ovarian cancer patients enrolled in our hospital were also assessed. Compared with that of normal donors, the average annexin A3 level in sera from ovarian cancers is significantly elevated (1.6898 ng/ml) (Table 1). However, there are quite large variations among individual patients (S.D. = 2.6563 ng/ml).
Table 1.
Annexin A3 levels in sera from ovarian cancer patients and normal female donors
| Group | N | Annexin A3 (ng/ml) | Frequency of annexin A3 >listed (ng/ml; n/N) | ||||||||||||||||||||
|---|---|---|---|---|---|---|---|---|---|---|---|---|---|---|---|---|---|---|---|---|---|---|---|
| Mean | S.D. | Median | Min. | Max. | Q25 | Q75 | IQR | 1.05 | 1.13 | ||||||||||||||
| Ovarian cancer | 50 | 1.6898 | 2.6563 | 1.1076 | 0.8143 | 18.3081 | 1.0217 | 1.2688 | 0.2471 | 34/50 | 23/50 | ||||||||||||
| Resistant | 30 | 2.1145 | 3.3833 | 1.1735 | 0.9869 | 18.3081 | 1.0523 | 1.3783 | 0.3260 | 26/30 | 19/30 | ||||||||||||
| Sensitive | 20 | 1.0528 | 0.1178 | 1.0293 | 0.8143 | 1.3226 | 0.9795 | 1.1085 | 0.1289 | 8/20 | 4/20 | ||||||||||||
| Normal donors | 30 | 0.8590 | 0.0744 | 0.8295 | 0.7997 | 1.0996 | 0.8123 | 0.8686 | 0.0564 | ND* | ND | ||||||||||||
Sensitivity was expressed as the fraction of the group with annexin A3 concentrations greater than specified by the column heading.
Not detected.
The characteristics of the 50 patients are shown in Table 2. Twenty of the patients are clinically defined as platinum-sensitive as they responded to initial platinum-based therapy and experienced a progress-free interval of more than 6 months [15], whereas the other 30 patients are classified as platinum resistant. There are no significant differences in all the characteristics between the sensitive and resistant groups. However, the average levels of annexin A3 in the resistant and sensitive group are 2.1145 ± 3.3833 and 1.0528 ± 0.1178 ng/ml, respectively, which are statistically significant (P= 0.0009). There is also a significant difference between the levels of annexin A3 in the sera from platinum-sensitive patients and that of normal donors (P= 0.006).
Table 2.
Clinical and pathological characteristics of the 50 ovarian cancer patients
| Characteristic | Patients | P value | ||
|---|---|---|---|---|
| Sensitive (20 patients) | Resistant (30 patients) | |||
| Age | ||||
| 60 years | 11(55%) | 17(56.7%) | ||
| ≥60 years | 9(45%) | 13(43.3%) | 0.349 | |
| Pathological type | ||||
| Serous cystadenocarcinoma | 14(70%) | 21(70%) | ||
| Endometrioid carcinoma | 3(15%) | 3(10%) | ||
| Clear cell carcinoma | 2(10%) | 3(10%) | ||
| Transitional cell carcinoma | 0(0%) | 1(3.3%) | ||
| Muller’s capsule epithelial carcinoma | 1(5%) | 2(6.7%) | 0.893 | |
| Pathological stage | ||||
| I /II | 18(90%) | 24(80%) | ||
| III | 2(10%) | 6(20%) | 0.350 | |
| Clinical stage* | ||||
| I /II | 5(25%) | 6(20%) | ||
| III | 13(65%) | 21(70%) | ||
| IV | 2(10%) | 3(10%) | 0.745 | |
| CA125 (U/ml) | ||||
| 35–200 | 3(15%) | 7(23.3%) | ||
| ≥200 | 17(85%) | 23(76.7%) | 0.475 | |
| Chemotherapy regimen | ||||
| Paclitaxel + cisplatin | 10(50%) | 15(50%) | ||
| Paclitaxel + carboplatin | 5(25%) | 8(26.7%) | ||
| Cisplatin + cyclophosphamide | 3(15%) | 2(6.7%) | ||
| Cisplatin + others | 2(10) | 5(16.7%) | 0.949 | |
All patients received a post-operative cisplatin or carboplatin-based combination chemotherapy at least six courses after optimal cytoreductive surgery. They were classified as sensitive (n = 20) or resistant (n = 30) based on clinical definition. P values (two-sided) were calculated using the Mann–Whitney U-test.
According to FIGO stages.
The annexin A3 levels of individual patients are shown in Figure 1C and Table 1. It is worth noting that four cisplatin-resistant patients had particularly high levels of annexin A3 (2.0461, 3.4453, 8.8125 and 18.3081 ng/ml, respectively) (Table 3). They are largely responsible for the considerable variation of annexin A3 levels in ovarian cancer patients. Furthermore, all patients whose serum annexin A3 levels exceeded 1.34 ng/ml were resistant to platinum-based chemotherapy (11 of 30). Among the resistant patients, 19 of 30 had serum annexin A3 level higher than 1.13 ng/ml, whereas only 4 of 20 platinum-sensitive patients had serum annexin A3 level above this level. Analysis of these 50 patients also showed that elevated levels of annexin A3 (over 1.13 ng/ml) are associated with significantly decreased disease-free time [P= 0.009 (<0.05); Fig. 1D]. These results indicate that serum annexin A3 levels may be a prognostic biomarker for resistance to platinum-based chemotherapy in ovarian cancer patients with reasonable sensitivity (63%) and specificity (80%).
Table 3.
Clinical characteristics of the four patients with high-level serum annexin A3 (>2 ng/ml)
| Patients | Age | Pathological type | Pathological stage | Clinical stage* | Annexin A3 (ng/ml) | CA125 (U/ml) | Chemotherapy regimen | PFT (months)† |
|---|---|---|---|---|---|---|---|---|
| 1 | 56 | Clear cell carcinoma | II | I | 2.0461 | 1169 | Paclitaxel + cisplatin | 5 |
| 2 | 61 | Clear cell carcinoma | II | I | 3.4453 | 45.24 | Paclitaxel + cisplatin | 5.5 |
| 3 | 62 | Endometrioid carcinoma | II | III | 8.8125 | 104.6 | Paclitaxel + cisplatin | 5 |
| 4 | 66 | Serous cysatdenocarcinoma | I | III | 18.3081 | 163.6 | Paclitaxel + carboplatin | 1 |
According to FIGO stages.
Progress-free time.
Expression of annexin A3 is associated with the increased cytoplamic vesicles
It has been shown in a variety of cells that annexins can affect vesicle trafficking and exocytosis by promoting membrane fusion [24]. Therefore, we examined the ultrastructure of the ovarian cancer cells using TEM. The cell nucleus, many organelles in cytoplasm, and the cell membrane could be clearly identified under TEM (10,000×). Compared with that of platinum-sensitive SKOV3 and A2780 cells, the cytoplasm of platinum-resistant cells SKOV3/Cis and A2780/Cis contains significantly increased numbers of membrane-bound round or elliptical vesicles, ranging from 0.1 to 1 μm in size. Some of these vesicles contain high-density particles, suggesting that they may be related to phagocytosis or endosomes (Fig. 2A). Under higher magnification (50,000×), it is evident that some of the vesicles look like multivesicular bodies (MVBs) with contents of various densities. Some vesicles can be found fusing with cell membrane (Fig. 2B), indicating that they participate in exocytosis. Interestingly, SKOV3/Ann and A2780/Ann, the ovarian cancer cells that were transfected with an annexin A3-expressing vector, also possess increased numbers of vesicles (Fig. 2C). Furthermore, SKOV3/Cis/R and A2780/Cis/R, the platinum-resistant cell lines that had been transfected with a vector expressing an antisense annexin A3 and had reduced levels of annexin A3, also had fewer vesicles (Fig. 2C, lower). These results demonstrate that increased expression of annexin A3 in the ovarian cancer cells results in the formation of increased numbers of MVBs in the cytoplasm.
Fig 2.
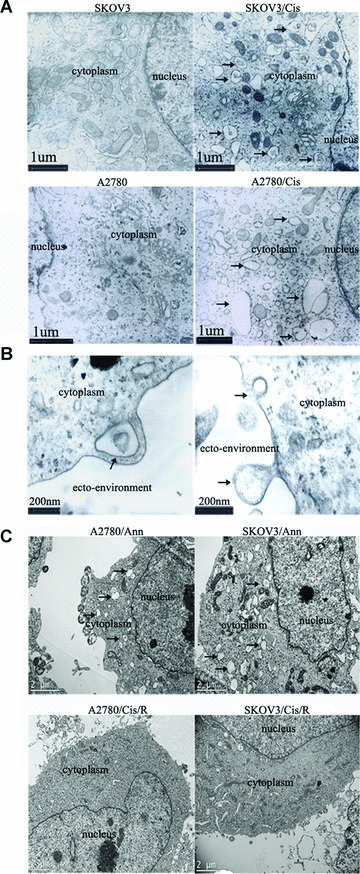
High levels of annexin A3 are associated with increased numbers of vesicles in the cytoplasm. (A) Representative TEM (10,000×) photographs of paired ovarian cancer cell lines SKOV3 and SKOV3/Cis and A2780 and A2780/Cis. The arrows indicate the increased numbers of vesicles in platinum-resistant SKOV3/Cis and A2780/Cis cells. (B) Higher magnification (50,000×) photographs of SKOV3/Cis cells. Arrows indicate the MVB-like vesicle (upper) and exocytosis of a vesicle (lower). (C) Representative TEM (10,000×) photographs of ovarian cancer cell lines. Arrows in the upper panel indicated increased vesicles in annexin A3-expressing A2780/Ann and SKOV3/Ann cells. The lower panels are pictures of A2780/Cis/R and SKOV3/Cis/R cells. The vesicles observed in A2780/Cis and SKOV3/Cis (A) have largely disappeared.
To further explore the association of annexin A3 secretion and the cytoplasmic vesicle, cells were examined by IEM using an anti-annexin A3 antibody and a colloidal gold-labelled secondary antibody. To avoid its potential effect on antibody-recognized epitopes of annexin A3, osmic acid was not used in the staining of cells for electron microscopy. Therefore, the pictures from these studies are lighter and have less contrast compared to regular TEM pictures. Nevertheless, the increased numbers of the vesicles could be identified in SKOV3/Cis cells under this condition (Fig. 3). As shown in Figure 3B, the high-density gold particles that are indicative of annexin A3 were present in the cytoplasmic region of the cells. Particularly, annexin A3 appeared to be highly expressed both around and inside the membrane of the vesicles. Pictures taken under higher magnification showed that some annexin A3-containing vesicles appear to be fusing with cell membranes (Fig. 3C and 3D), indicating that annexin A3 might be secreted through exocytosis.
Fig 3.
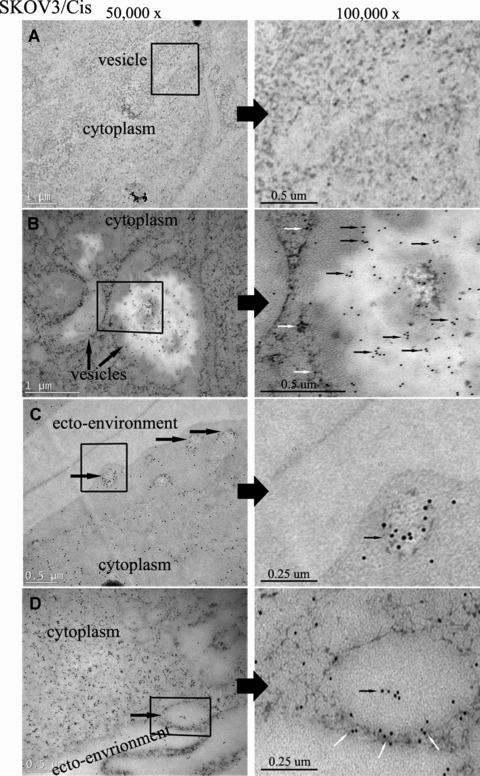
Immunoelectron microscopy studies of annexin A3 in platinum-resistant ovarian cancer cell SKOV3/Cis. Cell preparation and treatment are described in Materials and Methods. Ultrathin sections were examined by transmission electron microscopy (left, 50,000×; right, 100,000×). The high-density 12-nm colloidal gold particles, which are indicative of annexin A3, could be observed in the cytoplasm of the cells (small arrows). Some gold particles existed in or around vesicles (medium arrows). (A) Control (sections were treated as described without anti-annexin A3 antibody). (B) Annexin A3 expression in cytoplasm. (C, D) Annexin A3 expression in cytoplamic vesicles. The vesicle in C appears ready to undergo exocytosis.
The similarity of the vesicles in platinum-resistant cells and MVBs prompted us to ask whether the secreted annexin A3 is associated with exosomes, which are 40–100 nm vesicles that resided inside MVBs and are released from cells upon the fusion of MVBs with the cell membrane. Exosomes isolated from the culture supernatant of SKOV3/Cis cells were in the range of 40–100 nm in diameter and exhibited the typical cup-shaped morphology (Fig. 4A). IEM with anti-annexin A3 antibody and gold-coupled secondary antibody demonstrated that annexin A3 is associated with these exosomes (Fig. 4B and C). However, because of the size of the gold particle (12 nm), it is difficult to determine whether annexin A3 is associated with the exosome membrane. The association of annexin A3 with these exosomes was further examined by anti-annexin A3 immunoblotting. As shown in Figure 4D, exosomes from SKOV3 cells contain both annexin A3 and the characteristic hsp70. These results indicate that at least some annexin A3 is secreted through exocytosis inside the exosomes. The amount of exosomes released from various ovarian cancer cells was further assessed by measuring total protein in exosome preparations. As shown in Figure 5A, enforced expression of annexin A3 significantly increased the amount of exosome released, whereas down-regulation of annexin A3 in platinum-resistant cells reduced exosome release significantly. The same phenomenon was observed when exosome preparations were analysed by immunoblotting with anti-hsp70 and annexin A3 antibodies (Fig. 5B).
Fig 4.
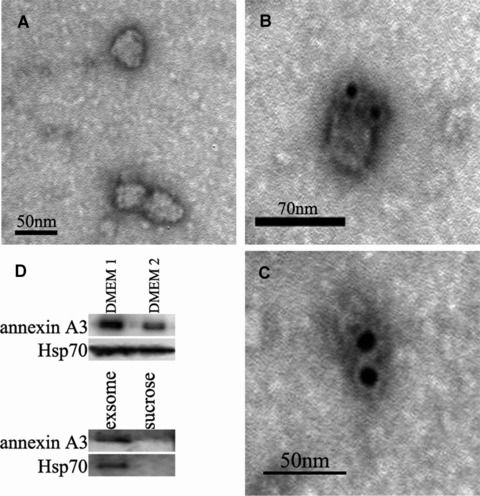
Annexin A3 is associated with exosomes from ovarian cancer cells SKOV3/Cis. (A) Electron microscopic picture of exosomes from SKOV3/Cis cells. The exosomes are 40–100 nm in diameter and exhibit the typical cup-shaped morphology. (B, C) IEM photographs of exosomes from SKOV3/Cis cells. The high-density dots represent 12-nm gold particles, which are indicatives of annexin A3. (D) Conditional medium (30 ml) from cultured SKOV3/Cis cells was collected, and divided into two parts. After removing the exosomes from one of them (DMEM 2), both were concentrated and analysed by immunobltting with anti-annexin A3 and anti-Hsp70 antibodies. The exosome preparation and the upper sucrose were also examined by the immunoblotting.
Fig 5.
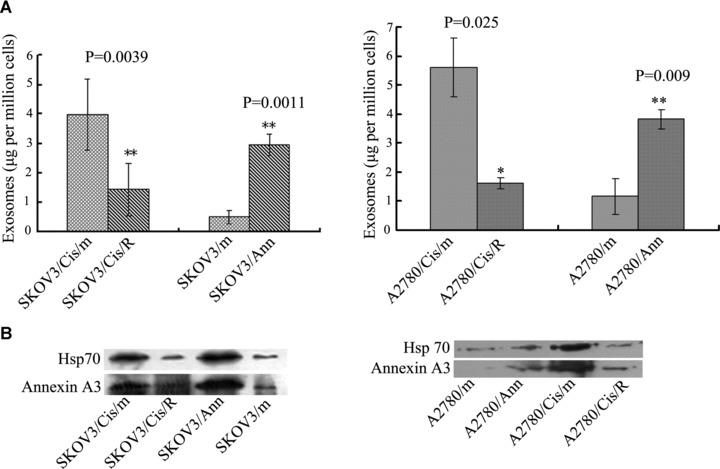
The amount of exosomes released by the ovarian cancer cells depends on the expression of annexin A3. (A) Exosomes were isolated from conditioned medium of cultured ovarian cancer cells. The total amount of protein was used to quantify recovered exosomes. (B) Comparison of the amounts of exosomes released from various ovarian cancer cells by immunobltting with anti-annexin A3 and anti-Hsp70 antibodies.
Discussion
We have found in this study that annexin A3 can be secreted from ovarian cancer cells. Up-regulation of annexin A3 in these cells leads to a significant increase in its secretion, whereas down-regulation of annexin A3 results in its reduction in culture medium. This is consistent with the observation that annexin A3 can be detected in urine from prostate cancer patients [22]. Examination of these ovarian cancer cells using TEM and IEM revealed that increased expression of annexin A3 results in the formation of MVBs-like vesicles. At least some of the vesicles contain annexin A3 and appear to fuse with the cell membrane. It was also found that annexin A3 is associated with exosomes released from platinum-resistant ovarian cancer cells. Because MVBs often contain exosomes that can be released through exocytosis [25], these results led us to propose that annexin A3 promotes the formation of MVBs that are secreted with exosomes upon fusion of the MVBs with the cell membrane. It is worth noting that other annexins, such as A1, A2 and A6 have also been found to be secreted through nonclassical pathways [23, 26–27]. Furthermore, it has been shown that annexin A2 is associated with MVBs in enterocytes [26], suggesting that exocytosis of MVBs might be a common mechanism for annexin secretion. This has been further supported by the finding that annexins are components of exosomes from a variety of cells [28].
We also examined the levels of annexin A3 in sera from 30 normal female donors and 50 ovarian cancer patients by ELISA. Compared to that of normal donors, there is a significant increase of annexin A3 in sera from ovarian cancer patients. Furthermore, the concentration of annexin A3 in sera from platinum-resistant patients is significantly higher than that of platinum-sensitive patients. Ovarian cancer patients with higher levels of serum annexin A3 also have a significantly shorter progress-free time. These results indicate that annexin A3 may be a biomarker for ovarian cancer and a prognostic marker for platinum resistance. Consistent with our observation, increased annexin A3 immunostaining has been found in approximately two-thirds of colorectal cancer patients [29], in lung adenocarcinoma with lymph node metastasis [30] and in prostate tumours [31]. In particularly, platinum drugs are also commonly used in the treatment of patients with lung cancer. It could be very informative to further assess the serum annexin A3 levels in these patients before, during, and after chemotherapies. Interestingly, a number of patients enrolled in our study had particularly high levels of serum annexin A3. It is conceivable that, by assessing the level of annexin A3 in a significantly larger group of patients, we may be able to associate the high serum A3 level with a particular pathological type, stage and size of ovarian cancer. To further examine the prognostic role of annexin A3, we are also planning to compare serum annexin A3 levels in ovarian cancer patients before, during and after cytoreductive surgery and chemotherapy. It is also worth noting that some of the platinum-resistant patients do not have increased serum A3 levels. This may reflect the notion that drug resistance in ovarian cancer can result from abnormal pharmacokinetics and tumour microenvironments [32]. Because we have shown previously that annexin A3 specifically confers resistance to the platinum compounds [8], it is also conceivable that the insensitivity to platinum-based chemotherapy in some patients is because of resistance to other agents such as paclitaxel [33, 34].
Two recent studies have found that, when compared with other types of ovarian cancer, annexin A4 is up-regulated in ovarian clear cell carcinomas and is associated with platinum resistance [35, 36]. Given the structural and functional similarities among the annexin family members, it is conceivable that annexins A3 and A4 may act through similar mechanisms in ovarian cancer cells. We are also interested in examining the expression of additional annexins in various types of ovarian cancers. It has been reported that annexin A3 in urine detected by immunoblotting is a highly specific marker for early detection of prostate cancer [22]. Given the increased serum annexin A3 level, we are interested in examining annexin A3 in urine from ovarian cancer patients in the future. In addition to the 36-kD annexin A3 that we investigated in this study, a 33-kD alternatively spliced form of annexin A3 has been found in primary cell cultures from renal cell carcinoma and normal renal cortex tissue [37]. Intriguingly, although 36-kD isoform was down-regulated in renal cell carcinoma, the 33-kD isoform was up-regulated in these tumour cells [37]. We are interested in further exploring whether the smaller isoform is also associated with other types of tumours. Because the N-terminal region of annexin A3 plays an important role in mediating protein–protein interaction, it would be interesting to determine whether enforced expression of the 33-kD isoform can still increase the formation of vesicles in ovarian cancer cells, which would help to understand the mechanism of annexin A3-promoted vesicle formation.
Acknowledgments
This work was supported by the Key Foundation of PUMC Hospital (Grant 200203). We thank Dr. Joel D. Ernst (University of California, San Francisco, USA) for anti-annexin A3 antibody, Professor Wei Dai (Electron Microscopy Center, Peking Union Medical College, Beijing, China) for technical assistance in electron microscopy. We are also grateful to our colleagues in the Department of Cell Biology, Institute of Basic Medical Sciences, for their support and technical assistance, and to Dr. Alan O. Perantoni for his editing of the paper.
Conflict of interest
The authors confirm that there are no conflicts of interest.
References
- 1.Berek JS. Practical gynecologic oncology. Philadelphia: Lippincott Williams & Wilkins; 2000. [Google Scholar]
- 2.Hamada S, Kamada M, Furumoto H, et al. Expression of glutathione S-transferase-pi in human ovarian cancer as an indicator of resistance to chemotherapy. Gynecol Oncol. 1994;52:313–9. doi: 10.1006/gyno.1994.1055. [DOI] [PubMed] [Google Scholar]
- 3.Veneroni S, Zaffaroni N, Daidone MG, et al. Expression of P-glycoprotein and in vitro or in vivo resistance to doxorubicin and cisplatin in breast and ovarian cancers. Eur J Cancer. 1994;30:1002–7. doi: 10.1016/0959-8049(94)90132-5. [DOI] [PubMed] [Google Scholar]
- 4.Sasaki H, Sheng Y, Kotsuji F, et al. Down-regulation of X-linked inhibitor of apoptosis protein induces apoptosis in chemoresistant human ovarian cancer cells. Cancer Res. 2000;60:5659–66. [PubMed] [Google Scholar]
- 5.Marth C, Widschwendter M, Kaern J, et al. Cisplatin resistance is associated with reduced interferon-gamma-sensitivity and increased HER-2 expression in cultured ovarian carcinoma cells. Br J Cancer. 1997;76:1328–32. doi: 10.1038/bjc.1997.556. [DOI] [PMC free article] [PubMed] [Google Scholar]
- 6.Aebi S, Kurdi-Haidar B, Gordon R, et al. Loss of DNA mismatch repair in acquired resistance to cisplatin. Cancer Res. 1996;56:3087–90. [PubMed] [Google Scholar]
- 7.Yan XD, Pan LY, Yuan Y, et al. Identification of platinum-resistance associated proteins through proteomic analysis of human ovarian cancer cells and their platinum-resistant sublines. J Proteome Res. 2007;6:772–80. doi: 10.1021/pr060402r. [DOI] [PubMed] [Google Scholar]
- 8.Yan XD, Yin J, Yao H, et al. Increased expression of annexin A3 is a mechanism of platinum resistance in ovarian cancer. Cancer Res. 2010;70:1616–24. doi: 10.1158/0008-5472.CAN-09-3215. [DOI] [PubMed] [Google Scholar]
- 9.Morgan RO, Fernandez MP. Annexin gene structures and molecular evolutionary genetics. Cell Mol Life Sci. 1997;53:508–15. doi: 10.1007/s000180050064. [DOI] [PMC free article] [PubMed] [Google Scholar]
- 10.Gerke V, Creutz CE, Moss SE. Annexins: linking Ca2+ signaling to membrane dynamics. Nat Rev Mol Cell Biol. 2005;6:449–61. doi: 10.1038/nrm1661. [DOI] [PubMed] [Google Scholar]
- 11.Gerke V, Creutz CE, Moss SE. Annexins: from structure to function. Physiol Rev. 2002;82:331–71. doi: 10.1152/physrev.00030.2001. [DOI] [PubMed] [Google Scholar]
- 12.Pellicciari C, Bottone MG, Biggiogera M. Detection of apoptotic cells by annexin V labeling at electron microscopy. Eur J Histochem. 1997;41:211–6. [PubMed] [Google Scholar]
- 13.Seaton BA, Dedman JR. Annexins. Biometals. 1998;11:339–404. doi: 10.1023/a:1009205925714. [DOI] [PubMed] [Google Scholar]
- 14.Ernst JD, Hoye E, Blackwood RA, et al. Purification and characterization of an abundant cytosolic protein from human neutrophils that promotes Ca2+-dependent aggregation of isolated specific granules. J Clin Invest. 1990;85:1065–71. doi: 10.1172/JCI114537. [DOI] [PMC free article] [PubMed] [Google Scholar]
- 15.Chu CS, Thigpen JT. The role of chemotherapy in gynecologic cancer. In: Rubin SC, editor. Chemotherapy of gynecologic cancer. 2nd ed. Philadephia: Lippincott Williams & Wilkins; 2004. pp. 101–25. [Google Scholar]
- 16.Toda T, Takeya K, Koike M, et al. Electron microscopy of ultrathin sections of Mycobacterium. I. Fine structures of the cells grown in-vitro and in-vivo. Proc Jpn Acad. 1960;36:372–5. [Google Scholar]
- 17.Bello V, Mattei G, Mazzoldi P, et al. Transmission electron microscopy of lipid vesicles for drug delivery: comparison between positive and negative staining. Microsc Microanal. 2010;16:456–61. doi: 10.1017/S1431927610093645. [DOI] [PubMed] [Google Scholar]
- 18.Milne RG. Solid phase immune electron microscopy of virus preparations. In: Hyatt AD, Eaton BT, editors. Immuno-gold electron microscopy in virus diagnosis and research. Boca Raton: CRC Press; 1993. pp. 25–70. [Google Scholar]
- 19.Lamparski HG, Metha-Damani A, Yao JY, et al. Production and characterization of clinical grade exosomes derived from dendritic cells. J Immunol Methods. 2002;270:211–26. doi: 10.1016/s0022-1759(02)00330-7. [DOI] [PubMed] [Google Scholar]
- 20.Ma AS, Bell DJ, Mittal AA, et al. Immunocytochemical detection of extracellular annexin II in cultured human skin keratinocytes and isolation of annexin II isoforms enriched in the extracellular pool. J Cell Sci. 1994;107:1973–84. doi: 10.1242/jcs.107.7.1973. [DOI] [PubMed] [Google Scholar]
- 21.Faure AV, Migne C, Devilliers G, et al. Annexin 2 “secretion” accompanying exocytosis of chromaffin cells: possible mechanisms of annexin release. Exp Cell Res. 2002;276:79–89. doi: 10.1006/excr.2002.5512. [DOI] [PubMed] [Google Scholar]
- 22.Schostak M, Schwall GP, Poznanovic S, et al. Annexin A3 in urine: a highly specific noninvasive marker for prostate cancer early detection. J Urol. 2009;181:343–53. doi: 10.1016/j.juro.2008.08.119. [DOI] [PubMed] [Google Scholar]
- 23.Futter CE, White IJ. Annexins and endocytosis. Traffic. 2007;8:951–8. doi: 10.1111/j.1600-0854.2007.00590.x. [DOI] [PubMed] [Google Scholar]
- 24.Donnelly SR, Moss SE. Annexins in the secretory pathway. Cell Mol Life Sci. 1997;53:533–8. doi: 10.1007/s000180050068. [DOI] [PMC free article] [PubMed] [Google Scholar]
- 25.Sotelo JR, Porter KR. An electron microscope study of the rat ovum. J Biophys Biochem Cytol. 1959;5:327–42. doi: 10.1083/jcb.5.2.327. [DOI] [PMC free article] [PubMed] [Google Scholar]
- 26.Danielsen EM, van Deurs B, Hansen GH. “Nonclassical” secretion of annexin A2 to the lumenal side of the enterocyte brush border membrane. Biochemistry. 2003;42:14670–6. doi: 10.1021/bi0355239. [DOI] [PubMed] [Google Scholar]
- 27.Hansen GH, Immerdal L, Thorsen E, et al. Lipid rafts exist as stable cholesterol-independent microdomains in the brush border membrane of enterocytes. J Biol Chem. 2001;276:32338–44. doi: 10.1074/jbc.M102667200. [DOI] [PubMed] [Google Scholar]
- 28.Simpson RJ, Lim JW, Moritz RL, et al. Exosomes: proteomic insights and diagnostic potential. Expert Rev Proteomics. 2009;6:267–83. doi: 10.1586/epr.09.17. [DOI] [PubMed] [Google Scholar]
- 29.Madoz-Gurpide J, Lopez-Serra P, Martinez-Torrecuadrada JL, et al. Proteomics-based validation of genomic data: applications in colorectal cancer diagnosis. Mol Cell Proteomics. 2006;5:1471–83. doi: 10.1074/mcp.M600048-MCP200. [DOI] [PubMed] [Google Scholar]
- 30.Liu YF, Xiao ZQ, Li MX, et al. Quantitative proteome analysis reveals annexin A3 as a novel biomarker in lung adenocarcinoma. J Pathol. 2009;217:54–64. doi: 10.1002/path.2429. [DOI] [PubMed] [Google Scholar]
- 31.Wozny W, Schroer K, Schwall GP, et al. Differential radioactive quantification of protein abundance ratios between benign and malignant prostate tissues: cancer association of annexin A3. Proteomics. 2007;7:313–22. doi: 10.1002/pmic.200600646. [DOI] [PubMed] [Google Scholar]
- 32.Muggia F. Platinum compounds 30 years after the introduction of cisplatin: implications for the treatment of ovarian cancer. Gynecol Oncol. 2009;112:275–81. doi: 10.1016/j.ygyno.2008.09.034. [DOI] [PubMed] [Google Scholar]
- 33.Wang Y, Serfass L, Roy MO, et al. Annexin-I expression modulates drug resistance in tumour cells. Biochem Biophys Res Commun. 2004;314:565–70. doi: 10.1016/j.bbrc.2003.12.117. [DOI] [PubMed] [Google Scholar]
- 34.Han EK, Tahir SK, Cherian SP, et al. Modulation of paclitaxel resistance by annexin IV in human cancer cell lines. Br J Cancer. 2000;83:83–8. doi: 10.1054/bjoc.2000.1311. [DOI] [PMC free article] [PubMed] [Google Scholar]
- 35.Miao Y, Cai B, Liu L, et al. Annexin IV is differentially expressed in clear cell carcinoma of the ovary. Int J Gynecol Cancer. 2009;19:1545–9. doi: 10.1111/IGC.0b013e3181a844c8. [DOI] [PubMed] [Google Scholar]
- 36.Kim A, Enmoto T, Serada S, et al. Enhanced expression of annexin A4 in clear cell carcinoma of the ovary and its association with chemoresistance to carboplatin. Int J Cancer. 2009;125:2316–22. doi: 10.1002/ijc.24587. [DOI] [PubMed] [Google Scholar]
- 37.Bianchi C, Bombelli S, Raimondo F, et al. Primary cell cultures from human renal cortex and renal-cell carcinoma evidence a differential expression of two spliced isofroms of annexin A3. Am J Pathol. 2010;176:1660–70. doi: 10.2353/ajpath.2010.090402. [DOI] [PMC free article] [PubMed] [Google Scholar]