Abstract
PURPOSE
Multiple chronic conditions in a single patient can be a challenging health burden. We aimed to examine patterns and prevalence of multimorbidity among patients attending 2 large Australian primary care practices and to estimate disease severity burden using the Cumulative Illness Rating Scale (CIRS).
METHODS
Using published CIRS guidelines and a disease severity index calculated for each individual, we extracted data from the medical records of all 7,247 patients (58.5% female) seen over 6 months in 2008 who were rated for chronic conditions across 14 anatomical domains.
RESULTS
Fifty-two percent of patients had multimorbidity in 2 or more CIRS domains, ranging from 20.6% if younger than 25 years, 43.7% if aged 25 to 44 years, 75.5% if aged 45 to 64 years, 87.5% if aged 65 to 74 years, and 97.1% if aged 75 years and older. Using a cutoff of 3 or more CIRS domains, 34.5% had multimorbidity ranging from 4.8% if younger than 25 years, 22.3% if aged 25 to 44 years, 56.1% if aged 45 to 64 years, 74.6% if aged 65 to 74 years, and 92.0% if aged 75 years and older. Musculoskeletal, singularly or in combination with others, was the commonest morbidity domain. The moderate severity index category increased with increasing age.
CONCLUSIONS
Multimorbidity is a significant problem in men and women across all age-groups, and the moderate severity index increases with age. The musculoskeletal domain was most commonly affected. Mild and moderate severity index categories may underrepresent disease burden. Severity burden assessment in the primary care setting needs to take into account the severity index, as well as levels of domain severity within the index categories.
Keywords: multimorbidity, primary care, general practice, chronic disease, prevalence, severity index
INTRODUCTION
Multimorbidity, the coexistence of multiple chronic conditions in a single individual,1–3 is a major health priority area.4 The progressive aging of populations, improved medical services, and advancing technologies mean increased survival with greater health service demands for expanding numbers of patients with multiple chronic conditions.2,5–7
Much of the population burden of multimorbidity remains hidden, and its true prevalence unknown.8 As a result, the management of multimorbidity is underresourced, especially within primary care, where most of the care is delivered.
Morbidity burden for individuals and populations may have a greater impact than is suggested by simple disease prevalence. The synergistic nature of disease presentations can be complex6,9–11 making it important to recognize common patterns of comorbid conditions in particular among the elderly. Furthermore, the absence of agreement on scales to quantify and compare morbidity burden for patients and families adds to the complexity.12,13
Primary care is recognized as best positioned to offer coordinated care, especially where more comprehensive, team-based management is required.10 Australian primary care is Medicare funded, with general practitioners the point of first contact with the health system and the federal government paying 85% of scheduled fees.14 There are no designated patient lists, and patients are free to consult general practitioners or practices of their choice. More than 83% of the population consult general practitioners annually, and older patients with chronic diseases have higher consultation rates and greater practice demands.14
Multimorbidity data among patients attending Australian general practice are limited5,15; only 1 other study (Bettering the Evaluation and Care of Health, BEACH)5 has estimated the prevalence of multimorbidity using an adaptation of the Cumulative Illness Rating Scale (CIRS).12,16–20
The current study estimates patterns and prevalence of multimorbidity across the entire age spectrum of patients attending 2 large metropolitan practices in Western Australia during a 6-month period. In contrast to the BEACH study, data were purposefully collected as intended in the validated CIRS instrument and include an estimation of severity burden.
METHODS
Study Setting
Patient data were extracted from medical records at practices A and B for all patients seen between 1 July and 31 December 2008, including home, hostel, and nursing home visits. Patients seen for mole assessments through an adjunct primary care service and who were not regular attendees at practice A were excluded.
Data Extraction
Two general practitioners, a practice nurse, a nurse practitioner, a medical student, and a psychology student undertook data extraction at practice A, whereas 3 general practitioners and a practice nurse undertook the task at practice B. All data extractors were specifically trained in data extraction by the lead author. Random subsamples of 30 (practice A) and 35 (practice B) patients were reassessed to measure consistency.
A combination of free-text electronic medical records and older hard copy files based on medical histories recorded by the general practitioner, as well as hospital discharge and outpatient letters and radiology and pathology reports, was used to maximize the available data on each patient. The multisource medical records review was chosen to provide the best source of comprehensive data,6,16 as the electronic-only records were incomplete.
Severity Index
Records were reviewed, and 42 conditions were rated using the CIRS guidelines18,20,21: 0 = no problems, 1 = mild or past serious problems, 2 = moderate disability or morbidity, 3 = severe chronic problems, 4 = extremely severe functional impairment. Conditions were categorized into 14 (body system) domains (Supplemental Table, available at www.annfammed.org/content/11/6/535/suppl/DC1). Maximum scores for each domain were tabulated, and numbers of domains with levels 1 to 4 recorded.
Summing maximum scores per domain yielded a total score 0 to 56 for each patient. The patient’s severity index20,21 was calculated by dividing the total score by the number of domains with morbidities to generate average CIRS scores of 0 to 4. Because the severity index score of 4 was minimal (0.07%), we combined it with a score of 3. Hence, the severity index categories were 0 = none, 1 = mild, 2 = moderate and 3/4 = severe.
Definition of Multimorbidty
The operational definition of multimorbidity was the coexistence of chronic conditions across 2 or more domains in individual patients.5 We used O’Halloran et al’s definition22 of chronicity as lasting at least 6 months and having a documented pattern of recurrence or deterioration and an impact on an individual’s quality of life. For comparison with other studies,3,5 we report data using cutoffs of 2 or more and 3 or more CIRS domains as suggested by recent systematic review.3
Data Analysis and Representation
Data were analyzed using SPSS 20 (SPSS Inc). Results are expressed as means (standard deviation of the mean) for continuous variables and frequencies (percentages) for categorical variables. The intraclass correlation coefficient (ICC) between raters for number of domains with morbidities and total CIRS score was calculated for each practice using Cronbach’s α.
Ethics
Ethics approval was obtained from the Human Research Ethics Committee of The University of Notre Dame Australia.
RESULTS
Data were extracted for 7,247 patients—4,583 from practice A and 2,664 from practice B. Age distributions for the study population and comparison with national Australian data are shown in Table 1.
Table 1.
Age and Sex Distribution for Study Population
| Characteristic | Practice A | Practice B | Overall | Australian Population |
|---|---|---|---|---|
| Number of patients | 4,583 | 2,664 | 7,247 | … |
| Sex, % | ||||
| Male | 39.3 | 45.2 | 41.5 | 49.7a |
| Females | 60.7 | 54.8 | 58.5 | 50.3a |
| Age, average (SD), y | ||||
| Overall | 36.2 (21.1) | 42.2 (24.7) | 38.4 (22.7) | 37.8b |
| Male | 35.1 (22.3) | 44.7 (24.7) | 39.0 (23.8) | 37.0b |
| Female | 36.9 (20.3) | 40.2 (24.5) | 38.0 (21.9) | 38.6b |
| Age range | ||||
| Male | 2 mo – 92 y | 3 mo–99 y | 2 mo – 99 y | … |
| Female | 1 mo – 98 y | 1 mo–99 y | 1 mo – 99 y | … |
| Patients within age category, % (n)c | ||||
| <25 y | 28.9 (1,326) | 29.1 (776) | 29.0 (2,102) | 33.3b |
| 25–44 y | 35.7 (1,635) | 24.1 (642) | 31.4 (2,277) | 28.5b |
| 45–64 y | 27.1 (1,243) | 24.8 (661) | 26.3 (1,904) | 25.0b |
| 65–74 y | 4.6 (211) | 10.4 (277) | 6.7 ( 488) | 7.0b |
| ≥75 y | 3.7 (168) | 11.6 (308) | 6.6 ( 476) | 6.2b |
The ICC for reliability between raters was 0.89 (95% CI, 0.82–0.94) for domains with morbidities and 0.92 (95% CI, 0.87–0.96) for total CIRS scores for practice A and 0.76 (95% CI, 0.64–0.86) and 0.77 (95% CI, 0.65–0.86), respectively, for practice B.
Multimorbidity was common, with 51.8% having scores in 2 or more, 34.5% in 3 or more, and 14.9% in 5 or more domains. Figure 1 shows the domain patterns for 1 to 4 or more domain combinations. Of those with 1 or more domains affected, the most common were musculoskeletal/integumental, then psychiatric, respiratory, and vascular. This pattern persisted with morbidities in 2, 3, or 4 or more domains. Table 2 displays the breakdown overall and by age for the 5 most common domains and domain combinations. Musculoskeletal/integumental was prominent in combinations involving 2 or more and 3 or more domains in patients aged 45 years and older. Combined domain morbidities were found in those older than 44 years, but the highest prevalence was less than 10%.
Figure 1.
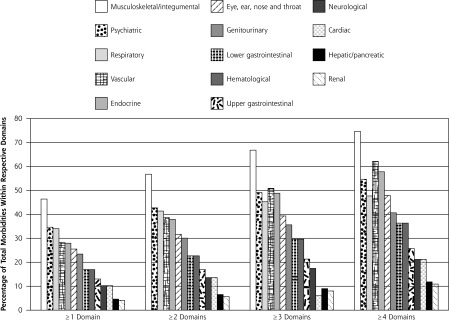
Domain patterns in 1, 2, 3, and 4 or more domain combinations.
Note: Denominators for 1 or more domains, n = 5,405; for 2 or more domains, n = 3,753; for 3 or more domains, n = 2,499; and for 4 or more domains, n = 1,651.
Table 2.
Overall and Age Category Breakdown For the 5 Most Common Domains
| Age Category, Yearsa | ||||||
|---|---|---|---|---|---|---|
|
|
||||||
| Domain | Frequencies | <25 (n=2,102) | 25–44 (n=2,277) | 45–64 (n=1,904) | 65–74 (n=488) | ≥75 (n=476) |
| 1 Domain only, % (n)b | ||||||
| Musculoskeletal/integumental | 22.8 (377) | 8.56 (180) | 5.05 (115) | 3.89 (74) | 1.43 (7) | 0.21 (1) |
| Respiratory | 17.3 (285) | 5.57 (117) | 5.27 (120) | 2.15 (41) | 1.43 (7) | 0.00 |
| Psychiatric | 16.2 (268) | 3.66 (77) | 6.81 (155) | 1.73 (33) | 0.61 (3) | 0.00 |
| Eye, ear, nose and throat | 11.6 (191) | 7.09 (149) | 1.14 (26) | 0.68 (13) | 0.41 (2) | 0.21 (1) |
| Genitourinary | 8.3 (137) | 1.86 (39) | 3.25 (74) | 1.16 (22) | 0.41 (2) | 0.00 |
| ≥1 Domain, % (n)c | ||||||
| Musculoskeletal/integumental | 46.4 (2,507) | 18.65 (392) | 25.60 (538) | 46.38 (883) | 56.35 (275) | 78.57 (374) |
| Psychiatric | 34.6 (1,871) | 9.85 (207) | 28.81 (656) | 33.09 (630) | 30.94 (151) | 47.69 (227) |
| Respiratory | 34.0 (1,838) | 16.08 (338) | 24.33 (554) | 35.61 (678) | 32.99 (161) | 22.48 (107) |
| Vascular | 28.2 (1,527) | 0.43 (9) | 6.06 (138) | 35.29 (672) | 66.39 (324) | 80.67 (384) |
| Endocrine | 28.0 (1,512) | 2.19 (46) | 12.60 (287) | 39.23 (747) | 43.85 (214) | 45.80 (218) |
| ≥2 Domains, % (n)d | ||||||
| Musculoskeletal/integumental + vascular | 24.0 (900) | 0.10 (2) | 2.11 (48) | 18.28 (348) | 40.57 (198) | 63.87 (304) |
| Musculoskeletal/integumental + psychiatric | 23.8 (893) | 2.33 (49) | 9.00 (205) | 17.80 (339) | 22.75 (111) | 39.71 (189) |
| Musculoskeletal/integumental + endocrine | 22.1 (830) | 0.48 (10) | 4.57 (104) | 21.06 (401) | 28.89 (141) | 36.55 (174) |
| Musculoskeletal/integumental + respiratory | 21.6 (812) | 4.38 (92) | 7.95 (181) | 18.49 (352) | 20.29 (99) | 18.49 (88) |
| Musculoskeletal/integumental + eye, ear, nose, and throat | 20.4 (766) | 3.28 (69) | 3.07 (70) | 11.55 (220) | 26.64 (130) | 58.19 (277) |
| ≥3 Domains, % (n)e | ||||||
| Musculoskeletal/integumental + vascular + endocrine | 18.6 (464) | 0.05 (1) | 0.70 (16) | 9.82 (187) | 22.54 (110) | 31.51 (150) |
| Musculoskeletal/integumental + vascular + eye, ear, nose and throat | 16.9 (423) | 0.00 | 0.26 (6) | 4.62 (88) | 20.29 (99) | 48.32 (230) |
| Musculoskeletal/integumental + psychiatric + vascular | 15.8 (394) | 0.00 | 1.10 (25) | 6.83 (130) | 16.80 (82) | 32.98 (157) |
| Musculoskeletal/integumental + psychiatric + endocrine | 14.8 (371) | 0.14 (3) | 2.15 (49) | 9.77 (186) | 11.07 (54) | 16.60 (79) |
| Musculoskeletal/integumental + psychiatric + respiratory | 14.0 (350) | 0.76 (16) | 3.56 (81) | 8.46 (161) | 9.43 (46) | 9.66 (46) |
Frequencies are a percentage of population within the respective age category.
Denominator for 1 domain only, n = 1,652.
Denominator for 1 or more domains, n = 5,405.
Denominator for 2 or more domains, n = 3,753.
Denominator for 3 or more domains, n = 2,499.
Overall, 57.5% (n = 4,168) of the total cohort had mild, 49.2% (n = 3,564) had moderate and 14.4% (n = 1,045) had severe severity index scores. The age breakdown is shown in Figure 2. Severity index scores increased with age, with moderate scores showing the greatest increase. Absence of disease and ensuing absence of severity burden decreased with increasing age without any difference by sex.
Figure 2.
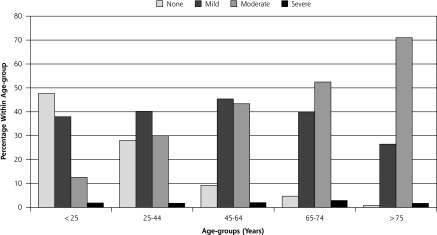
Severity index distribution within age-groups.
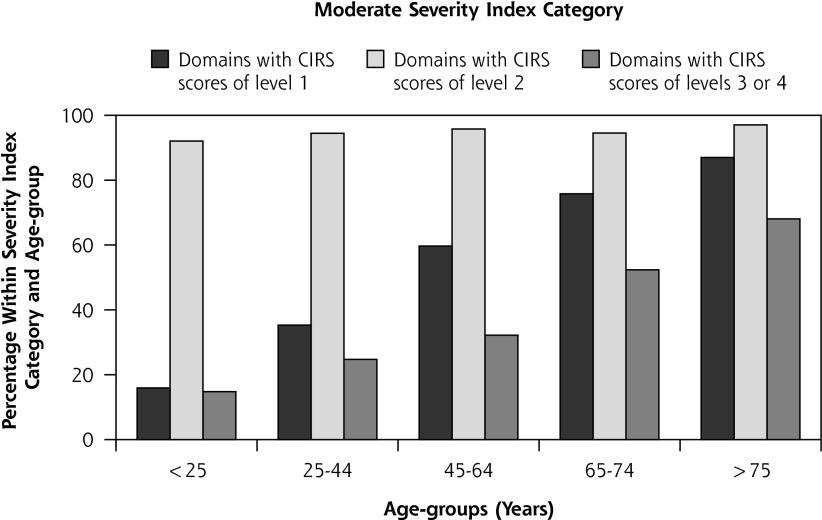
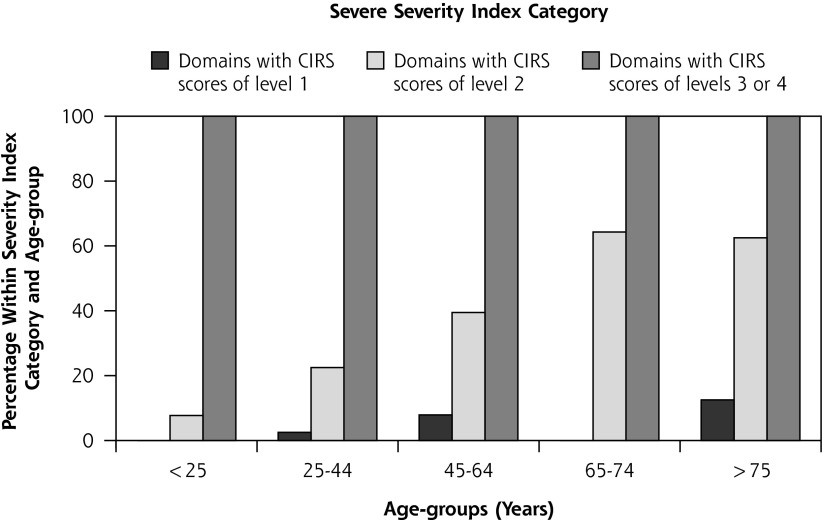
In Figure 3 is displayed the frequency of patients with domain scores at levels 1 to 4 within the severity index categories for different age-groups. Less than 10% had level 3/4 scores in the mild category, whereas level 2 scores increased progressively with age. Scores at level 1 and level 3/4 in the moderate category increased progressively with age, as did level 2 scores in the severe category.
Figure 3.
Frequency of domain scores by severity index category.
In Figure 4 the prevalence of multimorbidity across age-groups in the current study is compared with that found in other primary care research5,6,12 using cutoffs of 2 or more and 3 or more domains. Prevalence levels across all age-groups in the current study were less than those described by Fortin et al6 but more than those reported by Britt et al.5
Figure 4.
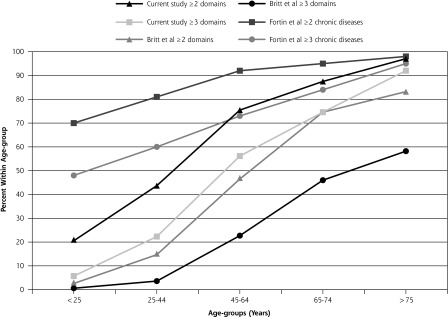
Comparison of prevalence of multimorbidity within age-groups with other studies.
DISCUSSION
This Australian study is the first to use all 14 CIRS domains to estimate patterns and prevalence of multi-morbidity in primary care practices. We include assessment of disease severity because the combination of prevalence and severity index provides a better overall picture of multimorbidity burden.25,26
Unlike the earlier BEACH study,5 which relied on secondary analysis of data, this study uses information purposefully extracted from electronic and hard copy patient medical records. Though the physical demands of extracting data in this way are considerable, the information yield is more comprehensive,6 and the potential for greater accuracy is maximized.
Findings of multimorbidity research generally lack uniformity in approaches to presenting findings3,7,10,27,28 and are inconsistent in interpreting severity and disease burden.5–8,29 Previous studies have reported either total CIRS scores5 or cutoffs of these scores.6 We adhere to Miller et al’s approach20,21 in assessing number of domains affected, total score, and the ratio of total score to number of domains (yielding a severity index), as well as the number of domains with maximum scores at levels 3 and 4. Recording domains at levels 1 and 2, but especially 3 and 4, guards against clinical under-interpretation of serious medical burden and highlights whether the total CIRS score is the product of a few serious problems or several minor ones.20
The possibility of severity underestimation is illustrated by the study findings. We found mild and moderate severity index categories to be underrepresentative of severity burden, including a number of domains with higher level severity than the severity index category implied. Interrater variability is unlikely to be the cause, because there was good interrater correlation between data extractors; this finding is more likely due to the reductionist nature of the CIRS severity index calculation. Hence, it is imperative to always refer to domain-level scores when interpreting its significance.
The patient sample is comparable with the overall Australian population in terms of age-sex distribution.23,24 Multimorbidity and severity burden are found among all age-groups; they increase with age and have similar distributions by sex, confirming previous Canadian,6 Australian,5,15 European,7 and United States8,30,31 studies regardless of study design.
Prevalence rates across age-groups are less than those found in the study by Fortin et al6 but are greater than rates found in the study by Britt et al.5 In comparison with the Canadian study,6 our population is considerably larger (7,247 vs 980), the average age of our patient cohort younger (39 and 38 years for male and female patients vs 58 and 55 years for male and female patients, respectively) and we use 14 domains rather than all conditions. Compared with Britt et al,5 we use more conditions (42 vs 18) across more domains (14 vs 9), together with more intensive examination of patient records and purposeful collection of data that could explain our greater prevalence. As were Hoffman et al’s findings,8 the prevalence of multimorbidity in patients younger than 25 years and between 25 to 44 years in our study is higher than for the Britt et al5 and van den Akker et al7 studies, but less than for Fortin et al’s6 18- to 44-year-old patients.
Prevalence estimates using cutoffs of 2 or more domains according to age confirm the S-shaped curve with a more pronounced increase occurring in the 45- to 64-year age-group, as described by Fortin et al3 and noted by Barnett et al.32 This group may warrant increased surveillance over time to help map progression of morbidities and prevent increased management efforts into the future. Using a cutoff of 3 or more domains, our results show a less pronounced S-shaped curve reflecting lower overall prevalence, again positioned between the findings of Fortin et al3,6 and Britt et al.5
The high prevalence of musculoskeletal morbidity, whether 1, 2, or 3 or more domains, is similar to that found by Britt et al.5 Six of the 14 most common combinations of 2 or more domains involve musculoskeletal compared with 5 of 12 for Britt et al.5 Inclusion of integumental in the musculoskeletal domain in our study may warrant further investigation.
Limitations of the Study
Our study, based on 2 practices and assessing attendees over a 6-month period, possibly favors inclusion of more frequent attendees with more serious medical problems. We did not undertake socioeconomic or cultural background analyses of factors contributing to or interacting with complexity in disease burden estimation. In addition, we did not analyze disease burden from the patient’s perspective.33 We include patients aged 0 to 25 years so as not to discriminate against them but to acknowledge that this group has unique characteristics34; CIRS has not been used previously to assess their potential multimorbidity.35 Our interrater comparison numbers are small (less than 1%), which may limit reliability. Our record reviews involve consensus discussions between extractors but may have potential for varying interpretations of chronicity.
This Australian primary care study is the first to apply the CIRS fully across the complete age spectrum of a cohort of patients. We confirm multimorbidity is considerable in men and women, increasing steadily with age. The severity index also progressively increases with age, with those classified as moderate showing the greatest increase. Patterns of multimorbidity reveal musculoskeletal as the most common domain affected, both singularly and in combination with others. Because of the methods used, our patterns and prevalence estimates reflect closely the reality of multimorbidity in Australian primary care but may under-represent severity burden. Future severity burden assessment using CIRS in primary care should take into account domain severity levels within severity index categories.
Acknowledgments
We acknowledge the assistance of Maeve Kiely, Claire Jenkins, Lara Fine, and Jayne Kotz with data collection and the staff at the 2 medical practices involved in the study. We thank Dr Cam Phan for assistance in setting up of the database, and Dr Dana Hince for assisting with preliminary data analysis.
Footnotes
Conflicts of interest: authors report none.
Funding Support: Commonwealth Primary Health Care Research Evaluation and Development (PHCRED) Strategy Phase II. We also acknowledge financial support from J. Galvin, P. Smyth, W. and J. MacKenzie.
Previous presentations: Brett T, Arnold-Reed D, Moorhead R, Bovell G, Fine H, Bulsara M; Cumulative illness rating scale to measure multimorbidity in primary care; National Primary Health Care Research Conference, Brisbane; 13–15 July 2011. Soliman B, Brett T, Arnold-Reed D, Bulsara M; The increasing problem of multi-morbidity in Australian primary care; WA State Primary Health Care Research Evaluation and Development Conference, Perth; 12 November 2010.
References
- 1.Van den Akker MF, Buntinx E, Knottnerus JA. Comorbidity or multimorbidity: what’s in a name? A review of literature. Eur J Gen Pract. 1996;2:65–70 [Google Scholar]
- 2.Uijen AA, van de Lisdonk EH. Multimorbidity in primary care: prevalence and trend over the last 20 years. Eur J Gen Pract. 2008; 14(Suppl 1):28–32 [DOI] [PubMed] [Google Scholar]
- 3.Fortin M, Stewart M, Poitras ME, Almirall J, Maddocks H. A systematic review of prevalence studies on multimorbidity: toward a more uniform methodology. Ann Fam Med. 2012;10(2):142–151 [DOI] [PMC free article] [PubMed] [Google Scholar]
- 4.Valderas JM, Starfield B, Roland M. Multimorbidity’s many challenges: a research priority in the UK. [comment]. BMJ. 2007;334 (7604):1128. [DOI] [PMC free article] [PubMed] [Google Scholar]
- 5.Britt HC, Harrison CM, Miller GC, Knox SA. Prevalence and patterns of multimorbidity in Australia. Med J Aust. 2008;189(2):72–77 [DOI] [PubMed] [Google Scholar]
- 6.Fortin M, Bravo G, Hudon C, Vanasse A, Lapointe L. Prevalence of multimorbidity among adults seen in family practice. Ann Fam Med. 2005;3(3):223–228 [DOI] [PMC free article] [PubMed] [Google Scholar]
- 7.van den Akker MF, Buntinx F, Metsemakers JF, Roos S, Knottnerus JA. Multimorbidity in general practice: prevalence, incidence, and determinants of co-occurring chronic and recurrent diseases. J Clin Epidemiol. 1998;51(5):367–375 [DOI] [PubMed] [Google Scholar]
- 8.Hoffman C, Rice D, Sung HY. Persons with chronic conditions. Their prevalence and costs. JAMA. 1996;276(18):1473–1479 [PubMed] [Google Scholar]
- 9.Smith SM, O’Dowd T. Chronic diseases: what happens when they come in multiples? Br J Gen Pract. 2007;57(537):268–270 [PMC free article] [PubMed] [Google Scholar]
- 10.Starfield B. Challenges to primary care from co- and multi-morbidity. Prim Health Care Res Dev. 2011;12(1):1–2 [DOI] [PubMed] [Google Scholar]
- 11.Fortin M, Soubhi H, Hudon C, Bayliss EA, van den Akker M. Multimorbidity’s many challenges. BMJ. 2007;334(7602):1016–1017 [DOI] [PMC free article] [PubMed] [Google Scholar]
- 12.Fortin M, Hudon C, Dubois M-F, Almirall J, Lapointe L, Soubhi H. Comparative assessment of three different indices of multimorbidity for studies on health-related quality of life. Health Qual Life Outcomes. 2005;3:74. [DOI] [PMC free article] [PubMed] [Google Scholar]
- 13.van den Akker M, Buntinx F, Roos S, Knottnerus JA. Problems in determining occurrence rates of multimorbidity. J Clin Epidemiol. 2001;54(7):675–679 [DOI] [PubMed] [Google Scholar]
- 14.Britt H, Miller GC, Charles J, et al. General Practice Activity in Australia 2009–2010. General Practice Series no. 27 Cat. No. GEP 27, 2010, AIHW: Canberra [Google Scholar]
- 15.Knox SA, Harrison CM, Britt HC, Henderson JV. Estimating prevalence of common chronic morbidities in Australia. Med J Aust. 2008;189(2):66–70 [DOI] [PubMed] [Google Scholar]
- 16.de Groot V, Beckerman H, Lankhorst GJ, Bouter LM. How to measure comorbidity. a critical review of available methods. J Clin Epidemiol. 2003;56(3):221–229 [DOI] [PubMed] [Google Scholar]
- 17.Hudon C, Fortin M, Soubhi H. Abbreviated guidelines for scoring the Cumulative Illness Rating Scale (CIRS) in family practice. J Clin Epidemiol. 2007;60(2):212. [DOI] [PubMed] [Google Scholar]
- 18.Hudon C, Fortin M, Vanasse A. Cumulative Illness Rating Scale was a reliable and valid index in a family practice context. J Clin Epidemiol. 2005;58(6):603–608 [DOI] [PubMed] [Google Scholar]
- 19.Linn BS, Linn MW, Gurel L. Cumulative illness rating scale. J Am Geriatr Soc. 1968;16(5):622–626 [DOI] [PubMed] [Google Scholar]
- 20.Miller MD, Towers A. A Manual of Guidelines for Scoring the Cumulative Illness Rating Scale for Geriatrics (CIRS-G). Pittsburg, PA: University of Pittsburg; 1991 [Google Scholar]
- 21.Miller MD, Paradis CF, Houck PR, et al. Rating chronic medical illness burden in geropsychiatric practice and research: application of the Cumulative Illness Rating Scale. Psychiatry Res. 1992;41(3):237–248 [DOI] [PubMed] [Google Scholar]
- 22.O’Halloran J, Miller GC, Britt H. Defining chronic conditions for primary care with ICPC-2. Fam Pract. 2004;21(4):381–386 [DOI] [PubMed] [Google Scholar]
- 23.Australian Bureau of Statistics Population by Age and Sex, Australian States and Territories, Jun 2009 Table 7: Estimated Resident Population, by age and sex-at 30 June 2008, data cube: Population by age and sex. Excel spreadsheet, cat. no. 3201.0 http://www.abs.gov.au/AUSSTATS/abs@.nsf/DetailsPage/3201.0Jun%202009?OpenDocument Accessed Aug 31, 2012
- 24.Australian Bureau of Statistics Australian Demographic Statistics, Mar 2010 Table 6: Age distribution, by sex, preliminary- at 30 June 2009, data cube: Population by Age and Sex. Excel spreadsheet, cat. no. 3101.0. http://www.abs.gov.au/AUSSTATS/abs@.nsf/DetailsPage/3101.0Mar%202010?OpenDocument Accessed Aug 31, 2012
- 25.Huntley AL, Johnson R, Purdy S, Valderas JM, Salisbury C. Measures of multimorbidity and morbidity burden for use in primary care and community settings: a systematic review and guide. Ann Fam Med. 2012;10(2):134–141 [DOI] [PMC free article] [PubMed] [Google Scholar]
- 26.Valderas JM, Starfield B, Sibbald B, Salisbury C, Roland M. Defining comorbidity: implications for understanding health and health services. Ann Fam Med. 2009;7(4):357–363 [DOI] [PMC free article] [PubMed] [Google Scholar]
- 27.Mercer SW, Smith SM, Wyke S, O’Dowd T, Watt GC. Multimorbidity in primary care: developing the research agenda. Fam Pract. 2009;26(2):79–80 [DOI] [PubMed] [Google Scholar]
- 28.Valderas JM, Mercer SW, Fortin M. Research on patients with multiple health conditions: different constructs, different views, one voice. J Clin Epidemiol. 2011;1(1):1–3 [DOI] [PMC free article] [PubMed] [Google Scholar]
- 29.Glynn LG, Valderas JM, Healy P, et al. The prevalence of multimorbidity in primary care and its effect on health care utilization and cost. Fam Pract. 2011;28(5):516–523 10.1093/fampra/cmr013 [DOI] [PubMed] [Google Scholar]
- 30.Condelius A, Edberg A-K, Jakobsson U, Hallberg IR. Hospital admissions among people 65+ related to multimorbidity, municipal and outpatient care. Arch Gerontol Geriatr. 2008;46(1):41–55 [DOI] [PubMed] [Google Scholar]
- 31.Thorpe KE, Howard DH. The rise in spending among Medicare beneficiaries: the role of chronic disease prevalence and changes in treatment intensity. Health Aff (Millwood). 2006;25(5):w378–w388 [DOI] [PubMed] [Google Scholar]
- 32.Barnett K, Mercer SW, Norbury M, Watt G, Wyke S, Guthrie B. Epidemiology of multimorbidity and implications for health care, research, and medical education: a cross-sectional study. Lancet. 2012;380(9836):37–43 [DOI] [PubMed] [Google Scholar]
- 33.Bayliss EA, Ellis JL, Shoup JA, Zeng C, McQuillan DB, Steiner JF. Association of patient-centered outcomes with patient-reported and ICD-9-based morbidity measures. Ann Fam Med. 2012;10(2):126–133 [DOI] [PMC free article] [PubMed] [Google Scholar]
- 34.Stein RE, Jessop DJ. What diagnosis does not tell: the case for a noncategorical approach to chronic illness in childhood. Soc Sci Med. 1989;29(6):769–778 [DOI] [PubMed] [Google Scholar]
- 35.van der Lee JH, Mokkink LB, Grootehuis MA, Heymans HS, Offringa M. Definitions and measurements of chronic health conditions in childhood: a systematic review. JAMA. 2007;297(24):2741–2751 [DOI] [PubMed] [Google Scholar]


