Abstract
Background
Atelectasis is a major cause of hypoxemia after coronary artery bypass grafting (CABG) and is commonly ascribed to general anesthesia, high inspiratory oxygen concentration and cardiopulmonary bypass (CPB). The objective of this study was to evaluate the role of heart-induced pulmonary compression after CABG with CPB.
Methods
Seventeen patients without pre-operative cardiac failure who were scheduled for coronary artery bypass graft underwent pre- and postoperative thoracic computed tomography. The cardiac mass, the pressure exerted on the lungs by the right and left heart and the fraction of collapsed lower lobe segments below and outside of the heart limits were evaluated on a computed tomography section 1 cm above the diaphragmatic cupola.
Results
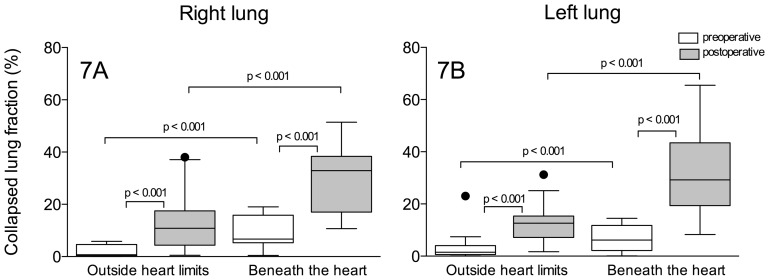
In the postoperative period, cardiac mass increased by 32% (117±31 g versus 155±35 g, p<0.001), leading to an increase in the pressure that was exerted on the lungs by the right (2.2±0.6 g.cm−2 versus 3.2±1.2 g.cm−2, p<0.05) and left heart (2.4±0.7 g.cm−2 versus 4.2±1.8 g.cm−2, p<0.001). The proportion of collapsed lung segments beneath the heart markedly increased [from 6.7% to 32.9% on the right side (p<0.001) and from 6.2% to 29% on the left side (p<0.001)], whereas the proportion of collapsed lung segments outside of the heart limits slightly increased [from 0.7% to 10.8% on the right side (p<0.001) and from 1.5% to 12.6% on the left side (p<0.001)].
Conclusion
The pressure that is exerted by the heart on the lungs increased postoperatively and contributed to the collapse of subjacent pulmonary segments.
Introduction
Atelectasis is a highly prevalent pulmonary complication in patients undergoing cardiac surgery with cardiopulmonary bypass (CPB) and an important cause of postoperative hypoxemia. [1]–[3] Pulmonary collapse occurs early after the induction of anesthesia and persists for several days postoperatively. [4]–[7] Studies based on thoracic computed tomography (CT) have shown that pulmonary collapse is mainly distributed to the dependent regions close to the diaphragm and may encompass up to 35% of the overall lung parenchyma. [2], [8]–[10] Some mechanisms have been proposed to explain the pulmonary collapse in patients undergoing cardiac surgery, such as the use of high inspiratory oxygen fraction, [11] cephalic displacement of the relaxed diaphragm compressing the caudal portions of the lower lobes, [12], [13] surgical manipulation of pulmonary structures and depressurization of the respiratory system during CPB to enable better visualization of the surgical field. However, despite the fact that most of the mechanisms leading to intraoperative pulmonary collapse vanish when patients awake and resume spontaneous breathing, postoperative atelectasis and hypoxemia may persist for several days [5], [14].
Little is known about the contribution of heart-induced pulmonary compression to the development and perpetuation of dependent pulmonary atelectasis following cardiac surgery with CPB. In the supine position, large segments of the lower lobes are located beneath the heart [15], and previous reports have described the mechanical compression of the airways by an enlarged left atrium in neonates, infants and adult patients, leading to extended atelectasis. [16]–[18] Furthermore, radioisotopic ventilation–perfusion studies have demonstrated reduced lower lobe ventilation in patients with cardiomegaly [19], [20], a phenomenon that is reversible with prone positioning. [21] This result is highly suggestive of airway closure or narrowing or alveolar collapse. Using quantitative thoracic CT analysis, Malbouisson et al. demonstrated that the pressure exerted by the cardiac mass on the lower lobes was implicated in the regional loss of pulmonary aeration in patients with acute respiratory distress syndrome (ARDS) [15].
In patients undergoing coronary artery bypass, systemic inflammatory response, positive fluid balance and cardiac wall edema may contribute to an increase in the weight of the heart, thereby augmenting heart-induced pulmonary compression. The objective of this study was to evaluate the contribution of the cardiac mass to postoperative atelectasis in patients undergoing coronary artery bypass grafting (CABG) with CPB.
Methods
This study was approved by an institutional ethics committee (Comissão de Ética para Análise de Projetos de Pesquisa do Hospital das Clínicas da Faculdade de Medicina da Universidade de São Paulo – CAPPESq - number 756/06), and informed consent was obtained from all participants after the study protocol was fully explained. Twenty patients who were scheduled for surgical treatment of coronary artery disease were included in this prospective study. All patients had normal preoperative left ventricular function, characterized by ejection fractions greater than 50%, and were submitted to pre- and postoperative whole-lung CT scans. Exclusion criteria were as follows: chronic obstructive pulmonary disease, preoperative pulmonary congestion, the need for any form of positive pressure ventilator support in the first postoperative day, transfusion of more than 3 packed red cell units and perioperative hemodynamic instability requiring vasopressors.
Perioperative Patient Care, Hemodynamics and Blood Gas Measurements
General anesthesia was induced with fentanyl, etomidate and atracurium and was maintained with isoflurane, fentanyl and pancuronium bromide. During the surgical procedure, patients were monitored with electrocardiography, capnography, pulse oximetry, esophageal temperature and an invasive arterial pressure line. After anesthesia induction, a fiberoptic thermodilution pulmonary artery catheter (CCO/SvO2/VIPTMTD catheter - Edwards Lifesciences, Irvine, CA, USA) was placed through the right internal jugular vein. Mechanical ventilator settings throughout the study were as follows: 1) tidal volume of 8 mL.kg−1; 2) respiratory rate to maintain PaCO2 values between 35 and 40 mmHg; 3) inspiratory time of 33% of the total respiratory cycle time; 4) inspired oxygen fraction of 0.6; and 5) positive end-expiratory pressure (PEEP) of 5 cmH2O.
Before vascular cannulation, 400 U.kg−1 of heparin was administered intravenously. Aortic bi-caval CPB was performed using an extracorporeal circuit and a membrane oxygenator (Braile, São José do Rio Preto, SP, Brazil) that was primed with 1500 mL of lactated Ringer solution, mannitol 1 g.kg−1 and heparin 10,000 UI. Cardiac protection was achieved using hypokalemic, hypothermic blood cardioplegia solution. During CPB, mechanical ventilation was stopped. Coronary grafts were performed at the discretion of the surgeon. Vasoactive drugs were infused to facilitate CPB weaning according to the attending anesthesiologist’s decision. When mechanical ventilation was resumed at the end of CPB, a lung recruitment maneuver was performed using an airway pressure of 30 cmH2O, which was applied for 15 seconds. The aim was to fully re-expand the lungs that had collapsed following interruption of the mechanical ventilation and surgical manipulations.
In the intensive care unit (ICU), patients were allowed to wake up and were extubated as soon as they could spontaneously breathe with a respiratory rate <30.min−1 and maintain a PaO2>80 mm Hg at FiO2 0.4 and a spontaneous tidal volume >5 mL.kg−1. After extubation, oxygen was supplemented to the patients with a Venturi mask that delivered known oxygen concentrations. Postoperative pain was prevented by tramadol combined with morphine boluses whenever necessary. Non-invasive positive pressure ventilation was not used postoperatively. According to institutional standard care protocol, hemodynamic measurements, including analysis of the arterial and venous blood samples, were performed after intubation, after CPB, at ICU admission and 24 h after surgery. In addition, a baseline arterial blood sample was collected before anesthesia induction.
Thoracic CT Scan Protocol
Acquisition of the CT sections
On the day before surgery, a fast spiral thoracic CT scan (Toshiba Aquillion 16 CT scanner, Toshiba Medical Division Japan) was obtained. Thoracic CT scanning was performed from the apex to the diaphragm, and the exposures were taken at 120 kV and 250 mAs. During image acquisition, the patients were asked to hold their breath at the end of a normal expiration for 15 to 20 seconds to acquire the volumetric CT images at functional residual capacity. To reach this specific respiratory condition, the patients were instructed about the respiratory hold maneuver and repeated it at least 10 times before thoracic CT scanning. During the entire procedure, electrocardiography, non-invasive arterial pressure and pulse oximetry were monitored using a Philips M3 transport monitor (Philips, Eindhoven, The Netherlands). A second CT was obtained in the same respiratory condition during the first postoperative day, approximately 24 h following admission in the ICU and extubation. All volumetric tomographic studies were reconstructed by the CT scan console as 10-mm-thick contiguous Digital Imaging and Communications in Medicine (DICOM) images. Images were recorded in the hospital’s Picture Archiving and Communication System and were transferred to a personal computer for quantitative CT image analysis.
Measurement of Thoracic and Cardiac Dimensions
The sternovertebral distance, the maximal thoracic transverse distance and the left and right anteroposterior sagittal distances were measured using the caliper tool of a software program designed to analyze radiological DICOM images (Osiris 4.19, HUG, Geneva, Switzerland) in each individual 10-mm-thick CT section (figure 1A). Left and right cephalocaudal thoracic dimensions were measured by counting the number of 10-mm-thick CT sections that were reconstructed from the pulmonary apex to the diaphragm. In the CT sections located 1, 2 and 3 cm above the diaphragm, the maximal horizontal diameters of the cardiac silhouette and of the right and left cardiac protrusions, defined as the segments of the cardiac silhouette located above the left and right lower lobes, were measured, as shown in figure 1B.
Figure 1. Figure shows a schematic representation of the CT image parameters analyzed.
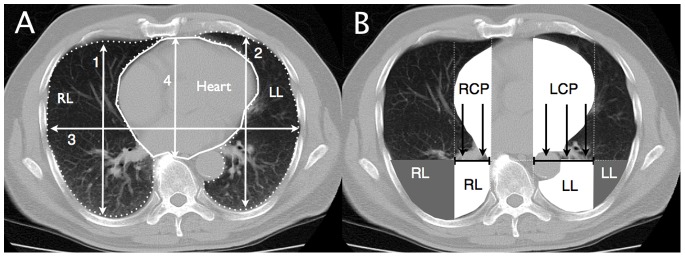
Panel A shows rib cage dimensions (numbered white arrows), cardiac silhouette (continuous white line contour) and lung boundaries (dotted white line contours) on a representative CT section located 1 cm above the diaphragm. Numbers 1 and 2 identify right and left anteroposterior sagittal distances, number 3 the maximal thoracic transverse distance, number 4 the sternovertebral distance and number 5 the cardiac transverse diameter (dashed line). Panel B shows a schematic representation of the orthogonal pressure (black arrows) exerted by the left (LCP) and right (RCP) cardiac protrusions (white cardiac segments) on subjacent surface (tipped black solid lines) of lower lobes located beneath the heart (white lung areas). Parts of lower lobes located outside of heart limits are represented in gray.
Assessment of Regional Pulmonary Volume and Lung Tissue Mass Present in the CT Section Located 1 cm above the Diaphragm
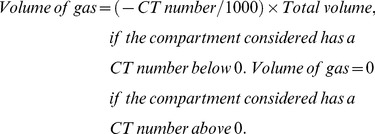
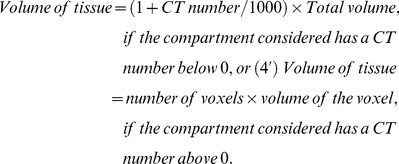
On the CT section located 1 cm above the diaphragm, the volumes of gas and tissue of the left and right lungs were analyzed as described previously. 15,22 Briefly, after manually delineating the external boundaries of the left and right lung parenchyma using the Osiris software (figure 1A), pixels contained within each pulmonary region of interest were distributed on 1200 compartments according to their X-ray attenuation coefficient (CT number). For each pixel, the CT number represents the attenuation coefficient of the X-ray by the structure being studied minus the attenuation coefficient of water, divided by the attenuation coefficient of water expressed in Hounsfield units (HU). For each compartment of a known CT number, the volume and mass were computed according to the following formulas:
| (1) |
| (2) |
 |
(3) |
 |
(4) |
| (5) |
Lung tissue mass and pulmonary volumes of each CT section or region of interest were computed by adding all of the partial masses and volumes of the compartments that were present within the CT section. The calculation of the mass is based on the tight correlation existing between radiological and physical densities. [15], [22] The distribution of lung aeration within each CT section or region of interest used the following classification: 1) hyperinflated regions characterized by CT numbers between −1000 HU and −900 HU [23], 2) normally aerated regions characterized by CT numbers between −900 HU and −500 HU [24], 3) poorly aerated regions characterized by CT numbers between −500 HU and −100 HU and 4) non aerated regions characterized by CT numbers between −100 and +100 HU) [25], [26].
Determination of Volume and Mass of the Heart and the Pressure Exerted by the Heart over the Subjacent Lung Segments
The volume and mass of the heart were determined on the CT section located 1 cm above the diaphragm using the same method as described in the previous section. In the first step, the entire cardiac silhouette was manually delineated, as shown in figure 1. The pixels within this area were distributed along 256 compartments located between −100 HU and 200 HU, each compartment representing a 1-HU interval. The volume and mass of the heart were computed by adding partial masses and volumes of the measured compartments, according to formulas 4 and 5.
In a second step, the volume and the mass of the left and right cardiac protrusions located above the lungs in the supine position were determined (figure 1). The mean pressure that was exerted by the heart on the subjacent segments of the lower lobes was obtained by dividing the mass of the cardiac areas located above the left and right lower lobes by the linear surface corresponding to the maximal width of each cardiac protrusion. The delineations performed in the preoperative CT images were transposed to the postoperative images, and anatomical landmarks defining the delineation, such as vessels and bronchi, were checked to ensure that the same lung segments were enclosed in the given region of interest.
Evaluation of the Impact of Pressure Exerted by the Cardiac Segments on the Subjacent Pulmonary Segments
To evaluate the influence of the pressure exerted by each cardiac protrusion on the subjacent pulmonary segments, the lowermost parts of the left and right lungs were divided into two segments, as shown in the left panel of figure 1: 1) the pulmonary segment below the heart, shown as the white areas below the cardiac protrusions, and 2) the pulmonary segment outside of the heart limits, shown as the gray areas (figure 1). The role played by heart-induced mechanical compression was assessed by comparing the aeration of pulmonary regions within and outside the heart limits. In each region, the volume of gas and tissue and the distribution of aeration were computed using the same approach as described in the section “Analysis of the pulmonary volumes and mass on the CT image located 1 cm above the diaphragm”.
To account for the increase in lung weight secondary to high-permeability type postoperative pulmonary edema [2], [27], the aeration of pulmonary segments located below the heart and outside of the heart limits in the pre- and postoperative thoracic CT scans was expressed as the fraction of non-aerated to overall region lung mass.
Statistical Analysis
The sample size was calculated to detect a 30% postoperative increase in the mean pressure exerted by the heart on the lower lobes compared to the preoperative values, assuming a standard deviation of 30% of the mean, with a p-value less than 0.05 and a power of 0.90 (Heinrich-Heine-Universitat Dusseldorf, Dusseldorf, Germany). All variables were tested for normal distribution using Kolmogorov-Smirnov, D’Agostino and Pearson omnibus normality and Shapiro-Wilk tests. Hemodynamic and metabolic measurements were examined over time using one-way analysis of variance for repeated measures. The overall cardiac mass, different pulmonary volumes and masses of the left and right lungs and the left and right lower lobe segments located beneath and outside of the heart protrusion limits were compared in the preoperative and postoperative CT images using a paired Student T test or the Wilcoxon matched-pairs signed-rank test when indicated. The cardiac and thoracic dimensions, the mass and the pressure exerted by the left and right cardiac protrusions on the subjacent pulmonary parenchyma were compared between pre- and postoperative moments using a two-way analysis of variance for repeated measures. Because the collapsed pulmonary parenchyma fraction was not normally distributed, the comparison between the lower lobe segments located beneath and outside of the heart protrusion limits during pre- and postoperative moments was performed using the Wilcoxon matched-pairs signed-rank test. The post-hoc analysis following the analysis of variances was performed using the Bonferroni method. The statistical analysis was performed using the SPSS 20 statistical package (SPSS Inc., Chicago, IL, USA). All of the parametric data were expressed as means ± SD, unless otherwise specified. Boxplot whiskers were plotted according to the Tukey method. [28] The statistical significance level was fixed at 0.05.
Results
Clinical Characteristics of Patients
From the 20 patients who were initially enrolled in the study, 3 were excluded due to the presence of respiratory motion artifacts on CT scans that rendered an accurate analysis impossible. Individual characteristics of the 17 patients who were enrolled in the study are presented in table 1. During the intraoperative period, the patients received 4.227±1.039 mL of crystalloids and 909±202 mL of 6% hydroxyethil starch solution. From the total fluid infused intraoperatively, 2.433±1.806 mL was given during CPB. Dobutamine (8±3 µg.kg−1. min) was infused in 15 patients to facilitate CPB weaning and was stopped within 12 hours. In the first postoperative 24 hours, a mean volume of 1550±257 mL crystalloid solution was administered.
Table 1. Individual characteristics of the patients undergoing Coronary Artery Bypass Graft with Cardiopulmonary Bypass.
| Subjects | Age (y) | Gender | Height (cm) | Weight (kg) | LVEF (%) | CPB duration (min) | Surgery duration (min) |
| 1 | 48 | M | 162 | 66 | 62 | 110 | 450 |
| 2 | 50 | M | 175 | 78 | 55 | 96 | 390 |
| 3 | 51 | F | 185 | 112 | 50 | 100 | 360 |
| 4 | 62 | M | 170 | 70 | 73 | 125 | 370 |
| 5 | 77 | M | 171 | 90 | 70 | 100 | 330 |
| 6 | 65 | M | 170 | 72 | 57 | 142 | 350 |
| 7 | 57 | M | 170 | 81 | 50 | 82 | 315 |
| 8 | 49 | M | 154 | 74 | 55 | 80 | 350 |
| 9 | 74 | F | 180 | 89 | 50 | 75 | 330 |
| 10 | 73 | M | 165 | 75 | 78 | 45 | 375 |
| 11 | 61 | F | 164 | 62 | 50 | 110 | 360 |
| 12 | 72 | M | 165 | 83 | 55 | 90 | 415 |
| 13 | 61 | M | 172 | 72 | 60 | 50 | 325 |
| 14 | 71 | M | 172 | 74 | 69 | 95 | 318 |
| 15 | 52 | M | 158 | 63 | 58 | 93 | 420 |
| 16 | 70 | M | 153 | 70 | 57 | 78 | 360 |
| 17 | 56 | F | 167 | 70 | 70 | 100 | 360 |
Definition of abbreviations: LVEF = left ventricular ejection fraction; M = male; F = female; CPB = cardiopulmonary bypass.
As shown in table 2, there were significant increases in the cardiac index and heart rate during the observation period, while the mean arterial pressure (MAP) transiently decreased after CPB. Central venous and pulmonary capillary wedge pressures and the pulmonary vascular resistance index remained within the normal limits. Twenty-four hours following surgery, the systemic vascular resistance index was significantly lower than the baseline measurement. Serum lactate concentrations were slightly significantly elevated after the end of CPB, but they returned to baseline levels during the first postoperative day. Induction of general anesthesia induced a reduction in the PaO2/FiO2 ratio that reached its nadir after CPB and returned to post-anesthesia conditions by the 24th postoperative hour, but it remained significantly lower than preoperative values (table 2). All of the patients were extubated within 8 hours from ICU admission. None of the patients developed respiratory failure after extubation, and all were discharged from the ICU to the ward within 72 hours and from the hospital within 10 days after surgery.
Table 2. Hemodynamic and metabolic profiles during surgery and in the first 24 postoperative hours.
| Preoperative | After anesthesia | After CPB | ICU admission | ICU 24 h | p value | |
| HR (bpm) | – | 69±20 | 98±17* | 98±20* | 98±15* | <0.001 |
| MAP (mmHg) | – | 74±9 | 66±8* | 84±15 | 81±9 | <0.001 |
| MPAP (mmHg) | – | 25±6 | 27±7 | 25±7 | 23±6 | 0.16 |
| CVP (mmHg) | – | 14±6 | 16±6 | 14±5 | 12±4 | 0.17 |
| PAOP (mmHg) | – | 16±4 | 17±5 | 15±5 | 15±4 | 0.17 |
| CI (L.min−1.m2) | – | 2.5±0.8 | 3.9±1.4* | 3.2±1.1* | 3.9±0.7* | 0.003 |
| SVRi (dyn.s.cm−5.m2) | – | 2090±667 | 1255±627* | 1944±676 | 1499±323* | <0.001 |
| PVRi (dyn.s.cm−5.m2) | – | 312±220 | 225±158 | 239±129 | 168±93 | 0.09 |
| PaO2/FiO2 | 403±36 | 307±85# | 230±88* # | 265±66* # | 295±44# | <0.001 |
| SvO2 (%) | – | 80±6 | 78±10 | 74±11 | 69±7 | 0.09 |
| Lactate (mg.mL−1) | 12.4±3.4 | 14.2±3.2 | 37.4±20.3* # | 36.2±27* # | 16±6.5 | <0.001 |
Definition of abbreviations: CI = cardiac index; CPB = cardiopulmonary bypass; CVP = central venous pressure; HR = heart rate; MAP = mean arterial pressure; MPAP = mean pulmonary artery pressure; PAOP = pulmonary artery occlusion pressure; PVRi = pulmonary vascular resistance index; SVRi = systemic vascular resistance index. Normal values for lactate <18 mg.dL−1. Data are expressed as mean ± standard deviation. The variables were compared by means of one-way ANOVA for repeated measures.
means p<0.05 compared to after anesthesia.
#means p<0.05 compared to preoperative period.
Effects of Surgery on Thoracic and Cardiac Dimensions
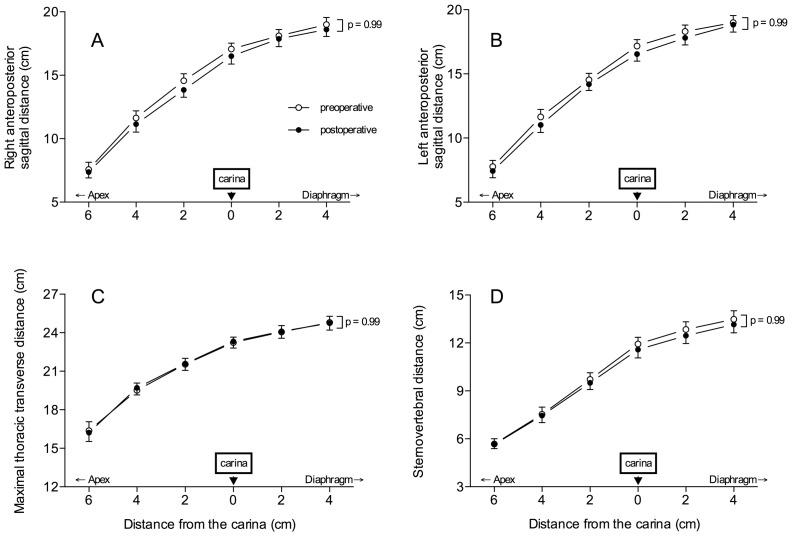
As shown in figure 2, sternovertebral, maximal transverse and anteroposterior sagittal dimensions of the rib cage did not change between pre- and postoperative periods. As previously demonstrated, [29], [30] the cephalocaudal distance between the apex and the diaphragm was greater in the left hemi-thorax than in the right hemi-thorax (p = 0.001). However, these dimensions did not vary between pre- and postoperative periods (figure 3).
Figure 2. Right and left sagittal distances (panels A and B), maximal thoracic transverse distance (panel C) and sternovertebral distance (panel D) measured on 6 CT sections before (open circles) and after surgery (closed circles).
Data are expressed as mean ± SEM.
Figure 3. Cephalocaudal dimensions of the lungs (distance from pulmonary apex to the diaphragmatic cupola) measured on 6 CT sections before (open bars) and after surgery (black bars).
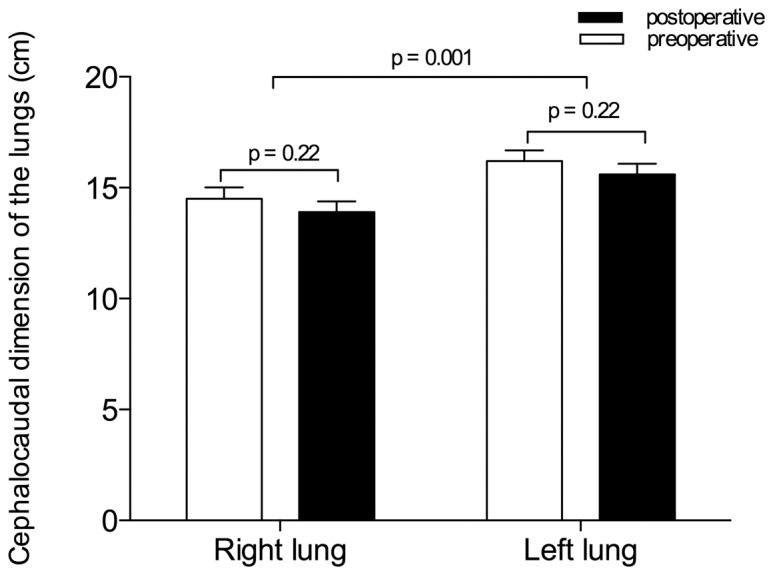
Data are expressed as mean ± SEM.
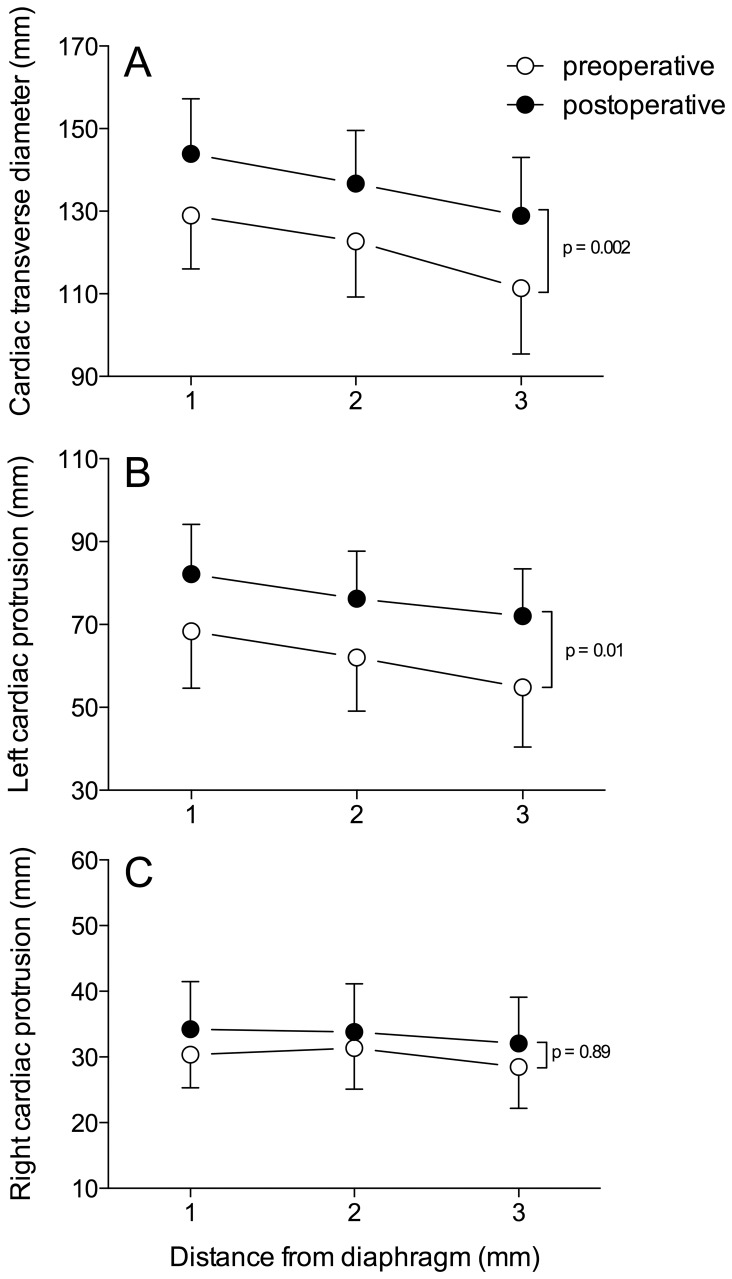
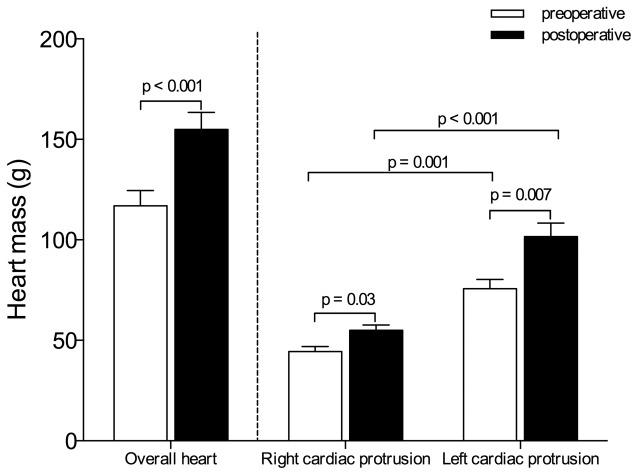
As illustrated in figure 4, cardiac dimensions significantly increased between pre- and postoperative periods. The transverse cardiac and left cardiac protrusion diameters, measured in 3 contiguous CT sections above the diaphragm, increased when compared to preoperative values (p = 0.002). As shown in figure 5, the postoperative overall heart and the right and left cardiac protrusion masses increased by 32%, 22% and 34%, respectively, when compared to preoperative values (p<0.05). The cardiac protrusion mass was significantly greater on the left than on the right side before and after surgery (p<0.01). Following surgery, the proportion of increase was similar on both sides.
Figure 4. Maximal transverse cardiac distance (panel A), left cardiac protrusion (panel B) and right cardiac protrusion (panel C) measured on 3 CT sections before (open circles) and after surgery (closed circles).
Data are expressed as mean ± SEM.
Figure 5. Overall heart, right cardiac protrusion and left cardiac protrusion masses computed before (open bars) and after surgery (black bars).
Data are expressed as mean ± SEM.
Changes in Lung Morphology Resulting from Cardiac Surgery
Following CABG with CPB, 32% and 28% decreases in gas volume of right and left lungs (p = 0.001) were measured on the CT section located 1 cm above the diaphragm (table 3). This decrease was associated with 47% and 59% increases in tissue volume (p<0.001). As a result of these opposite changes, no significant variations were observed in the overall volumes of the right and left lungs. Increases in parenchymal mass were measured in the non-aerated and poorly aerated compartments (p<0.001), while the mass of normally aerated parenchyma decreased.
Table 3. Overall gas and tissue volumes and mass of right and left lungs measured on the CT section located 1 cm above the diaphragm.
| Before surgery | After surgery | p value | ||
| Overall volume (mL) | Right lung | 115±34 | 105±39 | 0.2 |
| Left lung | 116±35 | 114±34 | 0.69 | |
| Tissue volume (mL) | Right lung | 35±10 | 51±16 | <0.001 |
| Left lung | 34±9 | 54±15 | <0.001 | |
| Gas Volume (mL) | Right lung | 80±28 | 54±28 | <0.001 |
| Left lung | 83±30 | 60±30 | 0.001 | |
| Overall parenchyma mass (g) | Right lung | 35±10 | 52±16 | <0.001 |
| Left lung | 34±9 | 54±15 | <0.001 | |
| Non-aerated parenchyma mass (g) | Right lung | 4±6 | 20±11 | <0.001 |
| Left lung | 3±3 | 23±16 | <0.001 | |
| Poorly-aerated parenchyma mass (g) | Right lung | 8±5 | 13±4 | 0.004 |
| Left lung | 9±7 | 13±6 | 0.04 | |
| Normally-aerated parenchyma mass (g) | Right lung | 23±7 | 18±8 | 0.03 |
| Left lung | 23±8 | 18±8 | 0.04 | |
| Hyperinflated parenchyma mass (g) | Right lung | 0.1 (0–0.6) | 0 (0–0.2) | 0.08 |
| Left lung | 0.1 (0–0.7) | 0 (0–0.2) | 0.35 |
Data are expressed as mean ± SD or as median (25%–75%). Comparisons were performed by means of paired Student’s t test or Wilcoxon matched-pairs signed rank test when indicated.
Impact of Heart-induced Mechanical Compression on the Aeration of Lower Lobes
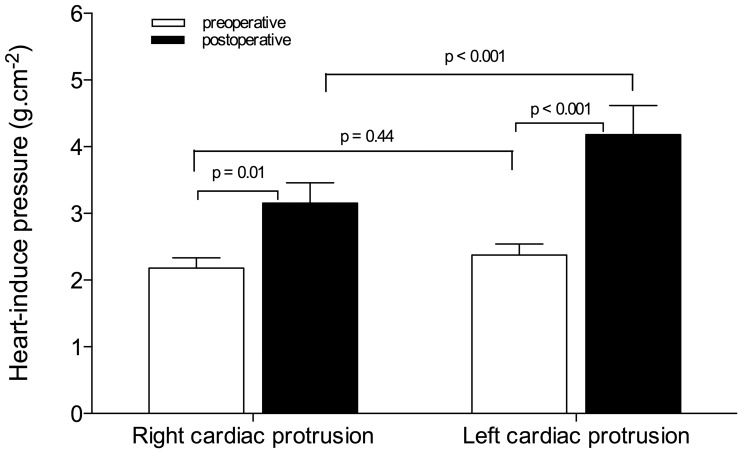
As shown in figure 6, the pressures that were exerted by the right and left heart on subjacent lower lobes before surgery were similar (2.2±0.6 g.cm2 and 2.4±0.7 g.cm2, respectively). During the first postoperative day, the pressures that were exerted by the right and left cardiac protrusions on the lower lobes increased by 45% and 75%, respectively (p<0.05). The cardiac protrusion-induced pressure was significantly greater in the left than in the right side. Tables 4 and 5 show changes in lung morphology observed in the right and left lower lobe segments located below the cardiac protrusions and outside of the heart limits. Following surgery, the tissue volumes significantly increased in the pulmonary segments below the heart and outside of the heart limits, while the gas volumes significantly decreased in the right and left lower lobes. The normally aerated compartment only decreased significantly in pulmonary segments that were located below the cardiac protrusions; it remained unchanged in the pulmonary segments outside of the heart limits.
Figure 6. Pressure exerted by the right and left cardiac protrusion masses on subjacent lower lobes measured before (open bars) and after surgery (black bars).
Data are expressed as mean ± SEM.
Table 4. Overall, gas and tissue volumes and mass of right lower lobe segments below and outside of the heart limits measured on the CT section located 1 cm above the diaphragm.
| Before surgery | After surgery | p value | ||
| Overall volume (mL) | Below | 32±11 | 35±15 | 0.39 |
| Outside | 51±27 | 43±26 | 0.16 | |
| Tissue volume (mL) | Below | 13±6 | 22±7 | <0.001 |
| Outside | 14±7 | 19±12 | 0.04 | |
| Gas Volume (mL) | Below | 19±7 | 38±22 | 0.01 |
| Outside | 13±11 | 24±16 | 0.008 | |
| Overall parenchyma mass (g) | Below | 13±6 | 22±7 | <0.001 |
| Outside | 14±7 | 19±12 | 0.004 | |
| Non-aerated parenchyma mass (g) | Below | 2±2 | 12±6 | <0.001 |
| Outside | 1±1 | 6±7 | <0.001 | |
| Poorly-aerated parenchyma mass (g) | Below | 4±3 | 6±2 | 0.005 |
| Outside | 2±2 | 4±2 | 0.02 | |
| Normally-aerated parenchyma mass (g) | Below | 7±3 | 4±4 | 0.02 |
| Outside | 10±5 | 9±5 | 0.24 | |
| Hyperinflated parenchyma mass (g) | Below | 0 (0–0) | 0 (0–0) | 0.35 |
| Outside | 0 (0–0.3) | 0 (0–0) | 0.1 |
Data are expressed as mean ± SD or as median (25%–75%). Comparisons were performed by means of paired Student’s t test or Wilcoxon matched-pairs signed rank test when indicated.
Table 5. Overall gas and tissue volumes and mass of left lower lobe segments below and outside of the heart limits measured on the CT section located 1 cm above the diaphragm.
| Before surgery | After surgery | p value | ||
| Overall volume (mL) | Below | 35±18 | 34±16 | 0.88 |
| Outside | 54±21 | 49±21 | 0.22 | |
| Tissue volume (mL) | Below | 13±5 | 24±13 | 0.001 |
| Outside | 16±8 | 21±9 | 0.04 | |
| Gas Volume (mL) | Below | 22±14 | 10±7 | 0.007 |
| Outside | 38±16 | 28±15 | 0.002 | |
| Overall parenchyma mass (g) | Below | 13±5 | 24±13 | 0.001 |
| Outside | 16±8 | 21±9 | 0.04 | |
| Non-aerated parenchyma mass (g) | Below | 2±2 | 15±12 | <0.001 |
| Outside | 1±2 | 6±6 | 0.002 | |
| Poorly-aerated parenchyma mass (g) | Below | 3±2 | 6±3 | 0.03 |
| Outside | 3±3 | 5±4 | 0.08 | |
| Normally-aerated parenchyma mass (g) | Below | 7±4 | 3±3 | 0.001 |
| Outside | 12±5 | 9±5 | 0.16 | |
| Hyperinflated parenchyma mass (g) | Below | 0 (0–0) | 0 (0–0) | 0.39 |
| Outside | 0 (0–0.1) | 0 (0–0) | 0.12 |
Data are expressed as mean ± SD or as median (25%–75%). Comparisons were performed by means of paired Student’s t test or Wilcoxon matched-pairs signed rank test when indicated.
As displayed in figure 7, the fractions of non-aerated to overall pulmonary parenchymal masses of the right and left lower lobe segments located beneath the heart were significantly greater than in the segments located outside of the heart limits, before and after surgery. In the postoperative period, the fractions of the collapsed lung parenchyma increased by 22.1% and 16.6% in the right and left respective segments of the lower lobes beneath the heart. In pulmonary segments located outside of the heart limits, the increases in the collapsed lung fraction were significantly less, reaching 6% and 4.7%, respectively.
Figure 7. Fraction of non-aerated to overall parenchyma mass of right and left lower lobe segments located beneath the heart and outside of the heart limits before (open box-plots) and after surgery (gray box-plots).
The bottom and top of the box are the lower and upper quartiles, respectively and the horizontal line within the box is the median. The whiskers represent 1.5 times the quartiles according to Tukey method.
Discussion
This study describes several original findings: (1) CABG with CPB induced a 5-fold increase in collapsed lung parenchyma, accounting for 38% and 42% of the preoperative masses of the right and left lungs, respectively; (2) concomitantly, gas volumes of the right and left lungs decreased by 32% and 28%, respectively, whereas tissue volumes increased by 47% and 59%; (3) following surgery, the masses of the right and left heart increased by 22% and 34%, respectively, significantly increasing the orthogonal pressure exerted on subjacent lower lobes; (4) the fractions of atelectasis increased by 22% in lung segments located beneath the right cardiac chambers and by 6% in lung segments outside of the right heart limits; (5) the fractions of atelectasis increased by 17% in lung segments located beneath the left ventricle and by 5% in lung segments outside of the left heart limits; and (6) postoperative changes in lung morphology were associated with a 27% decrease in arterial oxygenation.
Postoperative Loss of Lung Aeration
Immediate postoperative reduction of pulmonary aeration leading to hypoxemia is a highly prevalent pulmonary complication in patients undergoing CABG with CPB [4], [5], [31]–[33] and may persist for days. [3] CABG-induced atelectasis is mainly located in dependent regions close to the diaphragm. [14], [31], [32] Its extension can reach up to 35% of the overall lung parenchyma, depending on the method used for quantification. [1], [2], [8], [9] Several mechanisms have been proposed to explain the loss of pulmonary aeration following cardiac surgery: (1) the compression of caudal pulmonary segments by the weight of the abdominal content, shifting the relaxed diaphragm within the rib cage;[12] (2) absorption atelectasis resulting from the administration of a high inspired oxygen fraction;[7], [33], [34] (3) disconnection from mechanical ventilation and deflation of the lungs to facilitate surgical field exposure; and (4) surgical manipulation of intrathoracic structures. In the postoperative period, once the patient is awake and spontaneously breathing, lung collapse persists and hypoxemia worsens, although most of these mechanisms cannot be implicated. Hypoxemia reaches its nadir on the third postoperative day and remains insensitive to pain relief. [3] Therefore, other mechanisms are likely involved to explain the long-lasting postoperative hypoxemia. This study provides compelling evidence that heart compression through an increased cardiac mass plays a critical role.
Most of the previous CT studies on pulmonary alterations after CABG focused on the amount of postoperative atelectasis, ignoring postoperative alterations affecting pulmonary structures and intrathoracic organs that are anatomically related to the lungs. Recently, we reported that pulmonary tissue mass significantly increased during the postoperative period due to the accumulation of lung water in the interstitial space. The excess of lung mass that is related to CPB-induced high-permeability interstitial lung edema [35], [36] increases pleural pressure in dependent lung regions and likely plays a role in postoperative lung collapse. A similar mechanism has been described in ARDS patients: the superimposed hydrostatic pressure resulting from the increase in pulmonary tissue mass causes a progressive antero-posterior decrease in gas/tissue ratio [24], [37].
Postoperative Increase in Cardiac Mass
If the excess lung tissue mass largely contributes to the vertical gradient of pulmonary aeration, it does not explain why the fraction of collapsed lung is greater in the lower lobe segments located beneath the heart than in the segments located outside of the cardiac limits. In fact, both areas are subjected to the same transpulmonary pressure and should be characterized by similar aeration. Physiologically, the pressure that is exerted by the heart on the lower lobes impacts regional aeration. [38], [39] Hyatt and coworkers reported that the physiological vertical gradient of transpulmonary pressure, which increases in dependent lung regions, was significantly amplified when the weight of the heart was increased by replacing blood with an equal volume of mercury in head-up dogs. [40] Such a mechanism was further confirmed in patients with cardiomegaly who were lying supine; left lower lobe ventilation was reduced by 40–50% without a concomitant reduction in regional perfusion. [21], [41] In patients with ARDS, we observed that the heart volume and mass were increased, and the heart exerted a significantly higher pressure on the lower lobes compared to normal subjects. As a result, aeration was virtually absent in segments of the lower lobes subjacent to the heart, whereas segments outside of the heart limits remained partially aerated. [15] In patients undergoing CABG, cardiac mass increased significantly in the postoperative period, and the pressures resulting from left and right cardiac protrusion increased, likely causing lung collapse of the pulmonary segments beneath the heart.
Two main mechanisms may explain the increase in cardiac mass after CABG. First, per-operative fluid loading increases both the volumes of the cardiac chambers and the cardiac index during the postoperative period. During the study period, patients received 6686 mL to compensate for fluid restriction that resulted from preoperative fasting and priming of the CPB circuit. Second, CPB and myocyte ischemia, resulting from cardioplegic arrest, induce an inflammatory reaction that increases microvascular permeability, impair myocardial lymphatic function and produce lung and myocardial interstitial edema. [42]–[44] Very likely, the increased cardiac mass observed during the postoperative period results from a combination of both mechanisms, which may vary in importance from one patient to another. Whatever mechanisms are involved, the higher pressure that is exerted by the increased cardiac mass on the lung regions beneath the heart likely explains the long-lasting loss of lung aeration during the postoperative period.
Methodological Limitations
Some factors may introduce bias and reduce the accuracy of the CT assessment of lung aeration, heart mass and cardiac dimensions. The moment of the respiratory cycle at which the patient holds their breath determines the amount of gas present within the lungs during CT section acquisition and may impact the assessment of lung aeration. To avoid respiratory motion artifacts and changes in lung aeration resulting from CT acquisition at different lung volumes, patients were preoperatively trained to hold their breath for 15 seconds after a normal expiration. However, 3 patients breathed during postoperative CT section acquisition, rendering the analysis of the lung aeration changes impossible. Reproducible conditions of CT acquisition between pre- and postoperative periods are indirectly confirmed by the unchanged antero-posterior, sagittal and transverse dimensions of the rib cage before and after surgery.
Another source of error concerns the method that was used to calculate the pressure that is exerted by the heart on the lower lobes. Cardiac protrusion mass was divided by the subjacent linear surface that delimited the upper limit of the lung segments beneath the heart. This method of calculating cardiac superimposed pressure is rough and ignores non-orthogonal forces exerted by the heart on the pulmonary surface. The method also ignores the influence of the heart beats on lung compression. Cardiac dimensions and masses that are reported in this study were measured at different moments of the cardiac cycle and are representative of “mean” values across the cardiac cycle. As a consequence, the respiratory effects of cardiogenic oscillations and their impacts on lung aeration cannot be taken into account [45].
Lastly, the studied population comprised uncomplicated, spontaneously breathing patients who were free of ARDS or abdominal complications. It is highly likely that the presence of such complications would have amplified the loss of lung aeration resulting from cardiac compression, as previously demonstrated [15], [41].
In conclusion, following CABG, the pressure that is exerted by the heart on subjacent lung segments increases and is an important cause of the regional loss of aeration in lower lobes. This finding explains why, despite the disappearance of several factors known to induce atelectasis during anesthesia and surgery, lung collapse and hypoxemia persist for several days during the postoperative period. Further studies are necessary to assess whether maintaining the patient in a strict, half-sitting position early during the postoperative period would improve postoperative lung aeration.
Funding Statement
This study was supported by a grant from Fundação de Amparo à Pesquisa do Estado de São Paulo (FAPESP) - process number 2005/0174-7. The funders had no role in study design, data collection and analysis, decision to publish, or preparation of the manuscript.
References
- 1. Magnusson L, Zemgulis V, Wicky S, Tyden H, Thelin S, et al. (1997) Atelectasis is a major cause of hypoxemia and shunt after cardiopulmonary bypass: an experimental study. Anesthesiology 87: 1153–1163. [DOI] [PubMed] [Google Scholar]
- 2. Rodrigues RR, Sawada AY, Rouby JJ, Fukuda MJ, Neves FH, et al. (2011) Computed tomography assessment of lung structure in patients undergoing cardiac surgery with cardiopulmonary bypass. Braz J Med Biol Res 44: 598–605. [DOI] [PubMed] [Google Scholar]
- 3. Lundstrom LH, Nygard E, Hviid LB, Pedersen FM, Ravn J, et al. (2005) The effect of thoracic epidural analgesia on the occurrence of late postoperative hypoxemia in patients undergoing elective coronary bypass surgery: a randomized controlled trial. Chest 128: 1564–1570. [DOI] [PubMed] [Google Scholar]
- 4. Tokics L, Hedenstierna G, Strandberg A, Brismar B, Lundquist H (1987) Lung collapse and gas exchange during general anesthesia: effects of spontaneous breathing, muscle paralysis, and positive end-expiratory pressure. Anesthesiology 66: 157–167. [DOI] [PubMed] [Google Scholar]
- 5. Vargas FS, Cukier A, Terra-Filho M, Hueb W, Teixeira LR, et al. (1993) Influence of atelectasis on pulmonary function after coronary artery bypass grafting. Chest 104: 434–437. [DOI] [PubMed] [Google Scholar]
- 6. Vargas FS, Terra-Filho M, Hueb W, Teixeira LR, Cukier A, et al. (1997) Pulmonary function after coronary artery bypass surgery. Respir Med 91: 629–633. [DOI] [PubMed] [Google Scholar]
- 7. Lindberg P, Gunnarsson L, Tokics L, Secher E, Lundquist H, et al. (1992) Atelectasis and lung function in the postoperative period. Acta Anaesthesiol Scand 36: 546–553. [DOI] [PubMed] [Google Scholar]
- 8. Hachenberg T, Brussel T, Roos N, Lenzen H, Mollhoff T, et al. (1992) Gas exchange impairment and pulmonary densities after cardiac surgery. Acta Anaesthesiol Scand 36: 800–805. [DOI] [PubMed] [Google Scholar]
- 9. Tenling A, Hachenberg T, Tyden H, Wegenius G, Hedenstierna G (1998) Atelectasis and gas exchange after cardiac surgery. Anesthesiology 89: 371–378. [DOI] [PubMed] [Google Scholar]
- 10. Hedenstierna G (1994) Atelectasis formation and gas exchange impairment during anaesthesia. Monaldi Arch Chest Dis 49: 315–322. [PubMed] [Google Scholar]
- 11. Dery R, Pelletier J, Jacques A, Clavet M, Houde J (1965) Alveolar collapse induced by denitrogenation. Can Anaesth Soc J 12: 531–557. [DOI] [PubMed] [Google Scholar]
- 12. Froese AB, Bryan AC (1974) Effects of anesthesia and paralysis on diaphragmatic mechanics in man. Anesthesiology 41: 242–254. [DOI] [PubMed] [Google Scholar]
- 13. Hedenstierna G, Tokics L, Lundquist H, Andersson T, Strandberg A, et al. (1994) Phrenic nerve stimulation during halothane anesthesia. Effects of atelectasis. Anesthesiology 80: 751–760. [DOI] [PubMed] [Google Scholar]
- 14. Westerdahl E, Lindmark B, Eriksson T, Friberg Ö, Hedenstierna G, et al. (2005) Deep-Breathing Exercises Reduce Atelectasis and Improve Pulmonary Function After Coronary Artery Bypass Surgery*. Chest 128: 3482–3488. [DOI] [PubMed] [Google Scholar]
- 15. Malbouisson LM, Busch CJ, Puybasset L, Lu Q, Cluzel P, et al. (2000) Role of the heart in the loss of aeration characterizing lower lobes in acute respiratory distress syndrome. CT Scan ARDS Study Group. Am J Respir Crit Care Med 161: 2005–2012. [DOI] [PubMed] [Google Scholar]
- 16. Corr L, McCarthy PA, Lavender JP, Hallidie-Smith KA (1988) Bronchial compression by an enlarged left atrium in infants; a cause of hypovascularity of the left lung. Pediatr Radiol 18: 459–463. [DOI] [PubMed] [Google Scholar]
- 17. Dailey ME, O'Laughlin MP, Smith RJ (1990) Airway compression secondary to left atrial enlargement and increased pulmonary artery pressure. Int J Pediatr Otorhinolaryngol 19: 33–44. [DOI] [PubMed] [Google Scholar]
- 18. Raffa GM, Cappai A, Tarelli G (2011) Giant left atrium syndrome. J Cardiovasc Med (Hagerstown) 12: 745–746. [DOI] [PubMed] [Google Scholar]
- 19. Secker-Walker RH, Toban MM, Ho JE (1981) Patterns of regional ventilation in patients with cardiomegaly or left heart failure. J Nucl Med 22: 212–218. [PubMed] [Google Scholar]
- 20. Alexander MS, Arnot RN, Lavender JP (1989) Left lower lobe ventilation and its relation to cardiomegaly and posture. BMJ 299: 94. [DOI] [PMC free article] [PubMed] [Google Scholar]
- 21. Wiener CM, McKenna WJ, Myers MJ, Lavender JP, Hughes JM (1990) Left lower lobe ventilation is reduced in patients with cardiomegaly in the supine but not the prone position. Am Rev Respir Dis 141: 150–155. [DOI] [PubMed] [Google Scholar]
- 22. Mull RT (1984) Mass estimates by computed tomography: physical density from CT numbers. Am J Roentgenol 143: 1101–1104. [DOI] [PubMed] [Google Scholar]
- 23. Vieira SR, Puybasset L, Richecoeur J, Lu Q, Cluzel P, et al. (1998) A lung computed tomographic assessment of positive end-expiratory pressure-induced lung overdistension. Am J Respir Crit Care Med 158: 1571–1577. [DOI] [PubMed] [Google Scholar]
- 24. Puybasset L, Cluzel P, Chao N, Slutsky AS, Coriat P, et al. (1998) A computed tomography scan assessment of regional lung volume in acute lung injury. Am J Respir Crit Care Med 158: 1644–1655. [DOI] [PubMed] [Google Scholar]
- 25. Gattinoni L, Pesenti A, Avalli L, Rossi F, Bombino M (1987) Pressure-volume curve of total respiratory system in acute respiratory failure. Computed tomographic scan study. Am Rev Respir Dis 136: 730–736. [DOI] [PubMed] [Google Scholar]
- 26. Hedenstierna G, Lundquist H, Lundh B, Tokics L, Strandberg A, et al. (1989) Pulmonary densities during anaesthesia. An experimental study on lung morphology and gas exchange. Eur Respir J 2: 528–535. [PubMed] [Google Scholar]
- 27. Auler-Junior JO, Saldiva PH (1986) Pulmonary structure and extravascular lung water after cardiopulmonary bypass. Braz J Med Biol Res 19: 707–714. [PubMed] [Google Scholar]
- 28.Tukey JW (1977) Exploratory data analysis. BostonMassachusetts: Addison-Wesley Pub. Co. 688 p. [Google Scholar]
- 29. Puybasset L, Cluzel P, Gusman P, Grenier P, Preteux F, et al. (2000) Regional distribution of gas and tissue in acute respiratory distress syndrome. I. Consequences for lung morphology. CT Scan ARDS Study Group. Intensive Care Med 26: 857–869. [DOI] [PubMed] [Google Scholar]
- 30.Rouby JJ, Lu Q, Vieira S (2003) Pressure/volume curves and lung computed tomography in acute respiratory distress syndrome. Eur Respir J Suppl 42: 27s–36s. [DOI] [PubMed]
- 31. Iverson LI, Ecker RR, Fox HE, May IA (1978) A comparative study of IPPB, the incentive spirometer, and blow bottles: the prevention of atelectasis following cardiac surgery. Ann Thorac Surg 25: 197–200. [DOI] [PubMed] [Google Scholar]
- 32. Daganou M, Dimopoulou I, Michalopoulos N, Papadopoulos K, Karakatsani A, et al. (1998) Respiratory complications after coronary artery bypass surgery with unilateral or bilateral internal mammary artery grafting. Chest 113: 1285–1289. [DOI] [PubMed] [Google Scholar]
- 33. Hedenstierna G (1999) Invited editorial on "Kinetics of absorption atelectasis during anesthesia: a mathematical model". J Appl Physiol 86: 1114–1115. [PubMed] [Google Scholar]
- 34. Rothen HU, Sporre B, Engberg G, Wegenius G, Hogman M, et al. (1995) Influence of gas composition on recurrence of atelectasis after a reexpansion maneuver during general anesthesia. Anesthesiology 82: 832–842. [DOI] [PubMed] [Google Scholar]
- 35. de Vroege R, Rutten PM, Kalkman C, Out TA, Jansen PG, et al. (1997) Biocompatibility of three different membrane oxygenators: effects on complement, neutrophil and monocyte activation. Perfusion 12: 369–375. [DOI] [PubMed] [Google Scholar]
- 36. Schlensak C, Doenst T, Beyersdorf F (2000) Lung ischemia during cardiopulmonary bypass. Ann Thorac Surg 70: 337–338. [DOI] [PubMed] [Google Scholar]
- 37. Pelosi P, D'andrea L, Vitale G, Pesenti A, Gattinoni L (1994) Vertical gradient of regional lung inflation in adult respiratory distress syndrome. Am J Respir Crit Care Med 149: 8–13. [DOI] [PubMed] [Google Scholar]
- 38. Hoffman EA (1985) Effect of body orientation on regional lung expansion: a computed tomographic approach. J Appl Physiol 59: 468–480. [DOI] [PubMed] [Google Scholar]
- 39. Hoffman EA, Ritman EL (1987) Heart-lung interaction: effect on regional lung air content and total heart volume. Ann Biomed Eng 15: 241–257. [DOI] [PubMed] [Google Scholar]
- 40. Hyatt RE, Bar-Yishay E, Abel MD (1985) Influence of the heart on the vertical gradient of transpulmonary pressure in dogs. J Appl Physiol 58: 52–57. [DOI] [PubMed] [Google Scholar]
- 41. Alexander MS, Peters AM, Cleland JP, Lavender JP (1992) Impaired left lower lobe ventilation in patients with cardiomegaly. An isotope study of mechanisms. Chest 101: 1189–1193. [DOI] [PubMed] [Google Scholar]
- 42. Belhaj A (2012) Actual knowledge of systemic inflammation reaction during cardiopulmonary bypass. Recent Pat Cardiovasc Drug Discov 7: 165–169. [DOI] [PubMed] [Google Scholar]
- 43. Mehlhorn U, Davis KL, Burke EJ, Adams D, Laine GA, et al. (1995) Impact of cardiopulmonary bypass and cardioplegic arrest on myocardial lymphatic function. Am J Physiol 268: H178–183. [DOI] [PubMed] [Google Scholar]
- 44. Gorlach G, Scheld HH, Mulch J, Schaper J, Hehrlein FW (1986) Ultrastructure of the human myocardium after intermittent ischemia compared to cardioplegia. Adv Exp Med Biol 194: 439–449. [DOI] [PubMed] [Google Scholar]
- 45. Rouby JJ, Leger P, Arthaud M, Devilliers C, Cabrol A, et al. (1989) Respiratory effects of the Jarvik-7 artificial heart. J Appl Physiol 66: 1984–1989. [DOI] [PubMed] [Google Scholar]


