

Abstract
Lifespan measurements, also called survival records, are a key phenotype in research on aging. If external hazards are excluded, aging alone determines the mortality in a population of model organisms. Understanding the biology of aging is highly desirable because of the benefits for the wide range of aging-related diseases. However, it is also extremely challenging because of the underlying complexity. Here, we describe SurvCurv, a new database and online resource focused on model organisms collating survival data for storage and analysis. All data in SurvCurv are manually curated and annotated. The database, available at http://www.ebi.ac.uk/thornton-srv/databases/SurvCurv/, offers various functions including plotting, Cox proportional hazards analysis, mathematical mortality models and statistical tests. It facilitates reanalysis and allows users to analyse their own data and compare it with the largest repository of model-organism data from published experiments, thus unlocking the potential of survival data and demographics in model organisms.
Keywords: aging, analysis, bioinformatics, demography, database, survival data
Introduction
The most commonly used phenotype in research on aging is the age of death of model organisms. Death, the end point of aging, is unambiguously defined and occurs universally in living organisms. Changes in lifespan between groups with identical genetic background and environmental conditions except for one defined difference can be used to demonstrate the effect of this factor on survival. Survival analysis is not only used for research in aging, but also in research on new treatments for fatal diseases such as cancer.
Traditionally in research on aging, survival data from lifespan experiments are only analysed in the original study and not collected and stored together. Use beyond the primary study is generally limited to comparing changes in mean lifespan or other high-level summary statistics. It is often argued that valid comparisons of survival data between experiments are prevented by the fact that environmental factors influence survival and the survival effects of interventions. Thus, collecting survival data would not be useful. While variation in environmental factors limits the possibilities to compare data, it does not prevent reanalysing data from individual experiments in new or different ways, nor does it prevent comparing data with identical conditions. Multifactorial survival analysis methods such as Cox proportional hazard or accelerated failure time models (Cox, 1972) taking into account variation in multiple specified conditions can also be used.
While human deaths are precisely recorded in the developed world and mortality data are available through various databases such as the Human Mortality Database (http://www.mortality.org), there has been no database for survival data from non-human animals, including model organisms. As a result, these valuable data which are key to research on aging and are recorded in numerous laboratories around the world, sometimes as a result of year-long efforts, are currently not publicly available nor accessible and prone to be lost when researchers move on to new positions. Given the central importance of this phenotype for research on aging, researchers would ideally be able to mine the collective knowledge, explore data of individual studies alone and in the context of other studies, combine information from multiple trials and reinvestigate existing data in new ways. For example, alternative visualisation of the same data has fuelled scientific discussion about a recent aging study in Drosophila (Giannakou et al., 2004; Tatar, 2005).
While the statistical framework for single study survival analysis is well developed and numerous textbooks are available (Kalbfleisch & Prentice, 2002; Kleinbaum & Klein, 2005), the framework is far less developed for jointly analysing survival data from multiple studies while accounting for differences in multiple factors, incomplete information and potential additional unknown factors. The lack of a database for survival data in model organisms has hampered the development of statistical methods for survival meta-analysis and the evaluation of existing methods for certain settings, because it requires the tedious process of collecting an appropriate set of survival data. While such efforts exist (Swindell, 2009), examples remain rare. The necessity to have survival data accessible has been also been acknowledged by the leading journal in aging research, Aging Cell, which requires authors to provide their raw survival data in the supplement, ‘to allow replication of the presented analysis and to facilitate independent analysis and cross-study comparisons’ (Aging Cell Author Guidelines). We thus created a new database and online resource for survival data in animals called SurvCurv. It contains manually curated survival data annotated with public database identifiers, making these data truly accessible. The platform allows direct analyses of the provided data and all data can be downloaded to be used for further analyses with other software. Finally, we illustrate how a collection of survival data on aging can be used to introduce the concept of pooled historical controls to research on aging.
Results
SurvCurv database content
We have created the new database and online resource SurvCurv, which currently contains public survival records of 99 496 individual animals: 10 706 Caenorhabditis elegans, 84 938 Drosophila melanogaster and 3852 individuals of other species. These records belong to a total of 1063 cohorts from 29 studies (see list of citations in Data S1). They include survival under various conditions such as different temperatures, dietary conditions and mating paradigms, as well as genetic alterations or administration of drugs. Additional unpublished or copyrighted data have been included with password-restricted access and will be released upon publication or copyright clearance.
The maximum Drosophila lifespan recorded in SurvCurv is 147 days {a female fly of the Dahomey strain kept at 18 °C [Iqbal et al. (2009), SurvCurv ID: 204]}, and the maximum recorded for C. elegans is 53 days {rrf-3(pk1426) daf-2 and smg-1 RNAi [Masse et al. (2008), SurvCurv ID: 892]}. The maximum change in median lifespan between control and treatment in Drosophila is 67 days, or 110%, for a change in temperature from 25 to 18 °C [Iqbal et al. (2009), SurvCurv IDs: 202 and 204] and the second largest change is 26.5 days, corresponding to a 53% increase, for a homozygote knock-out of Drosophila insulin-like peptides 2-3,5 [Grönke et al. (2010), SurvCurv IDs: 427 and 426]. The largest single cohort contains 3177 individuals {WT female flies at 27 °C [Jacobson et al. (2010), SurvCurv ID: 197]} and the oldest cohorts currently recorded are from 10 May 1993 [Chapman et al. (1993), SurvCurv IDs: 979-986].
SurvCurv web interface
The new database and online resource SurvCurv is accessible through the web interface at http://www.ebi.ac.uk/thornton-srv/databases/SurvCurv/ (Fig. 1). The web interface enables the user to browse the database content, analyse it online, download data sets for offline analysis, and to submit data to the database. In addition, the direct analysis interface allows upload of the user's own survival data for analysis and visualisation. These data are transferred to the SurvCurv server via a secure internet connection and only used for the selected analyses. They are not permanently stored, made available to anybody else or included in the database. If the user would like to submit data after having analysed them, this has to be carried out separately via the submission page and the author will be contacted to confirm release before making any submitted data available through the database. Statistical descriptors and tests can be directly computed on user data, and data available through the database can be incorporated in any analysis. The database content can be browsed or searched by a simple text box search as well as an advanced search for specific fields. Identifiers as well as plain-text descriptors can be searched using the simple search feature. Each cohort of animals has been manually curated and annotated with a short name, an optional longer description including remarks, a reference (usually a publication), the species, strain and gender, the experimental conditions and treatments applied as well as its relationship with other cohorts. Furthermore, precalculated descriptive statistics and parameters of six common mathematical mortality models, detailed under Statistical Features below, are provided (Fig. 1B). Besides the annotated related cohorts, the database content can be explored based on various similarity measures through the similarity search available in the ‘details’ section of each cohort. Similarity can be based on any descriptive statistical measure displayed, such as the median or the parameters of the fitted mathematical models. This explorative tool enables users to find other cohorts, similar with respect to the property of interest and can lead to the discovery of unexpected connections. These can prompt a more detailed analysis and even further experiments.
Fig. 1.
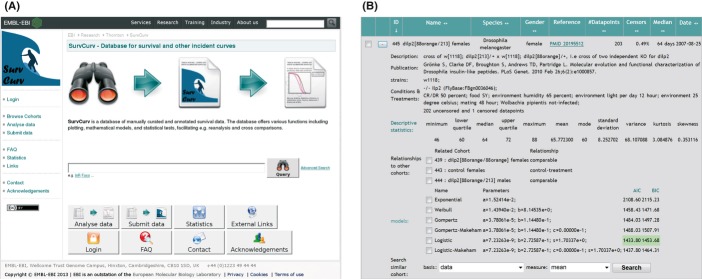
(A) Screenshot of the front page of the SurvCurv Website (B) Screenshot of a detailed cohort information display example.
Visualisation features
Cohorts uploaded for direct analysis, cohorts from the database as well as mathematical models can all be visualised in four common ways: survival curves (Fig. 2A), death curves (Fig. 2B), also called cumulative incidence curves, incidence curves (Fig. 2C) and mortality curves, also called hazard plots (Fig. 2D). Each of these representations has advantages in illustrating certain properties of the data. Survival curves represent the percentage of the population alive over time, which is a cumulative measure, as are death curves, showing the percentage of the population that has already died. The other two curves are noncumulative and show the distribution of death events or incidences (incidence curve) and the mortality risk over time. While survival curves are the most common graphical representation, it is usually advised to also examine the corresponding mortality plots to avoid missing temporal variation, which can lead to controversies (Giannakou et al., 2004; Tatar, 2005).
Fig. 2.
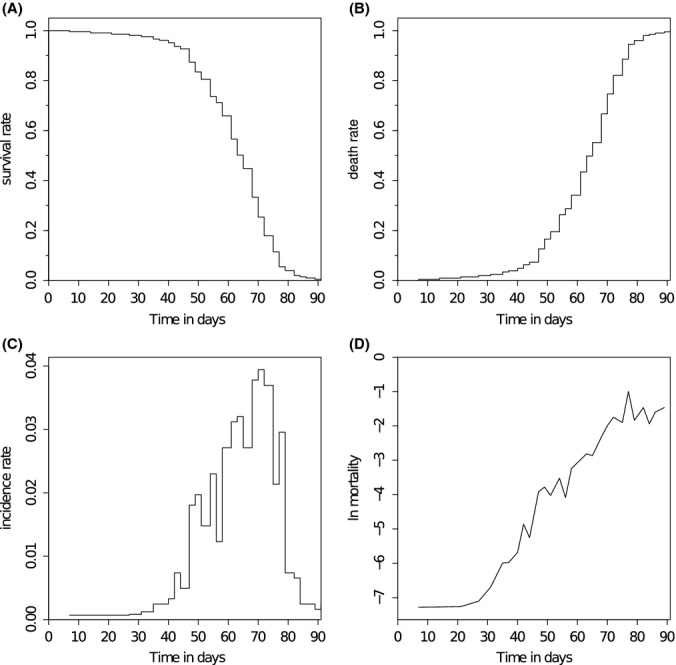
Survival data visualisations. (A) Survival curve – shows the cumulative probability of surviving over time, which is equivalent to the percentage of the population alive. (B) Death curve – shows the cumulative probability of dying over time, corresponding to the percentage of the population which has already died. This curve is sometimes also called cumulative incidence curve. (C) Incidence plot – shows the distribution of death events or incidences over time. (D) Mortality plot – shows the negative logarithm of the noncumulative probability of death, that is, hazard rate, on a log scale over time. It represents the probability of dying in that time frame, given an individual has survived until the beginning of the time frame. [Example: Partridge et al. (2011), SurvCurv:486].
While these plots show the absolute characteristics nicely, the difference between control and treatment or between two different conditions, which is usually the question of interest, is only indirectly represented. Especially when dealing with results from different studies, it is important to examine the control-treatment differences, rather than the absolute lifespan variations, which are influenced by numerous other effects, such as temperature or food type. We thus defined four new plots called difference plots. Each of these plots is based on one of the common plots mentioned before, but instead of using the absolute values it shows the differences between pairs of ‘treatment’ and control cohorts on the y-axis. In difference survival curves, positive values indicate a survival advantage of the treatment compared to the control, while a disadvantage results in the curve falling below the zero line. Difference plots cannot only be based on survival curves, but also on mortality curves, showing relative mortality differences. All these difference plots also support the use of mathematical models in addition to or instead of survival data. This can be useful for exploring the differences between cohorts via the corresponding models. Alternatively, the differences between two mathematical models of the same survival data can be visualised in the same way.
The web service offers additional plotting options like different output formats such as PDF or SVG, as well as the style to connect the individual measurement points. For incidence, mortality and all difference plots, a sliding window smoothing can be applied, and a log scale for the time axes can be used instead of the normal linear scale for all plots. Further options include the ability to automatically combine annotated replicates, to add ‘historical controls’, or create meta-cohorts based on user-defined criteria.
Historical controls
Historical controls are a concept already commonly used in toxicity and cancerogenicity studies (Keenan et al., 2009) to put individually measured lifespans into a bigger picture by a three-way comparison between historical control, measured control and measured treatment condition. This comparison clearly indicates whether the measured control strongly deviates from the average control, which would suggest that extra caution is necessary in interpreting the results and comparing them to other studies. Through collecting survival records in SurvCurv, we are able to combine controls of identical or highly similar conditions to define average pooled survival curves [see Ziehm et al. (this issue) for further details]. We refer to these as ‘historical controls’ in agreement with the established terminology in the fields of toxicity and cancerogenicity. We have defined historical controls for wDah and w1118 for defined conditions, which are readily available through the web interface. Moreover, users can define their own historical controls, or meta-cohorts, based on their own criteria.
An example where historical controls might have been helpful is the study of dFOXO overexpression (Giannakou et al., 2007; Fig. 3). Looking only at the measured control and treatment, the conclusion is a clear increase in lifespan when overexpressing dFOXO, and further studies (Hwangbo et al., 2004; Giannakou et al., 2008) support the general statement that dFOXO overexpression can extend lifespan. However, taking into account the survival curve of pooled controls of similar conditions (in this case once mated female wDah flies at 25 °C fed 1SY food), it is quite clear that both measured control and treatment have shorter survival than the historical control. The positive effect of dFOXO overexpression could therefore additionally be seen as partially rescuing some unknown negative effect on lifespan which occurred in the experiment. Further investigation of such findings at the time of the experiment could help uncover unknown interactions of different modulators of aging.
Fig. 3.
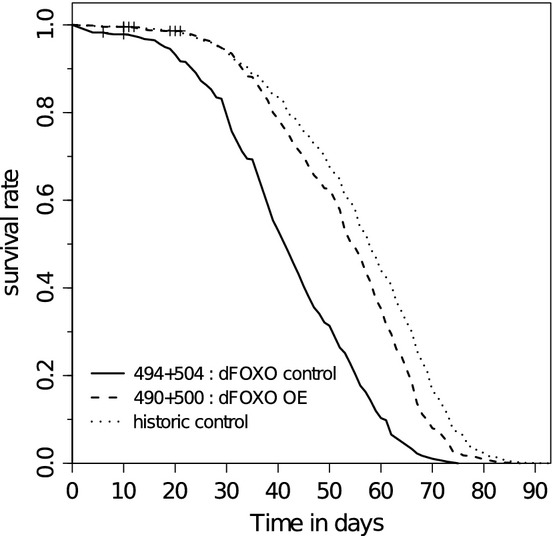
Survival curves for dFOXO overexpression (dashed) (SurvCurv:490+500), measured control (solid) (SurvCurv:494+504) and historical control with ostensibly inactive genetic constructs from pooled control cohorts of once mated female wDah Drosophila melanogaster at 25 °C fed 1SY food (dotted).
A second example where historical controls could have been useful is a study on IRS2 knock-out mice (Taguchi et al., 2007), which found a lifespan increase in the KO mice compared to their controls. This result has been criticised because the control showed an unusual survival pattern and an independent study of the same KO mice with a similar study design found no significant increase in lifespan (Selman et al., 2008). The KO lifespan measured in the second study was in good agreement with the one measured in the first study, but the lifespans of the controls were very different. A well-defined historical control matching the experimental conditions could help to settle the argument, by clearly positioning both experiments in context to previous studies.
Statistical features
In addition to the visualisations described above, the database provides various numerical summaries: the number of observed individuals, the number of censored data points, as well as other descriptive statistics such as minimal, mean, median and maximal observed lifespan, but also variance and skewness.
Six common mathematical mortality models (Exponential model, Weibull model, Gompertz model, Gompertz-Makeham model, Logistic model and Logistic-Makeham model) have been fitted to each cohort where possible and can be plotted alone or together with the data. The relative goodness of fit measured by Akaike and Bayesian Information Criterion (AIC and BIC, respectively) values as well as a classical maximum-likelihood estimate together with the parameter values are provided. The mathematical mortality model that fits Drosophila survival data best according to AIC (and BIC criterion) is in most cases the Gompertz model [35% of all cases (45% for BIC criterion)], closely followed by the Weibull model [29% (35% for BIC criterion)], while for C. elegans, the Weibull model is fitting best in most cases [51% of all cases (65% for BIC criterion)] and the Gompertz is only the best model in ∼ 10% of the cases.
When plotting data through the web interface using any basic representation, the log-rank test (Harrington & Fleming, 1982) and generalised Wilcoxon test (Harrington & Fleming, 1982) for statistical difference between cohorts are applied and the results given below the plot. The log-rank test is more sensitive to survival differences between cohorts at later time points, while the generalised Wilcoxon test is more sensitive to differences at early time points. By default, both methods test whether all cohorts come from the same distribution, that is, are not different, but pairwise tests can be enabled in the advanced plotting options. The Wang-Allison test (Wang et al., 2004) for differences in maximal lifespan can also be activated there. Pairwise Fisher's exact tests (Fisher, 1934) for differences at a specified time point can be calculated, too. For difference plots, statistical descriptors such as the area under the curve or the area under the absolute curve are given for each curve.
Cox proportional hazards analysis
SurvCurv also offers the possibility to analyse database data or uploaded data using the Cox proportional hazards (CoxPH) model (Cox, 1972), a statistical model of survival data with one or more covariates or factors, that is, for multiple conditions. It allows the user to identify which factors significantly contribute to the overall model and quantify their respective influences on the hazard rates in the model. An increased survival corresponding to a decreased mortality or hazard rate is indicated by an exp(coef) < 1, with exp(coef) giving the relative mortality risk compared to the baseline. Importantly, the CoxPH model assumes that the hazard rates of the different conditions are proportional, that is, the mortality of all conditions are multiples of each other. This assumption thus has to be checked before each CoxPH analysis. SurvCurv automatically tests the assumption and presents the results of the tests, together with the CoxPH results and diagnostic plots of the assumption (see Fig. 4 for an example). It has to be noted that p-values of the proportional hazards tests, like of any other test, are strongly dependent on the sample size. Gross violations may not be statistically significant if the sample size is very small, and even slight violations, causing negligible errors in the estimated coefficients, may be highly significant if the sample size is very large. An estimate of the size of the deviations from the assumed independence, that is, no correlation (see Methods for details), is given by the respective correlation coefficients rho, which can thus be helpful in interpreting the test results. If the proportional hazards assumption has been rejected with noticeable deviations, alternative analysis such as accelerated failure time analysis (AFT) or Cox analysis using transformed or time-dependent co-variates might be necessary. These are currently not available in SurvCurv, but users requiring these analyses can download all data for use in their preferred full statistics program.
Fig. 4.
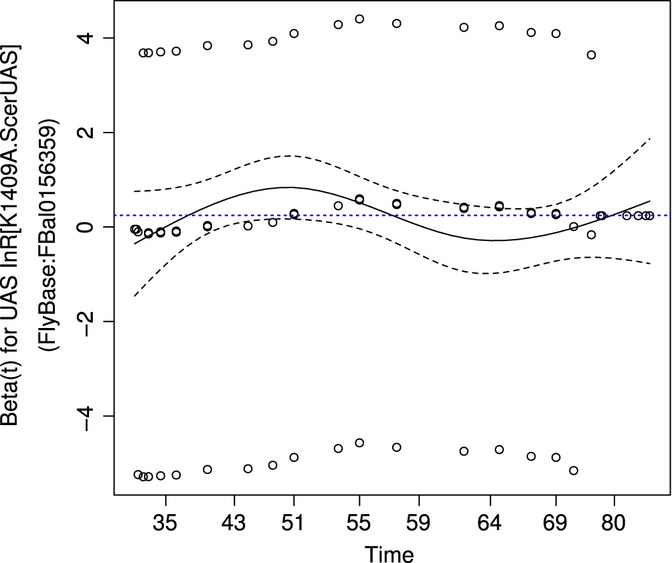
Cox Proportional Hazards Diagnostic Plot Example showing the scaled Schoenfeld residuals plotted against the transformed time. Additionally shown are a nonlinear fitted line of the data (black solid) and a horizontal line [dotted blue (grey in print version)] corresponding to the determined Cox coefficient. There should be no clear overall increasing or decreasing tendency and the fitted nonlinear line should roughly follow the dotted horizontal line. This example shows a very good case. (The example is the diagnostic plot of the UAS-factor taken from CoxPH analysis of SurvCurv:164, 166, 168, 170 (Ikeya et al., 2009) using factors for GAL4, UAS and GAL4-UAS interaction.)
One possible application of the CoxPH model is to evaluate UAS/GAL4-based lifespan experiments in Drosophila. In the UAS/GAL4 transcriptional system (Brand & Perrimon, 1993), two transgenic elements are used to express a gene of interest. The upstream activator sequence (UAS) is a promoter region with GAL4 binding sites followed by a transgene of interest and the GAL4-element encodes the yeast transcriptional activator GAL4 driven by a Drosophila promoter. Separately, the two transgenes should have no effect, jointly; however, the transgene of interest should be transcribed and might influence longevity. The classical approach to evaluating the experiments is to test for a significant change in lifespan between a cohort containing only the UAS-construct and one containing both UAS- and GAL4-construct and a second test between a cohort containing only the GAL4-construct against the combined cohort. If both tests indicate a significant change, it is assumed that the transgene of interest is changing the survival. However, for this to be true, the GAL4-alone cohort and the UAS-alone cohort have to be also compared to the WT and show either no difference in lifespan or the combined differences to the WT have to be smaller than the difference between WT and lifespan of the cohort with both constructs. Otherwise, the change in lifespan is not due to the overexpression but the combination of the individual survival benefits of the construct insertions. While a simple test cannot check this complex condition, the CoxPH model can be used to evaluate this by determining the model for the four cohorts WT, UAS-alone, GAL4-alone, and both UAS and GAL4 using a UAS-GAL4-interaction term. If there is a change in survival which is due to the transgene of interest, the interaction term is significant and the coefficient quantifies the effect. An example is the overexpression of a dominant negative variant of the Drosophila insulin receptor InR (Ikeya et al., 2009) (SurvCurv Identifiers 164, 166, 168, 170). The test for the proportional hazard assumption has a global P-value = 0.04 and an average |rho| = 0.07, indicating that the assumption is not rejected with large deviation, so the model is applicable. The model shows that factors for presence of the GAL4-construct and presence of the UAS-construct are nonsignificant (P-values of 0.82 and 0.17, respectively), but the GAL4-UAS interaction term is highly significant (P-value = 1.6*10−12). Moreover, the GAL4-UAS interaction term has a coefficient of −1.9 corresponding to strongly reduced mortality by the factor of 0.125, that is, a 8-fold reduction. This shows that the GAL4-construct alone and the UAS-construct alone do not change mortality significantly, but the interaction of the two constructs does. Other interesting applications might be the examination of interactions of different treatments, such as dietary restriction, drug administrations or mutations to discriminate between overlapping, independent and synergistic mechanisms [see Ziehm et al. (this issue) for applications].
Discussion
Here, we introduced a new database and online resource for survival data in animals, especially model organisms. We have focussed our curation initially on Drosophila as a powerful tool for discovery and widely used model organism in research on aging, but we plan to increasingly include data from other organisms. The power and value of the database for the research community are vitally dependent on availability of the relevant data, which in turn depends on researchers supporting the database by contributing their data.
Survival analysis has existed for many decades and numerous statistical software packages, such as JMP or R, are available today offering different interfaces with varying functionalities. While a full statistical software will inevitably offer more possible analyses and features than a specialised online analysis resource, SurvCurv provides all commonly desired survival analysis functions. This includes true mortality plots that show the instantaneous, noncumulative hazards rates; a function not offered by JMP or basic R. Furthermore, SurvCurv is free to use and requires no setup or maintenance by the user. Recently, a different online analysis service for survival data, OASIS (Yang et al., 2011), has been published. Similarly to SurvCurv, it permits direct online analysis functionalities. While it offers some additional less common statistical tests, it lacks the important noncumulative mortality plots offered by SurvCurv. OASIS also does not allow for interactions terms in the Cox proportional hazards modelling nor is the proportional hazards assumption tested. Both of these crucial features are available in SurvCurv. Additionally, SurvCurv provides easy access to precalculated mortality models of six common forms. These models, including the Logistic–Makeham model, which can capture late-life mortality rate deceleration, are calculated by the highly regarded WinModest methodology. These are currently otherwise only available through R, whose use is very challenging for nonspecialist users. The main stronghold of SurvCurv, however, is not the pure analysis functionalities, but the freely available, collected and curated survival data, which can be analysed alone or in combination with new data provided by the user directly online. Furthermore, all data can be downloaded for analysis with other software or for testing new methodology, allowing any chosen analysis to be run.
Smart ways to take differences in control-lifespan into account are essential. The difference plots used here present a very basic means to do so. This approach has the advantage of being intuitively understandable and only dependent on the control and treatment and thus is independent of other potential pairs. The downside of this independence is that the individual differences are still not completely comparable and do not provide a statistical measure. More complex approaches calculating transformations that align the controls, which are then applied to the treatments, are desirable. As for multiple sequence alignment methods, survival alignment methods will certainly become more sophisticated. At the same time, new statistical tests for comparing lifespans between experiments which take into account the differences in the respective controls are vital. The development of such methods and tests is aided by the free SurvCurv database by providing readily available data for development and validation, thus abolishing the need for a cumbersome and time-consuming data-collection process.
Experimental procedures
Data gathering
We have contacted authors of publications from the last 2 years showing survival data and asked them for the corresponding numerical data. While we have focused our efforts so far on Drosophila, some data sets from other organisms have been included as well. A large proportion of the Drosophila data originates from the Partridge lab. Furthermore, a single study on baboons (Bronikowski et al., 2002) provided survival data, which was included in the nonpublic area of the database. This unexpected example proved that the design of the database is applicable to very different kinds of animals.
We also noticed that the information on the experimental conditions in the papers is incomplete in a non-negligible number of cases. Besides data provided to us by authors, we also explored the availability of data from supplementary files of articles. We retrieved limited amounts of survival data especially from the journal Aging Cell, which tries to increase accessibility of the data through their guidelines. While we are currently not able to republish these data through our database due to Aging Cell's copyright on these files, we hope to gain permission for it in the future.
All data in the public database are made available under a Creative Commons Attribution 3.0 Unported License (http://www.creativecommons.org/licenses/by/3.0/). This licence allows others to freely use, distribute, tweak, and build upon the database, even commercially, without any other restrictions than properly crediting the original work, that is, the original publication and the database.
Implementation
The data of SurvCurv are stored in a MySQL database, which allows the storage of animal counts as well as relative incidence rates, that is, computed survival rates. The internal structure enables not only the storage of survival data, but potentially also of other time-to-event data, by using different incidence types.
Data processing and insertion into the database was performed using multiple purpose-tailored scripts in python and R (R Development Core Team, 2010). All data were manually curated and annotated using public database identifiers, for example FlyBase (Tweedie et al., 2009) for fly genes and constructs and CHEBI (de Matos et al., 2010) for small molecules including drugs. Statistical descriptors were calculated using R taking into account censored observations. Mathematical mortality models were fitted to the individual data sets using the Survomatic R package (Bokov & Gelfond, 2010). This package includes an R port of the popular WinModest (Pletcher, 1999) software. The fitting procedure starts by fitting the exponential model with only one parameter, which can be calculated directly and then uses the parameter estimates of simpler models as starting points for fitting more complex models.
The web interface was implemented in PHP using an EBI framework and the Crystal Clear icon set by Everaldo Coelho as provided by Wikimedia Commons (https://commons.wikimedia.org/wiki/Crystal_Clear). The visualisation and survival analysis functionalities are realised via a server-side R script (R Development Core Team, 2010), using the R survival package (Therneau, 2009). The pairwise Fisher's exact test (Fisher, 1934) provided by R, and the log-rank test and Wilcoxon test provided by survdiff of the R survival package were used. The survdiff function implements the G-rho family of Harrington & Fleming (1982), which is the log-rank test with ρ = 0, and with ρ = 1, it is equivalent to Peto and Peto's modification of the Gehan–Wilcoxon test. The Wang–Allison test (Wang et al., 2004) for differences in maximum lifespan was implemented in R.
SurvCurv uses the Cox proportional hazards model implementation of the survival package with the Efron approximation for ties. The test for the proportional hazards assumption is a chi-square test between the Kaplan–Meier transformed survival times and the Schoenfeld residuals implemented in cox.zph of the survival package (Grambsch & Therneau, 1994). The diagnostic plots show the scaled Schoenfeld residuals along with a fitted natural spline of 4 degrees of freedom and a horizontal line of the determined model coefficient.
Acknowledgments
We thank T Hardcastle (University of Cambridge, UK) and members of the JM Thornton (EBI, UK), L Partridge (UCL, UK) and D Gems (UCL, UK) groups for helpful discussions. We are very grateful to all the people who provided primary data: S Broughton (Lancaster University, UK), D Bushey (University of Wisconsin-Madison, USA), T Chapman (University of East Anglia, UK), T Flatt (Veterinärmedizinische Universität Wien, Austria), MD Ganfornina (Universidad de Valladolid and Consejo Superior de Investigaciones Científicas, Spain), ME Giannakou (University of Cambridge, UK), S Grönke (Max Planck Institute for Biology of Ageing, Germany), TJ Kawecki (Université de Lausanne, Switzerland), K Narbonne-Reveau (Institut de Biologie du Développement de Marseille-Luminy, France), KM Norry (Universidad de Buenos Aires, Argentina), A Rana & OCM Sibon (Rijksuniversiteit Groningen, Netherlands), F Solari (Université de Lyon, France), JM Toivonen (Universidad de Zaragoza, Spain) and D Ackerman, N Alic, H Augustin, L Bettedi, I Bjedov, F Cabreiro, JI Castillo-Quan, HM Cochemé, D Gems, J Jacobson, F Kerr, L Mestek, MD Piper, M Riesen, I Rogers, C Slack, O Sofola & S Valentini (University College London, UK). We acknowledge funding by EMBL (MZ) and the Wellcome Trust Strategic Award 081394/B/06/Z (JMT).
Author contributions
MZ and JMT designed the study and analyses and interpreted the results. MZ collected the data, created the database and web service and wrote the manuscript. All authors read and approved the final manuscript.
Supporting Information
Additional Supporting Information may be found in the online version of this article at the publisher's web-site.
Data S1. References of all publications currently contained in SurvCurv.
References
- Bokov AF, Gelfond J. Survomatic: Analysis of Longevity Data. 2010. R package version 1.4.0.0. [Google Scholar]
- Brand AH, Perrimon N. Targeted gene expression as a means of altering cell fates and generating dominant phenotypes. Development. 1993;118:401–415. doi: 10.1242/dev.118.2.401. [DOI] [PubMed] [Google Scholar]
- Bronikowski AM, Alberts SC, Altmann J, Packer C, Carey KD, Tatar M. The aging baboon: comparative demography in a non-human primate. Proc. Natl Acad. Sci. USA. 2002;99:9591–9595. doi: 10.1073/pnas.142675599. [DOI] [PMC free article] [PubMed] [Google Scholar]
- Chapman T, Hutchings J, Partridge L. No reduction in the cost of mating for Drosophila melanogaster females mating with spermless males. Proc. Biol. Sci. 1993;253:211–217. doi: 10.1098/rspb.1993.0105. [DOI] [PubMed] [Google Scholar]
- Cox D. Regression models and life-tables. J. R. Stat. Soc. Series B (Methodol) 1972;34:187–220. [Google Scholar]
- Fisher RA. Statistical Methods for Research Workers. Edinburgh: Oliver and Boyd; 1934. 1st edition published in 1925. [Google Scholar]
- Giannakou ME, Goss M, Jünger MA, Hafen E, Leevers SJ, Partridge L. Long-lived Drosophila with overexpressed dFOXO in adult fat body. Science. 2004;305:361. doi: 10.1126/science.1098219. [DOI] [PubMed] [Google Scholar]
- Giannakou ME, Goss M, Jacobson J, Vinti G, Leevers SJ, Partridge L. Dynamics of the action of dFOXO on adult mortality in Drosophila. Aging Cell. 2007;6:429–438. doi: 10.1111/j.1474-9726.2007.00290.x. [DOI] [PubMed] [Google Scholar]
- Giannakou ME, Goss M, Partridge L. Role of dFOXO in lifespan extension by dietary restriction in Drosophila melanogaster: not required, but its activity modulates the response. Aging Cell. 2008;7:187–198. doi: 10.1111/j.1474-9726.2007.00362.x. [DOI] [PubMed] [Google Scholar]
- Grambsch P, Therneau T. Proportional hazards tests and diagnostics based on weighted residuals. Biometrika. 1994;81:515–526. [Google Scholar]
- Grönke S, Clarke DF, Broughton S, Andrews TD, Partridge L. Molecular evolution and functional characterization of Drosophila insulin-like peptides. PLoS Genet. 2010;6:e1000857. doi: 10.1371/journal.pgen.1000857. [DOI] [PMC free article] [PubMed] [Google Scholar]
- Harrington DP, Fleming TR. A class of rank test procedures for censored survival data. Biometrika. 1982;69:553–566. [Google Scholar]
- Hwangbo DS, Gershman B, Gersham B, Tu MP, Palmer M, Tatar M. Drosophila dFOXO controls lifespan and regulates insulin signalling in brain and fat body. Nature. 2004;429:562–566. doi: 10.1038/nature02549. [DOI] [PubMed] [Google Scholar]
- Ikeya T, Broughton S, Alic N, Grandison R, Partridge L. The endosymbiont Wolbachia increases insulin/IGF-like signalling in Drosophila. Proc. Biol. Sci. 2009;276:3799–3807. doi: 10.1098/rspb.2009.0778. [DOI] [PMC free article] [PubMed] [Google Scholar]
- Iqbal A, Piper M, Faragher RGA, Naughton DP, Partridge L, Ostler EL. Chemical changes in aging Drosophila melanogaster. Age (Dordr) 2009;31:343–351. doi: 10.1007/s11357-009-9105-4. [DOI] [PMC free article] [PubMed] [Google Scholar]
- Jacobson J, Lambert AJ, Portero-Otín M, Pamplona R, Magwere T, Miwa S, Driege Y, Brand MD, Partridge L. Biomarkers of aging in Drosophila. Aging Cell. 2010;9:466–477. doi: 10.1111/j.1474-9726.2010.00573.x. [DOI] [PMC free article] [PubMed] [Google Scholar]
- Kalbfleisch JD, Prentice RL. Statistical Analysis of Failure Time Data. 2nd edn. Hoboken, NJ: Wiley-Interscience; 2002. [Google Scholar]
- Keenan C, Elmore S, Francke-Carroll S, Kemp R, Kerlin R, Peddada S, Pletcher J, Rinke M, Schmidt SP, Taylor I, Wolf DC. Best practices for use of historical control data of proliferative rodent lesions. Toxicol. Pathol. 2009;37:679–693. doi: 10.1177/0192623309336154. [DOI] [PMC free article] [PubMed] [Google Scholar]
- Kleinbaum DG, Klein M. Survival Analysis: A Self-Learning Text. 2nd edn. New York, London: Springer; 2005. [Google Scholar]
- Masse I, Molin L, Mouchiroud L, Vanhems P, Palladino F, Billaud M, Solari F. A novel role for the SMG-1 kinase in lifespan and oxidative stress resistance in Caenorhabditis elegans. PLoS One. 2008;3:e3354. doi: 10.1371/journal.pone.0003354. [DOI] [PMC free article] [PubMed] [Google Scholar]
- de Matos P, Alcántara R, Dekker A, Ennis M, Hastings J, Haug K, Spiteri I, Turner S, Steinbeck C. Chemical Entities of Biological Interest: an update. Nucleic Acids Res. 2010;38(Database issue):D249–D254. doi: 10.1093/nar/gkp886. [DOI] [PMC free article] [PubMed] [Google Scholar]
- Partridge L, Alic N, Bjedov I, Piper MDW. Ageing in Drosophila: the role of the insulin/Igf and TOR signalling network. Exp. Gerontol. 2011;46:376–381. doi: 10.1016/j.exger.2010.09.003. [DOI] [PMC free article] [PubMed] [Google Scholar]
- Pletcher SD. Model fitting and hypothesis testing for age-specific mortality data. J. Evol. Biol. 1999;12:430–439. [Google Scholar]
- R Development Core Team. R: A Language and Environment for Statistical Computing. Vienna, Austria: R Foundation for Statistical Computing; 2010. ISBN 3-900051-07-0. [Google Scholar]
- Selman C, Lingard S, Gems D, Partridge L, Withers DJ. Comment on “Brain IRS2 signaling coordinates life span and nutrient homeostasis”. Science. 2008;320:1012. doi: 10.1126/science.1152366. author reply 1012. [DOI] [PubMed] [Google Scholar]
- Swindell WR. Accelerated failure time models provide a useful statistical framework for aging research. Exp. Gerontol. 2009;44:190–200. doi: 10.1016/j.exger.2008.10.005. [DOI] [PMC free article] [PubMed] [Google Scholar]
- Taguchi A, Wartschow LM, White MF. Brain IRS2 signaling coordinates life span and nutrient homeostasis. Science. 2007;317:369–372. doi: 10.1126/science.1142179. [DOI] [PubMed] [Google Scholar]
- Tatar M. Comment on “Long-lived Drosophila with overexpressed dFOXO in adult fat body”. Science. 2005;307:675. doi: 10.1126/science.1104733. author reply 675. [DOI] [PubMed] [Google Scholar]
- Therneau T. survival: Survival Analysis, Including Penalised Likelihood. 2009. Original R port by Thomas Lumley, R package version 2.35-8. [Google Scholar]
- Tweedie S, Ashburner M, Falls K, Leyland P, McQuilton P, Marygold S, Millburn G, Osumi-Sutherland D, Schroeder A, Seal R, Zhang H, FlyBase Consortium. FlyBase: enhancing Drosophila Gene Ontology annotations. Nucleic Acids Res. 2009;37(Database issue):D555–D559. doi: 10.1093/nar/gkn788. [DOI] [PMC free article] [PubMed] [Google Scholar]
- Wang C, Li Q, Redden DT, Weindruch R, Allison DB. Statistical methods for testing effects on “maximum lifespan”. Mech. Ageing Dev. 2004;125:629–632. doi: 10.1016/j.mad.2004.07.003. Erratum in: Mech Ageing Dev. 2006 Jul;127(7):652. [DOI] [PubMed] [Google Scholar]
- Yang JS, Nam HJ, Seo M, Han SK, Choi Y, Nam HG, Lee SJ, Kim S. OASIS: online application for the survival analysis of lifespan assays performed in aging research. PLoS One. 2011;6:e23525. doi: 10.1371/journal.pone.0023525. [DOI] [PMC free article] [PubMed] [Google Scholar]
- Ziehm M, Piper MD, Thornton JM. Analysing variation in Drosophila aging across independent experimental studies: a meta-analysis of survival data. Aging Cell. doi: 10.1111/acel.12123. (this issue), doi: 10.1111/acel.12123. [DOI] [PMC free article] [PubMed] [Google Scholar]
Associated Data
This section collects any data citations, data availability statements, or supplementary materials included in this article.