Abstract
Bistable regulatory elements enhance heterogeneity in cell populations and, in multicellular organisms, allow cells to specialize and specify their fate. Our study demonstrates that in a system of bistable genetic switch, the noise characteristics control in which of the two epigenetic attractors the cell population will settle. We focus on two types of noise: the gene switching noise and protein dimerization noise. We found that the change of magnitudes of these noise components for one of the two competing genes introduces a large asymmetry of the protein stationary probability distribution and changes the relative probability of individual gene activation. Interestingly, an increase of noise associated with a given gene can either promote or suppress activation of the gene, depending on the type of noise. Namely, each gene is repressed by an increase of its gene switching noise and activated by an increase of its protein-product dimerization noise. The observed effect was found robust to the large, up to 5-fold deviations of the model parameters. In summary, we demonstrated that noise itself may determine the relative strength of the epigenetic attractors, which may provide a unique mode of control of cell fate decisions.
Keywords: gene expression, toggle switch, bistability, stochastic processes, epigenetic attractors
1. Introduction
Bi- and multi-stable regulatory elements play an important role in cell signaling by introducing heterogeneity in cell populations and allowing cells in a multicellular organism to specialize and specify their fate. Attractors of genetic networks can be associated with distinct cell types achieved during cell differentiation [1, 2]. Although multistationarity is not required for the emergence of co-existing phenotypes [3] decisions between cell death, survival, proliferation or senescence are likely associated with bistability. In prokaryotes multistability is regarded as an optimal strategy for coping with varying environmental conditions [4].
In a single cell the relative occupancy of steady states is determined by their relative stability, while at the population level it is additionally governed by growth rates associated with particular steady states [5]. Intuitively, the relative strength of the macroscopic steady states should be controlled by the “shape” of the epigenetic landscape. Considering the epigenetic landscape as a potential energy landscape one could expect that the stability of a steady state increases with the depth of the associated potential well. The external stimulation that leads to the modification of the potential influences the relative stability of the steady states and may promote state-to-state transitions. Interestingly, noise itself was also found to be an important determinant of the relative occupancy of the macroscopic steady states [6, 7, 8, 9]. As shown by Vellela and Qian [6], in a bistable system the noise magnitude controls the probability mass fraction in each of the two attraction basins. In the limit of zero noise, generically, all probability mass concentrates in the vicinity of the most stable steady state [7]. Surprisingly, also the noise type (in addition to the noise magnitude) influences the relative stability of the macroscopic steady states. Analyzing a single autoregulatory gene by means of the chemical Langevin equation Frigola et al demonstrated that additive and multiplicative noise assumptions lead to different effective potentials [8]. Recently, by considering arbitrary noise functions, we showed that any steady state can become a global stochastic attractor for a particular choice of noise [7]. In a case of a single autoregulatory gene, we found that when the gene switching noise dominates the transcriptional/translational noise, the gene preferentially activates, while in the opposite case the gene preferentially remains inactive [9].
In this study we will focus on the role of noise in the toggle switch regulation. A toggle switch – a pair of mutual repressors – is considered as one of the most important regulatory elements exhibiting bistability [10, 11, 12, 13]. Using a toggle switch a single cell converts graded external stimuli into a binary answer expressing almost exclusively one of the two competing repressors. At the population level the graded stimuli are encoded by the fraction of cells expressing instantaneously the particular gene. Classical examples of toggle switches include the lysis/lysogeny switch in λ phage [14, 15, 16], several mitogen-activated protein kinase cascades in animal cells [17, 18, 19], and cell cycle regulatory CI circuits in Xenopus laevis and Saccharomyces cerevisiae [20, 21]. Another example of a toggle switch in bacteria is a tetracycline resistance circuit in Escherichia coli.
A synthetic toggle switch in E. coli was constructed by Gardner et al [22]. It was forced to flip between the steady states using a transient chemical or thermal induction. The toggle was constructed using the Lac repressor (lacI) in conjunction with Ptcr-2 promoter and either a PLs1con promoter in conjunction with a temperature-sensitive λ repressor (cIts), or PLtetO-1 promoter in conjunction with Tet repressor (tetR). The work of Gardner et al provides also a theoretical prediction of the conditions sufficient for bistability. Bistability arises when at least one of the inhibitors represses the expression of the competing gene with cooperativity greater than one. Later Lipshtat et al showed that exclusive toggle switches may exhibit bistability even without a cooperative binding [12]. In the exclusive switch, the two promoter sites overlap and thus two repressors cannot be bound simultaneously. In the simplest of the three considered models, despite the fact that the deterministic approximation predicts a single steady state, the stationary probability distribution (SPD) was found bimodal. The additional assumptions that either bound repressors may degrade, or that free repressor proteins may form inactive heterodimers led to bistable models with two macroscopic stable steady states [12].
Cells have evolved to survive in fluctuating environments taking advantage of the stochasticity present in the process of gene regulation. State-to-state transitions in a toggle switch are enabled by noise, whose magnitude controls switching rates [23, 24]. In a rapidly changing epigenetic landscape high noise is favorable as it allows for fast adaptation. It was shown theoretically that in a varied environment bacteria maximize fitness by tuning noise with the frequency of the environment fluctuations [25]. In the system of mutual repressors, the overall states stability can be controlled by noise associated with a mode of repression. As shown by Komorowski et al translational repression contributes greater noise to gene expression than transcriptional repression [26]. Warren et al demonstrated that overlapping upstream gene regulatory domains increases toggle stability i.e. decreases state-to-state transitions rates [27]. In general, the transitions times increase exponentially with the characteristic number of repressor molecules, and are reduced when proteins are synthesized in large bursts [28]. It is also known that the noise magnitude affects the dynamical characteristics of the toggle switch. As shown by Dai et al a deterministically bistable toggle switch has two stochastic (or noise) attractors only for a limited noise amplitude [29]. An excess of noise makes the toggle switch first tristable (with a new third state characterized by high expression of both genes), then monostable, with both genes expressing simultaneously. The model considered by Dai et al involves delays accounting for time duration of various gene expression processes. The considered delays are due to the formation of open promoter complex, ribosome clearance, transcriptional and translational elongation and posttranslational processing, see [30] for review.
In the current study we answer the question whether noise itself can control a relative stability of the two toggle macroscopic steady states. Such mode of control would enable activation or repression of a particular toggle gene without any modification of the associated epigenetic landscape. In the studied toggle switch model we consider explicitly processes of mRNA transcription, protein translation, protein dimer formation and gene repression. Each of these processes introduces a different type of noise to the system. We will show that the change of the magnitudes of noise components for any of the two competing genes alters the protein SPD and changes the probability mass fraction in each of the two basins of attraction. Interestingly, a decrease of noise associated with a given gene can promote activation of that gene or the other, depending on the type of noise.
2. Model
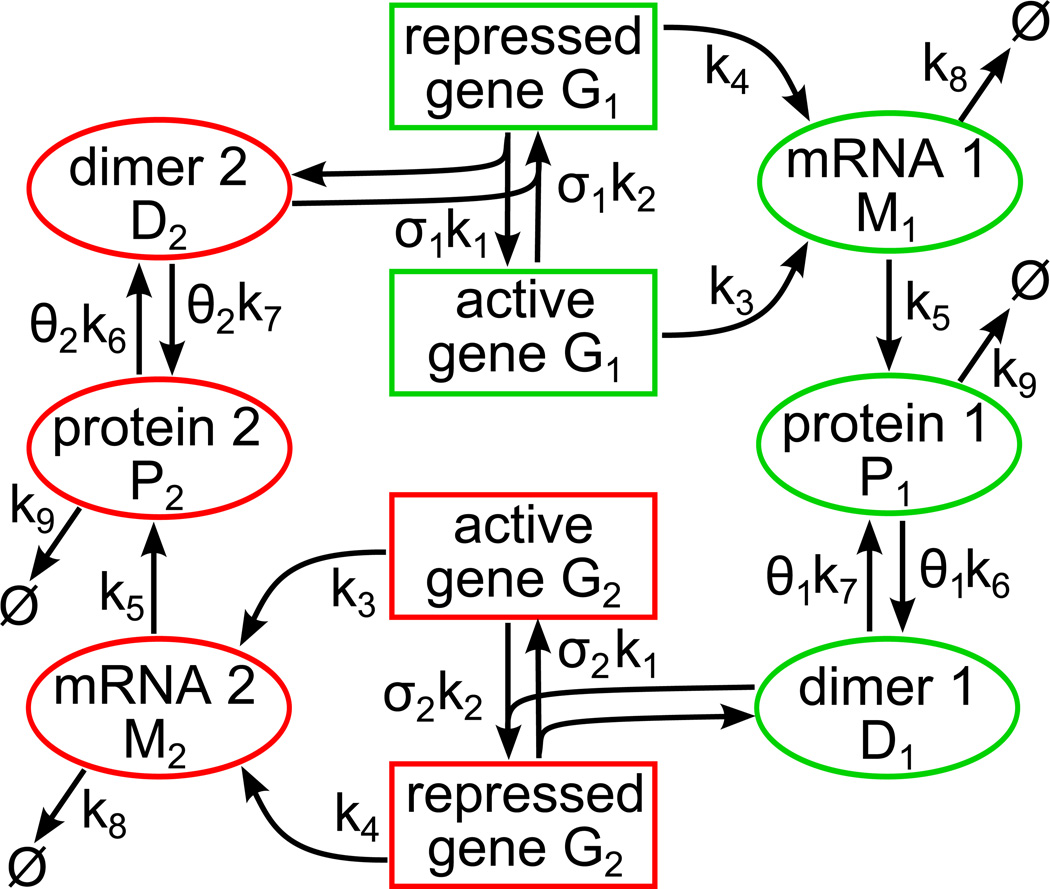
The toggle switch model consists of two competing genes: gene 1 and gene 2, figure 1. Each gene can be repressed by the competing gene protein dimer. Processes of gene repression, mRNA transcription, protein translation, dimer formation and dissociation are explicitly included in the model, table 1. Each of these processes is considered stochastic and contributes to noise in levels of molecules.
Figure 1.
The schematic of the stochastic toggle switch model. Each of two genes can be repressed by binding of the protein dimer molecule, the product of the competing gene. The repressed gene is activated by the dissociation of the dimer molecule (which returns to the pool of free dimers) from its promoter. We assume small, but non-zero mRNA transcription from the repressed genes. Other stochastic reactions explicitly included in the model are: protein translation, dimer formation and its dissociation, and degradation of mRNA and protein monomer molecules. We assume that dimers are much more stable than monomers and thus we neglect their degradation. Coefficients σi and θi control individual gene switching and dimerization noise components. For σ1 = σ2 and θ1 = σ2 all reaction corresponding propensities are equal for both genes (symmetric case).
Table 1.
Reaction rate constants
| Reaction | Symbol | Default value σi = 1, θi = 1 |
Physiological range for bacteria (volume 1 µm3) |
|---|---|---|---|
| gene repression by protein dimer binding | σik1 | 0.015 [1/(mlcl×s)] | unknowna |
| gene activation by protein dimer dissociation | σik2 | 0.003 [1/s] | unknownb |
| mRNA transcription from the active gene | k3 | 0.02 [1/s] | ≤ 0.84 [1/s]c |
| mRNA transcription from the repressed gene | k4 | 0.0006 [1/s] | d |
| protein translation | k5 | 0.01 [1/(mlcl×s)] | ~ 10−2 ÷ ~ 10 [1/s]e |
| dimer formation | θik6 | 0.0001 [1/(mlcl×s)] | 1.63 × 10⁻⁶ ÷ 9.47 [1/(mlcl×s)]f |
| dimer dissociation to monomers | θik7 | 0.01 [1/s] | 5 × 10⁻⁸ ÷ 1.9 × 10³ [1/s]g |
| mRNA degradation | k8 | 0.005 [1/s] | 10−2 ÷ 6 × 10⁻⁴ [1/s]h |
| protein monomer degradation | k9 | 0.0005 [1/s] | ~ 1.4 × 10⁻⁵ ÷ ~10−2 [1/s]i |
mlcl=molecule
For prokaryotes gene switching is faster then for eukaryotes [37].
For E. coli maximal transcription rate: 0.16 ÷ 0.84/s [38].
Translation initiation intervals are of the order of seconds, although they are specific for each mRNA [39]. E. coli: translation initiation rate may vary at least 1000-fold [40]; examples of translation initiation frequencies: β-galactosidase – 0.31/s (spacing between ribosomes: 110 nucleotides), galactoside acetyltransferase – 0.06/s (spacing between ribosomes: 580 nucleotides) [38]; maximal peptide chain elongation rate: 20 aa/s [41, 42]; average peptide chain elongation rate: 12 aa/s [38].
All cell types: 9.8 × 10²/(M × s) ÷ 5.7 × 10⁹/(M × s)[43]; for 1µm3 volume (bacterial) cell: 1.63×10⁻⁶/mlcl×s÷9.47/mlcl×s.
All cell types: 5×10⁻⁸/s÷1.9 × 103/s [43]. Dissociation constant range: 7.2 × 10⁻¹⁷ M ÷ 2.2 × 10⁻⁶ M [43]; for 1µm3 volume (bacteria) 4.34 × 10⁻⁸/mlcl×s÷1.32 × 103/mlcl×s.
The vast majority of mRNAs in a bacterial cell are very unstable, having a half life of about 3 minutes. Bacterial mRNAs are both rapidly synthesized and rapidly degraded [44]. The average mRNA copy number in E. coli is 10−4 ÷ 5 molecules/cell [45].
Most of bacterial proteins are very stable, with degradation rates: 1.4 × 10⁻⁵ ÷ 5.6 × 10⁻⁵/s [46]. Some proteins have much higher degradation rates. E. coli RNase R has degradation rate of 10−3/s (in exponential phase) [47], factor σ32 has degradation rate of 10−2/s (in steady-state growth phase) [48]. The average protein copy number in E. coli is 10−1 ÷ 104 molecules/cell [45].
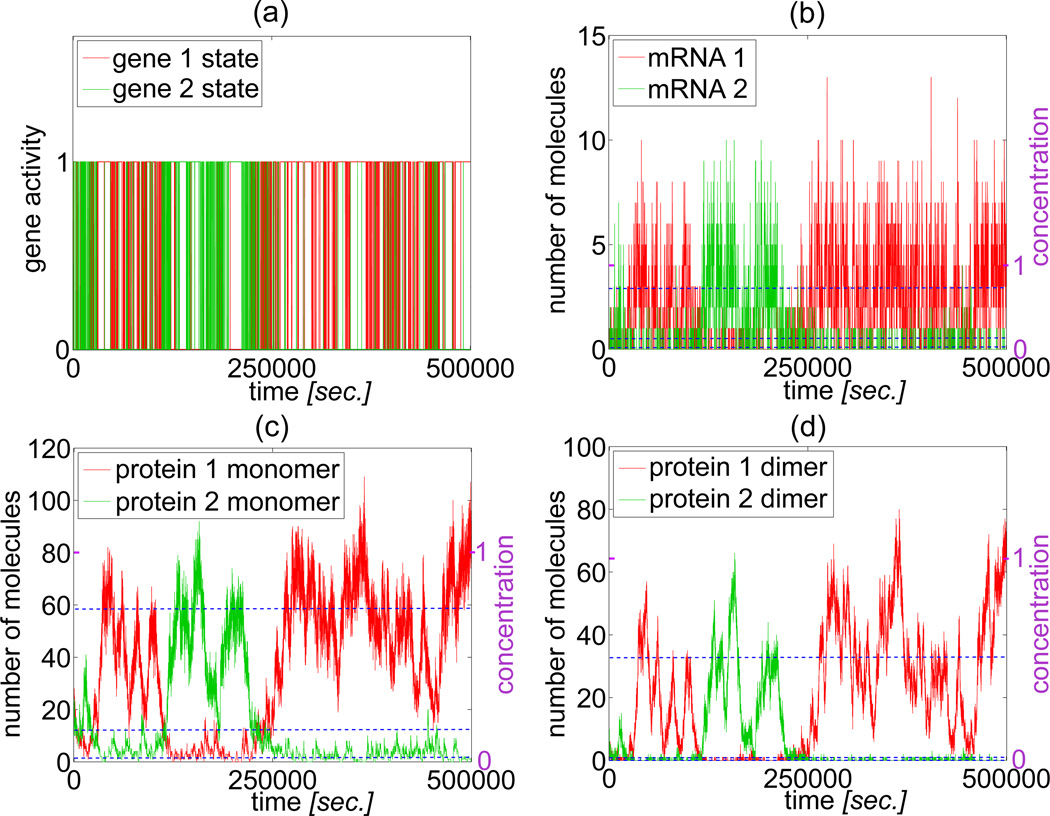
The model defines a time-continuous Markov process involving eight random variables: the gene 1 and gene 2 states, G1(t), G2(t) ∈ {0(repressed),1(active)}, numbers of molecules of the mRNA 1 and mRNA 2, M1(t), M2(t) ∈ ℕ, numbers of molecules of the protein monomer 1 and protein monomer 2, P1(t), P2(t) ∈ ℕ, numbers of molecules of the protein dimer 1 and protein dimer 2, D1(t), D2(t) ∈ ℕ. The default transition propensities ki, (i = 1…9) for each of the nine considered reactions (see figure 1) are assumed equal for both genes, table 1. These rates are chosen so that the system in the deterministic approximation is bistable, i.e. it has two stable steady state solutions, each corresponding to a high expression of one gene and a low expression of the another, and the unstable steady state for which both genes have the same relatively low expression. The stochastic trajectories switch between the basins of attraction of these two stable steady states, figure 2. The full symmetry between the two genes (for the default parameters) is manifested by the symmetric stationary probability distribution (SPD). The stochastic trajectories and the SPDs of the system were obtained in Gillespie algorithm simulations [31].
Figure 2.
The stochastic simulation trajectories for σi = θi = 1, i = 1, 2. Blue dashed lines denote steady states of the deterministic approximation. On the left vertical axis numbers of molecules are given, on the right vertical axis we show the scaled “concentrations” (see text). The corresponding protein monomer SPD is shown in Figure 4(a).
In the next section we will analyze the dynamics of the model with respect to the magnitudes of individual noise components. In particular we will focus on the gene switching and protein dimerization noises. The gene switching noise is controlled independently for each of the two genes by parameters σi (i = 1, 2), which multiply simultaneously rate constants of gene repression and gene activation, k1 and k2, respectively (see figure 1). The noise introduced by the gene switching decreases with the switching rates, and becomes zero in the adiabatic limit when these rates are infinite. We will thus consider 1/σi as the gene switching noise parameter. Parameter σi controls noise in the system, but, as we will see in the next section, its value does not influence steady states of the deterministic approximation of the system. The dimerization noise is controlled by parameters θi (i = 1, 2), which multiply simultaneously dimer association and dimer dissociation rate constants, respectively k6 and k7, see figure 1. Thus the dimerization noise of the gene i product decreases with increasing θi, but again the value of θi does not influence the steady state of the deterministic approximation of the system.
The control of the toggle switch coefficients by dimerization and gene switching noise parameters, was chosen because it allows us to separate noise effects from the effects resulting from modification of macroscopic steady states of the system. Such approach allows us to compare different stochastic systems having the same deterministic approximation.
3. Results
3.1. Deterministic approximation
We start the analysis of the model dynamics with an examination of its deterministic approximation. In the deterministic approximation the stochastic variables describing gene states Gi are replaced by continuous variables gi. The remaining variables, Mi, Pi, Di are considered continuous and are scaled by their maximal values, respectively M0, P0, D0, reached under the condition that each gene is in the active state.
| (1) |
The scaled variables:
| (2) |
will be referred to as scaled “concentrations”. Now, the considered Markov process can be approximated by the system of eight ordinary differential equations:
| (3) |
| (4) |
| (5) |
| (6) |
where i = 1,2 and j = 3−i. The deterministic approximation is accurate only when the characteristic numbers of molecules are large (enough to be replaced by the continuous concentrations). For bacteria this condition is seldom satisfied, and thus mass rate equations may serve only as a reference for the stochastic analysis. In particular, in equation 6, the loss of a (single) dimer molecule that binds DNA is neglected, although this loss is accounted in stochastic simulations.
The steady state values of p1 are given by the real roots of the fifth order polynomial,
| (7) |
The steady state values of the remaining variables are given by the following relations:
| (8) |
| (9) |
| (10) |
| (11) |
| (12) |
For the assumed parameters (table 1) the polynomial W(p1) has three real roots, and correspondingly the system has three steady states (figure 2 and figure 4(a)):
the unstable state S0: g1 = g2 ≈ 0.12, m1 = p1 = m2 = p2 ≈ 0.15, d1 = d2 ≈ 0.022,
-
the stable state S1:
g1 ≈ 0.00604, g2 ≈ 0.71, m1 = p1 ≈ 0.72, d1 ≈ 0.51, m2 = p2 ≈ 0.036, d2 ≈ 0.0013,
-
the stable state S2:
g1 ≈ 0.71, g2 ≈ 0.00604, m1 = p1 ≈ 0.036, d1 ≈ 0.0013, m2 = p2 ≈ 0.72, d2 ≈ 0.51.
In the steady state S1 the gene 1 is mostly active while the gene 2 is repressed. In the steady state S2 the gene 2 is mostly active and the gene 1 is repressed. In the deterministic approximation the choice of the stationary state is determined by the initial conditions, i.e. trajectories remain in the same basin of attraction. In figure 2 we show the correspondence between deterministic steady states S0, S1, and S2 and trajectories of the stochastic system. The scaled concentrations (given on right-hand-side of each panel) can be converted to the numbers of molecules (given on left-hand-side) by relations 2.
Figure 4.
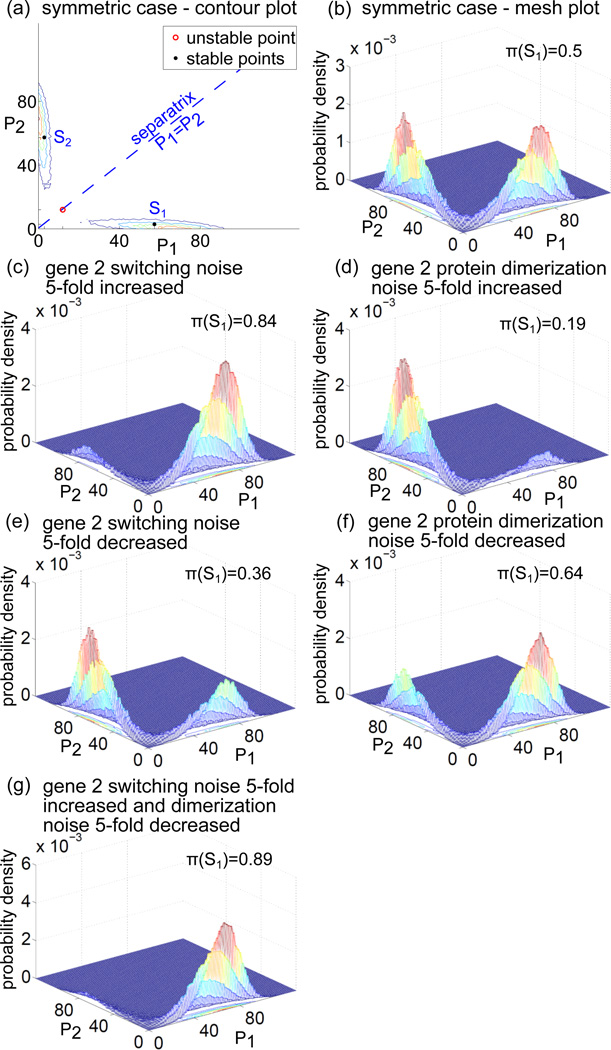
The SPDs of the stochastic model obtained in Monte Carlo simulations. Panels (a) and (b) show the contour and mesh plots in the symmetric case (σi = θi = 1, i = 1, 2). Panel (a): The stable steady states of the corresponding deterministic model are marked with dots, the unstable steady state is marked with a circle. An increase or decrease of noise associated with the gene 2 expression causes that the SPD becomes asymmetric. Panels (c), (d), (e) and (f ): Increase of the gene switching noise, causes that the probability mass concentrates in the vicinity of state S1, while an increase of dimerization noise causes that most of the probability mass concentrates in the vicinity of the state S2. A decrease of the gene switching noise causes that the probability mass concentrates in the state S2, while a decrease of the dimerization noise causes that most of the probability mass concentrates in the vicinity of the state S1. Panel (g): A simultaneous 5-fold increase of the gene 2 switching noise and a decrease of the gene 2 dimerization noise results in the largest asymmetry of the SPD, 89% of the probability mass concentrated in the state S1.
3.2. Stochastic model analysis
In the stochastic model, trajectories switch between the two basins of attraction, figure 2. Since the system is mutidimensional the exact determination of attraction basins is difficult. For practical purposes in order to determine mean residence times T1 and T2 in the basins of state S1 and state S2 (or shortly in states S1 and S2) we assume the following definitions of state-to-state transitions: the S1 to S2 transition occurs when P2 − P1 > P0(p1(S1) − p1(S2))/3 and in addition when D2 − D1 > D0(d1(S1) − d1(S2))/3, and analogously for the reverse transition. Accordingly, the events in which only P2−P1 becomes grater than P0(p1(S1) − p1(S2))/3, are not counted as state-to-state transitions. When performing sensitivity analysis (Section 3.3), we observe that for some sets of parameters (for which dimers have much higher stability than monomers) such pseudo-transitions are quite frequent but are not followed by a trajectory jump to the vicinity of the another steady state. For the similar reasons it is not enough to require that P2 and D2 simply exceeds P1 and D1, respectively. Such definition would lead to multiple pseudo-transitions accompanying almost every single real transition.
Stationary probability mass fractions in the vicinities of stable steady states S1 to S2 can be estimated from the mean residence times as π*(S1) ≔ T1/(T1 + T2) and π*(S2) ≔ T2/(T1 + T2). However, because the definition of state-to-state transitions is arbitrary, we will also estimate probability mass fractions independently to the mean residence times for a cross validation. We make use of the fact that in the deterministic approximation the system is symmetric with respect to both genes. This allows us to define π(S1) ≔ 〈G1〉 /(〈G1〉 + 〈G2〉) and π(S2) ≔ 〈G2〉 /(〈G1〉 + 〈G2〉), where 〈G1〉 denotes the average state of the gene 1, equal to the probability that the gene is active. The stationary probability mass fractions π(S1) and π(S2) will be estimated based on the long-run Gillespie algorithm simulations, having 1000 (for figures 3 and 5) or 100 (for figures 6 and 7) S1 to S2 (and reverse) transitions. Based on the same simulations we will also estimate the mean residence times T1 and T2.
Figure 3.
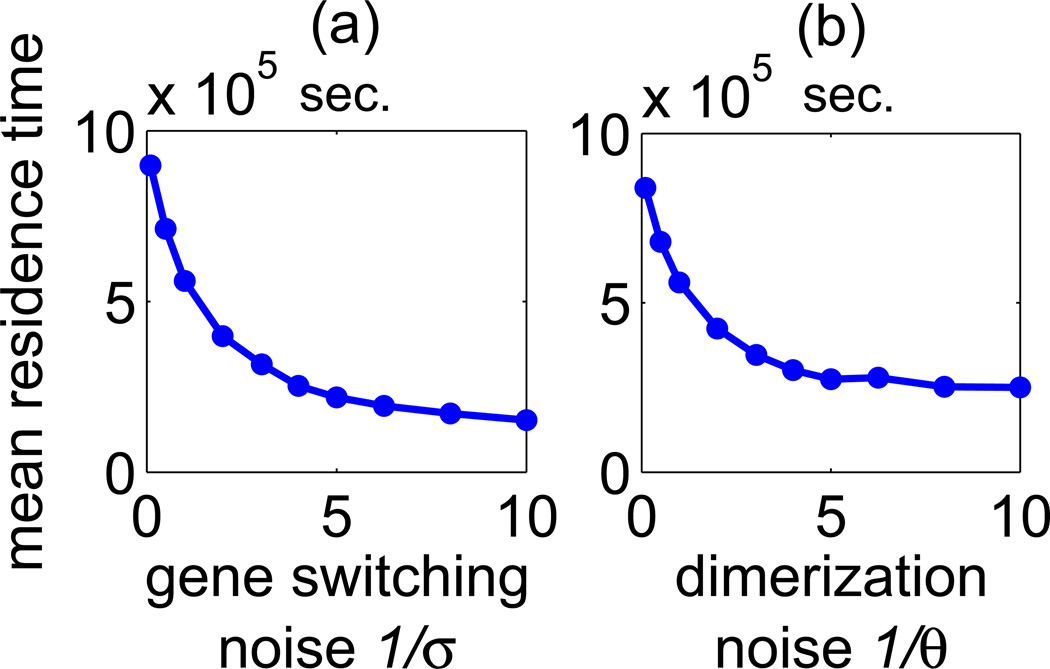
The mean residence time in states S1 and S2 calculated in the symmetric case as a function of the gene switching noise 1/σ or dimerization noise 1/θ, where σ = σ1 = σ2 and θ = θ1 = θ2.
Figure 5.
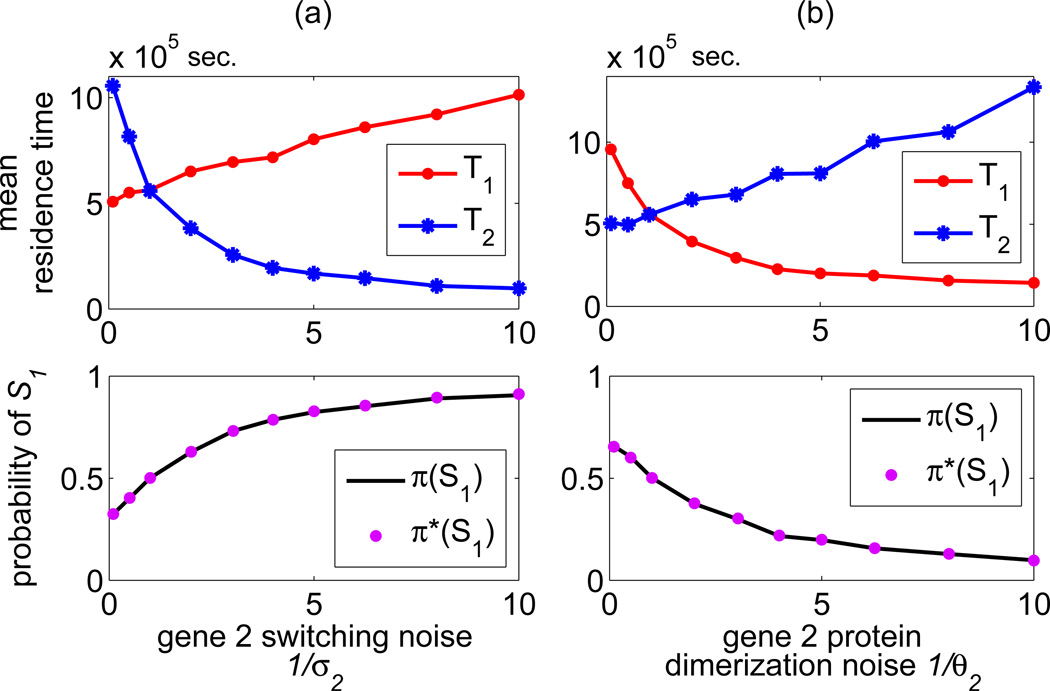
The mean residence times T1 and T2 in states S1 and S2 are plotted as a function of the gene 2 noise parameters 1/σ2 and 1/θ2 (with the remaining noise parameters equal 1). A decrease of σ2 increases the stability of the state S2 and simultaneously decreases the stability of the state S1 (panel (a)). In contrast, a decrease of θ2 increases stability of the state S1 and decreases stability of the state S2 (panel (b)). The two bottom subpanels show the probability of the state S1, as a function of the gene 2 noise parameters estimated as π(S1) = 〈G1〉 /(〈G1〉 + 〈G2〉) (line) and π̃(S1) = T1/(T1 + T2) dots.
Figure 6.
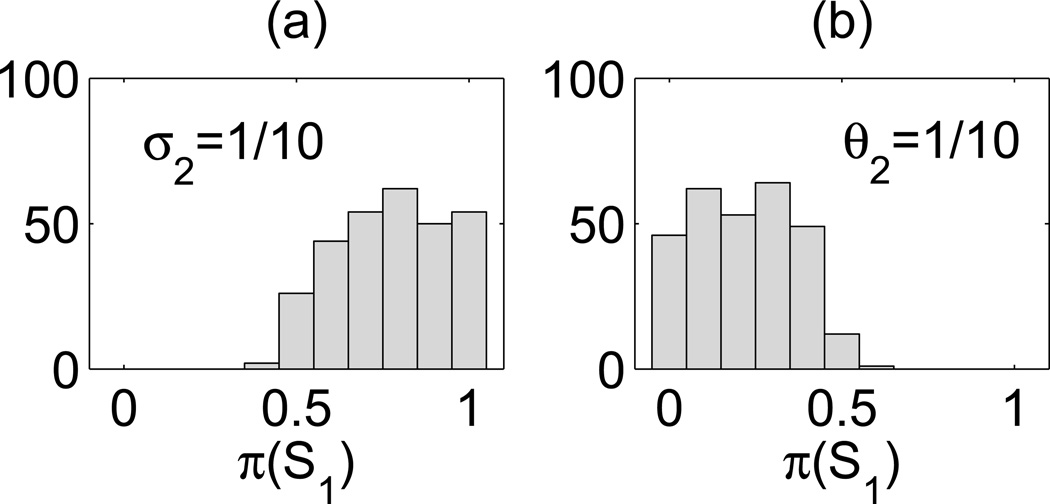
Histograms of probability π(S1) for parameters tossed based on the Latin hypercube sampling. All nine tossed parameters may vary five fold from their default values (except k3, see text for details). Panel (a): Increased gene 2 switching noise parameter, 1/σ2 = 10 (with σ1 = θ1 = θ2 = 1). Panel (b): Increased gene 2 dimerization noise parameter, 1/θ2 = 10 (with θ1 = σ1 = σ2 = 1). For the default parameters (see figure 5), π(S1) = 0.91 for 1/σ2 = 10 and π(S1) = 0.10 for 1/θ2 = 10.
Figure 7.
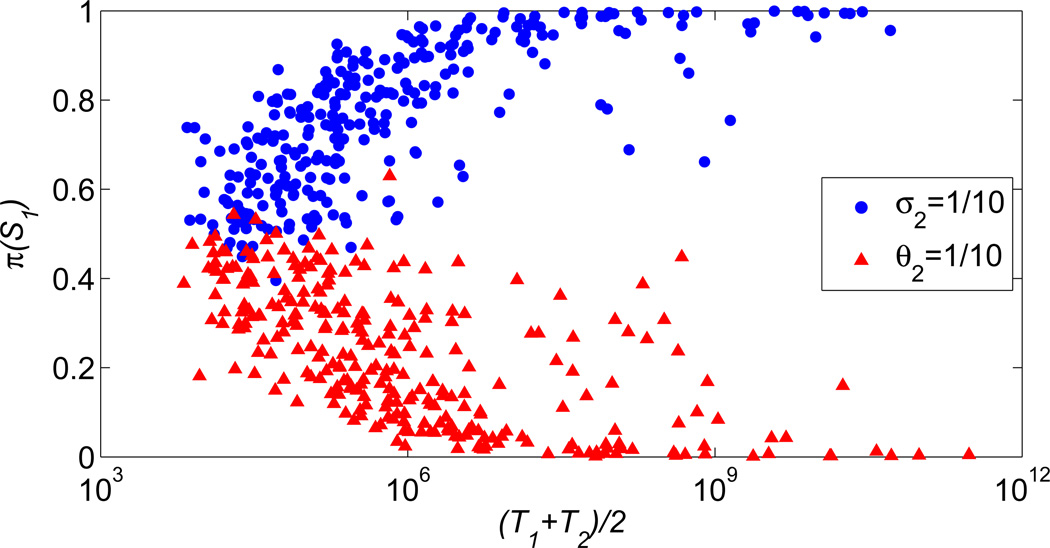
Scatter plots showing probability π(S1) versus average mean residence time (T1 + T2)/2.
As one could expect, in the symmetric case i.e. when σ1 = σ2 = σ and θ1 = θ2 = θ the mean residence times T1 and T2 are equal and decrease with the increasing magnitude of noise in the system. As shown in figure 3, an increase of any of the two considered noise components (i.e. 1/σ or 1/θ) leads to a shortening of the mean residence times in states S1 and S2. This allows for the interpretation of 1/σ and 1/θ as, respectively, the gene switching and dimerization noise parameters. As analyzed earlier by Warren and ten Wolde ([28]) the mean residence time decreases with increasing transcriptional noise (inversely proportional to the number of product molecules). We also observe this effect within the considered toggle switch model, see Appendix A.
Responses of the system to a non-symmetric change of noise parameters are less intuitive. In figure 4 we analyze changes of the SPD in response to the non-symmetric (only for gene 2) five-fold change of the gene switching or dimerization noise. As shown (figure 4(c)), the increase of the gene 2 switching noise induces a break of symmetry of the SPD, such that the probability mass fraction concentrates in the vicinity of state S1 (i.e. the state in which the gene 1 is predominantly active) with π(S1) = 0.84. In turn, the decrease of the gene 2 switching noise makes the gene 2 dominant, with π(S1) = 0.36 (figure 4(e)). Surprisingly, the increase of the dimerization noise for the gene 2 protein causes the gene 2 activation (with π(S1) = 0.19, figure 4(d)), while the decrease of the gene 2 protein dimerization noise causes the gene 1 activation (with π(S1) = 0.64, figure 4(f)).
In short, an increase of noise associated with a given gene may either promote or suppress its activation depending on the increased noise component. An increase of the gene switching noise promotes the activity of the competing gene, while an increase of the dimerization noise suppresses the competing gene activation. These two opposing effects can be combined by the simultaneous five-fold increase of the gene 2 switching noise, and five-fold decrease of its product dimerization noise, which leads to an almost full suppression of the gene 2 activity, with π(S1) = 0.89, figure 4(g).
The results shown in figure 4 are supported by the analysis of the mean residence times T1 and T2, figure 5. As shown in figure 5(a) an increase of the gene 2 switching noise induces an increase of the time T1, and a decrease of the time T2. In contrast, an increase of the gene 2 protein dimerization noise leads to an increase of the time T2 and simultaneously leads to a decrease of the time T1. The above analysis implies that an increase of the gene switching noise stabilizes the gene in the inactive state, and destabilizes it in the active state. The increase of a given gene product dimerization noise stabilizes that gene in the active state and additionally eases inhibition of the competing gene.
As shown in figure 5 the probability mass fraction π(S1) (defined, recall, as π(S1) ≔ 〈G1〉 /(〈G1〉 + 〈G2〉)) is almost equal to π*(S1) ≔ T1/(T1 + T2), showing the perfect consistency of these two measures. Accordingly, π(S1) is a monotonically growing function of the gene 2 switching noise (with π(S1) = 0.91 for 1/σ2 = 10) and a monotonically decreasing function of the gene 2 protein dimerization noise (with π(S1) = 0.10 for 1/θ2 = 10), figure 5, two bottom subpanels.
The results presented in figure 3 and figure 5 can be explained as follows. As shown in figure 4, trajectories transit between states S1 and S2 through the vicinity of state S0 in which both genes are mainly repressed, and the levels of both proteins are low. Thus, the S1 to S2 transition requires repression of the active gene (G1) by binding of a protein dimer, product of the repressed gene (G2). These dimers arise infrequently due to the small mRNA synthesis from the repressed gene G2 (coefficient k4, Table 1). A detailed analysis of the trajectory which short fragment is shown in figure 2 indicates that for the default parameters less than 1% of the active gene switching-off events leads to a state-to-state (S1 to S2 or reverse) transition, compare figure 2(a) and (c). When gene switching noise increases, say 10-fold, the gene switching-off events are 10 times less frequent, but the time for which the gene is switched off is 10 times longer. We found that these longer switch-offs are much more effective, and almost all of them leads to state-to-state transitions. As a result increase of the gene 2 switching noise shortens the mean residence time T2 (in S2) figure 5(a). Simultaneous increase of the gene switching noise for gene 1 and gene 2, shortens both T1 and T2, figure 3(a).
As said, the active gene switching-offs follow ae synthesis of single dimers from the repressed gene. For the default parameters a synthesis of a single dimer leads in average to k1/k7 = 1.5 switching-off events (less when several dimers compete for the binding site). When the gene 2 dimerization noise increases, say 10-fold, gene 2 dimers appear 10-fold less frequently, but survive 10 times longer. As a result appearance of a single dimer leads to k1/(k7/10) = 15 switching-off events. Because these switch-offs arise in series, they have much higher chance to induce S1 to S2 transition. As a result when the gene 2 dimerization noise increases, the time T1 decreases, figure 5(b). Simultaneously, the time T2 increases, because a S2 to S1 transition requires longer repression of the gene 2, necessary for protein dimers of the gene 2 to dissociate to monomers, figure 5(b). The last effect, however, is weaker than the previous one, and therefore a simultaneous increase of protein 1 and protein 2 dimerization noises leads to the decrease both T1 and T2, figure 3(b).
3.3. Sensitivity analysis
In order to analyze the sensitivity of the presented results to a model parameters variation we perform systematic robustness analysis based on the Latin hypercube parameter sampling. This is, we toss 600 points (Xi, i = 1…9) from the nine dimensional unit cube. Based on the tossed Xi, we calculated 600 sets of new coefficients Ki, as
| (13) |
Thus the new coefficients are allowed to vary 5 fold above and 5 fold below the default values, except for parameter k3 for which the variation was two-fold. The 5-fold variation of k3 led to very long mean residence times, increasing numerical cost of simulations. From the obtained 600 sets of parameters we left 322 sets for which the system in the deterministic approximation maintained bistability.
For these selected sets of parameters we calculated the probability mass fraction π(S1) ≔ 〈G1〉 /(〈G1〉 + 〈G2〉), and the average mean transition time (T1 + T2)/2 in the case when either gene switching or dimerization noise was increased 10-fold for one of genes. This is, we analyze two cases:
when the gene 2 switching noise parameter is 1/σ2 = 10 (with σ1 = θ1 = θ2 = 1),
when the gene 2 dimerization noise parameter is 1/θ2 = 10 (with θ1 = σ1 = σ2 = 1).
Calculations were made using the same method as previously based on simulations with 100 transitions.
In the first (second) case we managed to accomplish 292 (287) out of 322 simulations. In the remaining simulations the S1 to S2 (or reverse) transitions rates were so small, that we were not able to reach 100 S1 to S2 transitions. In these cases the relative state occupancies can be calculated using the forward flux sampling methods developed by group of ten Wolde [32, 33]. However, because these methods are challenging for multidimensional systems, we simply remove the unfinished simulations from the further analysis. As will be demonstrated later, since the studied effect of the SPD asymmetry increases with decreasing transitions rates, we remain confident that inclusion of these unfinished trajectories would only improve our results.
In figure 6(a) and (b) we show histograms of probability π(S1) in the first and second case, respectively. Let us recall that in simulations performed for the default parameters (figure 5), we obtained π(S1) = 0.91 for 1/σ2 = 10 and π(S1) = 0.1 for 1/θ2 = 10. Here, we found that for 1/σ2 = 10, the probability mass fraction π(S1) > 0.5 for 97% of tossed and computed sets of parameters, and that the average 〈π(S1)〉 = 0.77. For 1/θ2 = 10 case the probability mass fraction π(S1) < 0.5 for 99% of tossed and computed sets of parameters, and that the average 〈π(S1)〉 = 0.23.
In figure 7 we present the scatter plot showing the probability mass fraction π(S1) versus average mean residence time (T1 + T2)/2. The red and blue dots correspond to 1/σ2 = 10 and 1/θ2 = 10 cases, respectively. The presented data indicate that the asymmetry of the SPD increases with the mean residence time i.e. the stability of the toggle switch. This finding is important, since bacterial toggle switches can be extremely stable with transition times exceeding millions of cell cycles [34].
4. Conclusions
In this study we considered a bistable stochastic model of the genetic toggle switch. The reactions of mRNA transcription, protein translation, dimerization, and gene repression by binding of the competing protein dimers are explicitly included in the model. We focused on the two stochasticity sources present in the regulation: the gene switching and the protein dimerization noise. These two noise components were modified independently by changing simultaneously repressor binding and dissociation rate constants, or rate constants of a protein dimer formation and dissociation. This procedure enabled us to modify the noise characteristics of the system without influencing the deterministic limit of the process.
Our analysis demonstrated that an increase of noise associated with the expression of a particular gene introduces a large asymmetry in the SPD. Interestingly, we observe that each of the genes is repressed by increasing its gene switching noise (i.e. when its promoter repression and activation rates decrease). In contrast, the increased dimerization noise for a particular gene product leads to the preferential activation of the gene. We thus showed that various noise components associated with gene expression and protein processing antagonistically contribute to the strength of each of the two competing genes.
The sensitivity analysis based on the Latin hypercube parameters sampling demonstrated that the SPD asymmetry introduced by an increase of particular noise component is statistically robust with respect to the large (up to 5-fold) parameters deviations, that change macroscopic steady states as well as state-to-state transitions rates. The effect of the preferential gene inactivation due to gene switching noise increase, observed for the assumed default parameters, was conserved for 283 out of 292 tossed and computed parameter sets. Similarly the effect of the preferential gene activation due its product protein dimerization noise increase was conserved for 283 out of 287 tossed and computed parameter sets. Importantly, we found that the scale of the noise introduced asymmetry positively correlates with the stability of the toggle switch. The asymmetry was statistically increasing with mean residence time, which calculated for the tossed parameters sets varied about 8 orders of magnitude. This implies that the discovered effect can be important in bacterial toggle switches which may exhibit enormous stability, with one transition over millions of generation.
The observation that magnitudes of individual noise components determine the dominating gene opens the possibility of the new mode of a toggle switch control. Such a control can be potentially exploited in the synthetic biology, which offers tools for an independent modification of various noise sources [35, 36]. It remains an open question whether extracellular conditions can switch the toggle by modifications of noise components. Such regulation seems quite likely for bacteria. For example, the temperature can modify repressor binding and dissociation rate constants and a level of nutrients may regulate transcription and translation rates. The potential advantage of the noise driven control is such that it does not influence macroscopic steady states of the system and thus assures that the cell remains in one of the predefined local optima.
Acknowledgments
We thank Marek Kochańczyk for help in numerical simulations. This study was supported by the FNP grant TEAM/2009-3/6 and NSF/NIH grant no. R01-GM086 885. Numerical simulations were carried out at the Zeus computer cluster at the ACK Cyfronet AGH in Kraków.
Appendix
Appendix A: Decrease of the mean residence time with increasing transcriptional noise
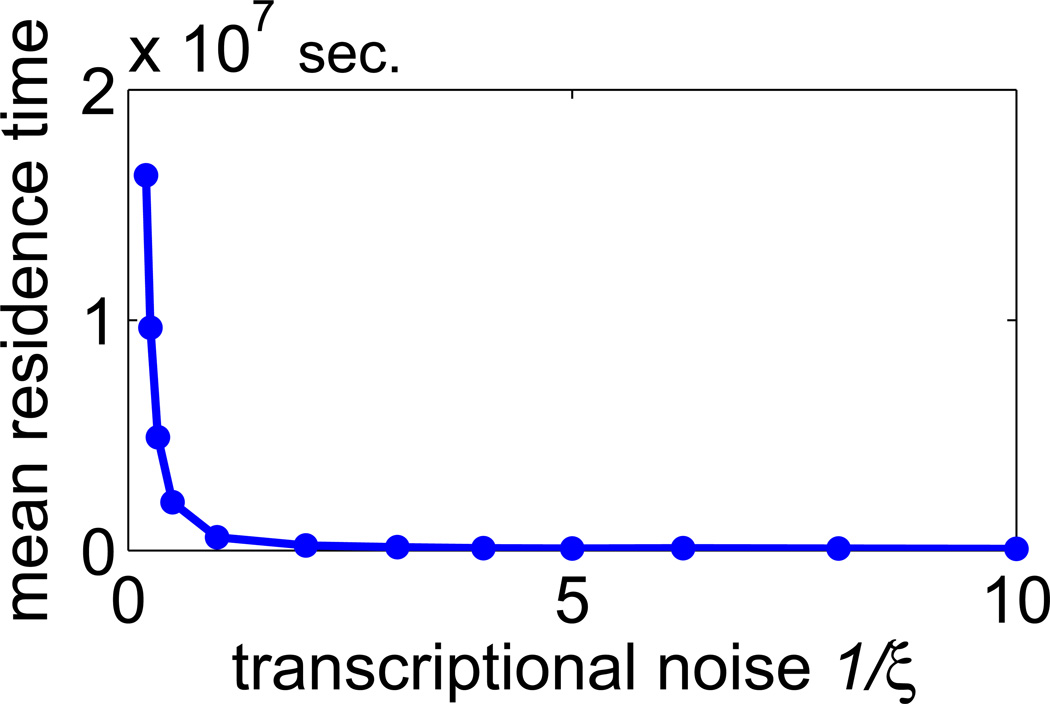
Here, we analyze the effect of transcriptional noise introducing new coefficient ξ. Multiplying the mRNA transcription rate coefficient k3 by ξ, and simultaneously dividing dimerization and DNA-dimer binding coefficients k6 and k1 by ξ we obtain systems characterized by ξ-fold larger (than default) number of mRNA, protein monomer and protein dimer molecules, but the same scaled concentrations. The inverse of coefficient ξ can be thus considered as a measure of transcriptional noise. In figure 8, we show that the mean residence time decreases with the magnitude of transcriptional noise 1/ξ.
Figure 8.
Mean residence time as a function of transcriptional noise 1/ξ.
References
- 1.Acar M, Becskei A, van Oudenaarden A. Enhancement of cellular memory by reducing stochastic transitions. Nature. 2005;435:228–232. doi: 10.1038/nature03524. [DOI] [PubMed] [Google Scholar]
- 2.Chang HH, Oh PY, Ingber DE, Huang S. Multistable and multistep dynamics in neutrophil differentiation. BMC Cell Biol. 2006;7:11. doi: 10.1186/1471-2121-7-11. [DOI] [PMC free article] [PubMed] [Google Scholar]
- 3.Hoyle RB, Avitabile D, Kierzek AM. Equation-free analysis of two-component system signalling model reveals the emergence of co-existing phenotypes in the absence of multistationarity. PLoS Comput Biol. 2012;8:e1002396, 1–18. doi: 10.1371/journal.pcbi.1002396. [DOI] [PMC free article] [PubMed] [Google Scholar]
- 4.Kussell E, Leibler S. Phenotypic diversity, population growth, and information in fluctuating environments. Science. 2005;309:2075–2078. doi: 10.1126/science.1114383. [DOI] [PubMed] [Google Scholar]
- 5.Nevozhay D, Adams RM, Van Itallie E, Bennett MR, Balazsi G. Mapping the environmental fitness landscape of a synthetic gene circuit. PLoS Comp Biol. 2012;8:e1002480, 1–17. doi: 10.1371/journal.pcbi.1002480. [DOI] [PMC free article] [PubMed] [Google Scholar]
- 6.Vellela M, Qian H. Stochastic dynamics and non-equilibrium thermodynamics of a bistable chemical system: the Schloegl model revisited. J R Soc Interface. 6:925–940. doi: 10.1098/rsif.2008.0476. [DOI] [PMC free article] [PubMed] [Google Scholar]
- 7.Zuk PJ, Kochánczyk M, Jaruszewicz J, Bednorz W, Lipniacki T. Dynamics of a stochastic spatially extended system predicted by comparing deterministic and stochastic attractors of the corresponding birth-death process. Phys Biol. 2012;9:055002, 1–12. doi: 10.1088/1478-3975/9/5/055002. [DOI] [PubMed] [Google Scholar]
- 8.Frigola D, Casanellas L, Sancho JM, Ibanes M. Asymmetric stochastic switching driven by intrinsic molecular noise. PLoS One. 2012;7:e31407. doi: 10.1371/journal.pone.0031407. [DOI] [PMC free article] [PubMed] [Google Scholar]
- 9.Jaruszewicz J, Zuk PJ, Lipniacki T. Type of noise defines global attractors in bistable molecular regulatory systems. J Theor Biol. 2013;317:140–151. doi: 10.1016/j.jtbi.2012.10.004. [DOI] [PMC free article] [PubMed] [Google Scholar]
- 10.Ferrell JE., Jr Self-perpetuating states in signal transduction: positive feedback, double-negative feedback and bistability. Curr Opin Cell Biol. 2002;14:140–148. doi: 10.1016/s0955-0674(02)00314-9. [DOI] [PubMed] [Google Scholar]
- 11.Tian T, Burrage K. Stochastic models for regulatory networks of the genetic toggle switch. Proc Natl Acad Sci USA. 2006;103:8372–8377. doi: 10.1073/pnas.0507818103. [DOI] [PMC free article] [PubMed] [Google Scholar]
- 12.Lipshtat A, Loinger A, Balaban NQ, Biham O. Genetic toggle switch without cooperative binding. Phys Rev Lett. 2006;96:188101-1–188101-4. doi: 10.1103/PhysRevLett.96.188101. [DOI] [PubMed] [Google Scholar]
- 13.Chatterjee A, Kaznessis YN, Hu W-S. Tweaking biological switches through a better understanding of bistability behavior. Curr Opin Biotechnol. 2008;19:475–481. doi: 10.1016/j.copbio.2008.08.010. [DOI] [PMC free article] [PubMed] [Google Scholar]
- 14.Ptashne M. A Genetic switch: Phage and higher organisms. Cambridge MA: Cell Press and Blackwell Scientific Publications; 1992. [Google Scholar]
- 15.Arkin A, Ross J, McAdams HH. Stochastic kinetic analysis of development pathway bifurcation in phage lambda-infected Escherichia coli cells. Genetics. 1998;149:1633–1648. doi: 10.1093/genetics/149.4.1633. [DOI] [PMC free article] [PubMed] [Google Scholar]
- 16.Tian T, Burrage K. Bistability and switching in the lysis/lysogeny genetic regulatory network of bacteriophage λ. J Theor Biol. 2004;227:229–237. doi: 10.1016/j.jtbi.2003.11.003. [DOI] [PubMed] [Google Scholar]
- 17.Ferrell JE, Machleder EM. The biochemical basis of an all-or-none cell fate switch in Xenopus oocytes. Science. 1998;280:895–898. doi: 10.1126/science.280.5365.895. [DOI] [PubMed] [Google Scholar]
- 18.Bhalla US. MAP kinase phosphatase as a locus of flexibility in a mitogen-activated protein kinase signaling network. Science. 2002;297:1018–1023. doi: 10.1126/science.1068873. [DOI] [PubMed] [Google Scholar]
- 19.Bagowski CP, Ferrell JE. Bistability in the JNK cascade. Curr Biol. 2001;11:1176–1182. doi: 10.1016/s0960-9822(01)00330-x. [DOI] [PubMed] [Google Scholar]
- 20.Pomerening JR, Sontag ED, Ferrell JJ. Building a cell cycle oscillator: hysteresis and bistability in the activation of Cdc2. Nat Cell Biol. 2003;5:346–351. doi: 10.1038/ncb954. [DOI] [PubMed] [Google Scholar]
- 21.Cross FR, Archambault V, Miller M, Klovstad M. Testing a Mathematical Model of the Yeast Cell Cycle. Mol Biol Cell. 2002;13:52–70. doi: 10.1091/mbc.01-05-0265. [DOI] [PMC free article] [PubMed] [Google Scholar]
- 22.Gardner TS, Cantor CR, Collins JJ. Construction of a genetic toggle switch in Escherichia coli. Nature. 2000;403:339–342. doi: 10.1038/35002131. [DOI] [PubMed] [Google Scholar]
- 23.Puszynski K, Hat B, Lipniacki T. Oscillations and bistability in the stochastic model of p53 regulation. J Theor Biol. 2008;254:452–465. doi: 10.1016/j.jtbi.2008.05.039. [DOI] [PubMed] [Google Scholar]
- 24.Lipniacki T, Hat B, Faeder JR, Hlavacek WS. Stochastic effects and bistability in T cell receptor signaling. J Theor Biol. 2008;254:110–122. doi: 10.1016/j.jtbi.2008.05.001. [DOI] [PMC free article] [PubMed] [Google Scholar]
- 25.Ribeiro AS. Dynamics and evolution of stochastic bistable gene networks with sensing in fluctuating environments. Phys Rev E. 2008;78:061902-1–061902-9. doi: 10.1103/PhysRevE.78.061902. [DOI] [PubMed] [Google Scholar]
- 26.Komorowski M, Miekisz J, Kierzek AM. Translational Repression Contributes Greater Noise to Gene Expression than Transcriptional Repression. Biophys J. 2009;96:372–384. doi: 10.1016/j.bpj.2008.09.052. [DOI] [PMC free article] [PubMed] [Google Scholar]
- 27.Warren PB, ten Wolde PR. Enhancement of the stability of genetic switches by overlapping upstream regulatory domains. Phys Rev Lett. 2004;92:128101-1–128101-4. doi: 10.1103/PhysRevLett.92.128101. [DOI] [PubMed] [Google Scholar]
- 28.Warren PB, ten Wolde PR. Chemical models of genetic toggle switches. J Phys Chem B. 2005;109:6812–6823. doi: 10.1021/jp045523y. [DOI] [PubMed] [Google Scholar]
- 29.Dai X, Yli-Harja O, Ribeiro AS. Determining noisy attractors of delayed stochastic gene regulatory networks from multiple data sources. Bioinformatics. 2009;25:2362–2368. doi: 10.1093/bioinformatics/btp411. [DOI] [PubMed] [Google Scholar]
- 30.Ribeiro AS. Stochastic and delayed stochastic models of gene expression and regulation. Math Biosci. 2010;223:1–11. doi: 10.1016/j.mbs.2009.10.007. [DOI] [PubMed] [Google Scholar]
- 31.Gillespie DT. Exact stochastic simulation of coupled chemical reactions. J Phys Chem. 1977;81:2340–2361. [Google Scholar]
- 32.Allen RJ, Warren PB, tenWolde PR. Sampling rare switching events in biochemical networks. Phys Rev Lett. 2005;94:018104-1–018104-4. doi: 10.1103/PhysRevLett.94.018104. [DOI] [PubMed] [Google Scholar]
- 33.Becker NB, Allen RJ, ten Wolde PR. Non-stationary forward flux sampling. J Chem Phys. 2012;136:174118-1–174118-18. doi: 10.1063/1.4704810. [DOI] [PubMed] [Google Scholar]
- 34.Aurell E, Brown S, Johanson J, Sneppen K. Stability puzzles in phage λ. Phys Rev E. 2002;65:051914-1–051914-8. doi: 10.1103/PhysRevE.65.051914. [DOI] [PubMed] [Google Scholar]
- 35.Kierzek AM, Zaim J, Zielenkiewicz P. The effect of transcription and translation initiation frequencies on the stochastic fluctuations in prokaryotic gene expression. J Biol Chem. 2001;276:8165–8172. doi: 10.1074/jbc.M006264200. [DOI] [PubMed] [Google Scholar]
- 36.Ozbudak EM, Thattai M, Kurtser I, Grossman AD, Oudenaarden A. Regulation of noise in the expression of a single gene. Nat Genet. 2002;31:69–73. doi: 10.1038/ng869. [DOI] [PubMed] [Google Scholar]
- 37.Blake WJ, Kaern M, Cantor CR, Collins JJ. Noise in eukaryotic gene expression. Nature. 2003;422:633–637. doi: 10.1038/nature01546. [DOI] [PubMed] [Google Scholar]
- 38.Kennell D, Riezman H. Transcription and translation initiation frequencies of the Escherichia coli lac operon. J Mol Biol. 1977;114:1–21. doi: 10.1016/0022-2836(77)90279-0. [DOI] [PubMed] [Google Scholar]
- 39.Laursen BS, Soerensen HP, Mortensen KK, Sperling-Petersen HU. Initiation of protein synthesis in bacteria. Microbiol Mol Biol Rev. 2005;69:101–123. doi: 10.1128/MMBR.69.1.101-123.2005. [DOI] [PMC free article] [PubMed] [Google Scholar]
- 40.Sampson LL, Hendrix RW, Huang WM, Casjens SR. Translation initiation controls the relative rates of expression of the bacteriophage λ late genes. Proc Natl Acad Sci USA. 1988;85:5439–5443. doi: 10.1073/pnas.85.15.5439. [DOI] [PMC free article] [PubMed] [Google Scholar]
- 41.Young R, Bremer H. Polypeptide-chain-elongation rate in Escherichia coli B/r as a function of growth rate. Biochem J. 1976;160:185–194. doi: 10.1042/bj1600185. [DOI] [PMC free article] [PubMed] [Google Scholar]
- 42.Bremer H, Hymes J, Dennis PP. Ribosomal RNA chain growth rate and RNA labelling patterns in Escherichia Coli. J Theor Biol. 1974;45:379–403. doi: 10.1016/0022-5193(74)90120-9. [DOI] [PubMed] [Google Scholar]
- 43.Bai H, Yang K, Yu D, Zhang C, Chen F, Lai L. Predicting kinetic constants of protein–protein interactions based on structural properties. Proteins. 2011;79:720–734. doi: 10.1002/prot.22904. [DOI] [PubMed] [Google Scholar]
- 44.Alberts B, Johnson A, Lewis J, Raff M, Roberts K, Walter P. Molecular Biology of the Cell. 4th edition. New York: Garland Science; 2002. [Google Scholar]
- 45.Taniguchi Y, Choi PJ, Li GW, Chen H, Babu M, Hearn J, Emili A, Xie XS. Quantifying E. coli proteome and transcriptome with single-molecule sensitivity in single cells. Science. 2010;329:533–538. doi: 10.1126/science.1188308. [DOI] [PMC free article] [PubMed] [Google Scholar]
- 46.Jayapal KP, Sui S, Philp RJ, Kok Y-J, Yap MGS, Griffin TJ, Hu W-S. Multitagging proteomic strategy to estimate protein turnover rates in dynamic systems. J Proteome Res. 2010;9:2087–2097. doi: 10.1021/pr9007738. [DOI] [PubMed] [Google Scholar]
- 47.Chen C, Deutscher MP. RNase R is a highly unstable protein regulated by growth phase and stress. RNA. 2010;16:667–672. doi: 10.1261/rna.1981010. [DOI] [PMC free article] [PubMed] [Google Scholar]
- 48.El-Samad H, Kurata H, Doyle JC, Gross CA, Khammash M. Surviving heat shock: Control strategies for robustness and performance. Proc Natl Acad Sci USA. 2005;102:2736–2741. doi: 10.1073/pnas.0403510102. [DOI] [PMC free article] [PubMed] [Google Scholar]


