

Abstract
Historically, association of disease with the major histocompatibility complex (HLA) genes has been tested with HLA alleles that encode antigen-binding affinity. The association with Parkinson disease (PD), however, was discovered with noncoding SNPs in a genome-wide association study (GWAS). We show here that several HLA-region SNPs that have since been associated with PD form two blocks tagged by rs3129882 (p = 9 × 10⁻¹¹) and by rs9268515 and/or rs2395163 (p = 3 × 10⁻¹¹). We investigated whether these SNP-associations were driven by HLA-alleles at adjacent loci. We imputed class I and class II HLA-alleles for 2000 PD cases and 1986 controls from the NeuroGenetics Research Consortium GWAS and sequenced a subset of 194 cases and 204 controls. We were therefore able to assess accuracy of two imputation algorithms against next-generation-sequencing while taking advantage of the larger imputed data sets for disease study. Additionally, we imputed HLA alleles for 843 cases and 856 controls from another GWAS for replication. PD risk was positively associated with the B∗07:02_C∗07:02_DRB5∗01_DRB1∗15:01_DQA1∗01:02_DQB1∗06:02 haplotype and negatively associated with the C∗03:04, DRB1∗04:04 and DQA1∗03:01 alleles. The risk haplotype and DQA1∗03:01 lost significance when conditioned on the SNPs, but C∗03:04 (OR = 0.72, p = 8 × 10⁻⁶) and DRB1∗04:04 (OR = 0.65, p = 4 × 10⁻⁵) remained significant. Similarly, rs3129882 and the closely linked rs9268515 and rs2395163 remained significant irrespective of HLA alleles. rs3129882 and rs2395163 are expression quantitative trait loci (eQTLs) for HLA-DR and HLA-DQ (9 × 10⁻⁵ ≥ PeQTL ≥ 2 × 10−79), suggesting that HLA gene expression might influence PD. Our data suggest that PD is associated with both structural and regulatory elements in HLA. Furthermore, our study demonstrates that noncoding SNPs in the HLA region can be associated with disease irrespective of HLA alleles, and that observed associations with HLA alleles can sometimes be secondary to a noncoding variant.
Main Text
HLA is one of the most complex regions in the human genome because it has a high density of closely linked genes, extreme polymorphism, and complicated patterns of linkage disequilibrium (LD) (Figure 1). HLA class I and class II genes encode molecules that bind antigens and present them to T cell receptors, a function that is critical for adaptive immune responses. HLA is associated with numerous autoimmune, infectious, malignant, and neurologic disorders. These associations have been established with the classical HLA alleles, i.e., those that encode structural variations that affect antigen-binding affinity. However, the association of HLA with Parkinson’s disease (PD [MIM 168600]) was discovered with noncoding SNPs in a genome-wide association study (GWAS).1 Subsequently, several other GWASs and SNP-based studies confirmed the association of PD with HLA and identified additional HLA-region SNPs that strongly associate with risk of PD.2–6 The original PD-associated SNP,1 rs3129882, is in intron 1 of HLA-DRA (MIM 142860). The other PD-associated SNPs are also noncoding and map intergenicaly near HLA-DRA, HLA-DRB1 (MIM 142857), and HLA-DRB5 (MIM 604776) (Figure 1). It is possible that these SNPs tag HLA alleles at adjacent loci. An association with classical HLA polymorphisms is quite plausible for PD because of the evidence for neuroinflammation in PD pathogenesis.7 However, the few studies that have been attempted with HLA alleles have had small sample sizes and have produced discordant results.5,8 It is therefore unknown whether the SNPs that have been associated with PD tag specific HLA alleles, tag other genes, or represent regulatory elements (eQTLs).
Figure 1.
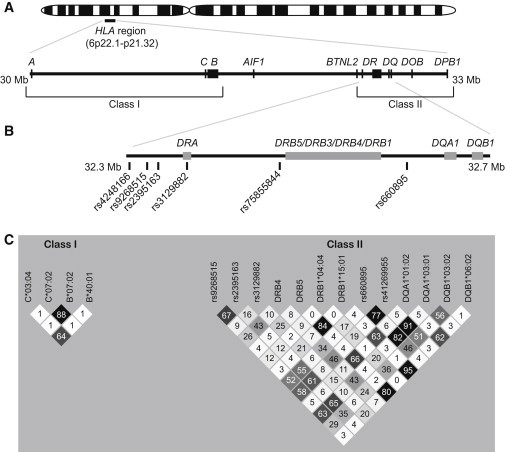
HLA and PD-Associated Variants
(A) Map of HLA class I and class II genes.
(B) PD-associated SNPs from our studies and the literature.
(C) Linkage disequilibrium, measured by correlation coefficient (r2 values shown in boxes), among five PD-associated SNPs and 12 PD-associated HLA alleles identified in the present study. rs41269955 is the proxy used for rs75855844 in NGRC.
Our aim was to determine whether PD is associated with HLA alleles and whether the associations with SNPs were driven by those HLA alleles. To that end, we used two GWAS data sets: NGRC,1 which was the original GWAS that uncovered the association of PD with HLA (2,000 PD cases and 1,986 controls), and PROGENI-GenePD9 (843 cases and 856 controls) for replication (NGRC and PROGENI-GenePD data are available on dbGaP [search terms CIDR and parkinson for the latter]; see Web Resources). Both data sets were composed of unrelated cases and controls of European descent and have been described in detail elsewhere.1,9 In both data sets, neurologists diagnosed PD by using standard research criteria10 and found the disease to be of late onset (average onset age was 58 ± 11 years in NGRC, 62 ± 11 years in the replication data set), representing common idiopathic disease. Both data sets are on the dbGaP website and have undergone careful quality control, including in-depth investigation of population structure.1,9 A concern that the association of HLA with PD was driven by the association of HLA with principal components was ruled out.1 The study was approved by the institutional review boards of the participating institutions, and proper informed consent was obtained.
Our first task was to generate the classical HLA alleles in the NGRC and replication data sets. Next-generation sequencing (NGS)11 is the gold standard but is prohibitively costly for large-scale studies. We therefore used imputation for the entire cohorts and sequenced class II exons for 194 cases and 204 controls from NGRC. We were therefore able to assess the accuracy of imputation against NGS while taking advantage of the larger imputed data sets for disease studies. Two algorithms have recently been developed for imputing HLA alleles from SNP data: SNP2HLA12 and HLA∗IMP.13 Because there has not yet been a head-to-head comparison of the performance of the two methods, we applied both methods to the same GWAS data set (NGRC). Both algorithms use extended HLA-region SNP data from GWAS to impute the HLA alleles at 4-digit resolution for class I (A [MIM 142800], B [MIM 142830], and C [MIM 142840]) and class II (DRB1, DQA1 [MIM 146880], DQB1 [MIM 604305], and DPB1 [MIM 142858]) loci. DRB3 (MIM 612735), DRB4, and DRB5, which are present on a subset of chromosomes, were imputed with HLA∗IMP and at 2 digits. The effective N of imputed data was 2,000 cases and 1,986 controls for NGRC and 843 cases and 856 controls for the replication data set. For NGS, we used DNA from whole blood and sequenced exon 2 of class II loci DRB1, DRB3, DRB4, DRB5, DQA1, and DPB1 and exons 2 and 3 of DQB1 alleles by using an amplicon-sequencing strategy with “fusion” primers on the Roche 454 GS FLX instrument with Conexio Genomics software as described elsewhere.11 Calls were made at 4-digit resolution or higher. For nine individuals, NGS and imputation were highly discordant, suggesting sample mix-up in plating. After removal of these individuals, the effective N for NGS was 194 cases and 204 controls.
We assessed the accuracy of imputation for class II genes by comparing data generated by each imputation algorithm to data generated by NGS. For each individual, the best-guess imputed alleles were compared to NGS-called alleles and designated as matches or mismatches. The accuracy of imputation was measured by sensitivity (SS: probability of calling an allele as being present correctly) and specificity (SP: probability of calling an allele as being absent correctly). Table S1 (in the Supplemental Data available with this article online) shows sensitivity and specificity of SNP2HLA and HLA∗IMP, side-by-side, as compared to NGS. We found accuracy of imputation to be generally high, in line with the values reported by the authors of the algorithms.12,13 DQA1, DQB1, and DPB1 imputed better than DRB1, as was also the case in the original papers.12,13 Both algorithms had trouble calling some alleles (e.g., DRB1∗01:03) or distinguishing certain DRB1 variants (e.g., DRB1∗14 and ∗08 alleles) that might have been generated by gene conversion. For some alleles (e.g., DPB1∗10:01 or DRB1∗14:01), one algorithm did well while the other did poorly. We did not sequence class I genes because we had no reason to suspect an association with class I genes; however, because we did find an association with an HLA-C allele, we should note that the original imputation papers have reported >97% accuracy for imputed HLA-C.12,13 We used the imputed data for disease study because of the larger sample size with the caveat that some alleles did not impute well and will require additional scrutiny. We show later that for the present study imputed data were quite reliable.
Next, we tested association of the HLA alleles with PD risk in NGRC. In the original GWAS that revealed the association of HLA with PD, the association was strong in nonfamilial (simplex) PD and absent in familial PD.1 Therefore, for association testing, we excluded 435 cases who reported a positive family history. We analyzed the imputed genotypes for 1,565 simplex PD cases and 1,986 controls, once by using the imputed dosage probabilities generated by SNP2HLA and again by using best-guess calls from HLA∗IMP. We excluded alleles with frequency <1%. We used logistic regression in the R software to calculate odds ratios (ORs), standard errors (SEs), and p values. All tests were adjusted for two principal components (PC1 and PC2).1 Additional covariates (e.g., the presence or absence of certain HLA alleles, haplotypes, or SNP genotypes) were added for conditional analyses. p values are reported for two-sided tests, without multiple-testing correction. To be sure we did not miss any HLA variant that might explain the SNP associations, we set the significance threshold low, at uncorrected p < 0.05, to minimize false negatives. Alleles with p < 0.05 for association with PD in NGRC were carried to replication. Analyses in replication were similar except that significance was set at a Bonferroni-corrected p = 3 × 10⁻³ (for 14 alleles carried to replication). Replication testing was also adjusted for PC1 and PC2 (and repeated with PC1 and PC4 as covariates because PC4 was nominally significant; results were unchanged). Lastly, we combined NGRC and replication in a Meta-analysis conducted in the PLINK software.14
In NGRC, 14 HLA alleles gave p < 0.05 for association with PD. The same 14 alleles were identified whether we used the data generated by SNP2HLA or that generated by HLA∗IMP. From here on, unless noted, we used the HLA∗IMP data. Of the 14 alleles with p < 0.05 in NGRC, 12 replicated in the second data set (Table 1); these included two alleles each at C, B, DRB1, DQA1, and DQB1 loci, as well as DRB4∗01 and DRB5∗01. Six of the alleles were associated with increased risk and six with reduced risk of PD. To determine whether the alleles were in LD, we constructed the HLA haplotypes by using the method implemented in the BEAGLE software for inferring haplotypes for unrelated individuals15 and calculated r2 and D′, either by using Haploview v. 4.2,16 or by hand. The six “risk” alleles were in high LD, forming a common haplotype: B∗07:02_C∗07:02_DRB5∗01_DRB1∗15:01_DQA1∗01:02_DQB1∗06:02 (Table S2, ORNGRC = 1.29, pNGRC = 3 × 10⁻³; ORreplication = 1.38, and preplication = 0.02; ORmeta = 1.32 and pmeta = 2 × 10⁻⁴). The six “protective” alleles also formed a haplotype, B∗40:01_C∗03:04_DRB4∗01_DRB1∗04:04_DQA1∗03:01_DQB1∗03:02 (Table S2, ORNGRC = 0.60, pNGRC = 0.02; ORreplication = 0.52, and preplication = 0.06; ORmeta = 0.58 and pmeta = 3 × 10⁻³). However, the six protective alleles were not in high LD (Figure 1). In conditional analysis, where each allele was tested for association with PD while adjustment was made for the other five alleles, three seemingly independent association signals were detected with C∗03:04, DRB1∗04:04 and DQA1∗03:01 (Table S3). To summarize thus far, we have identified and replicated four associations between PD and classical HLA variants: a risk haplotype, a protective class I allele, and two protective class II alleles. (We will show that two of these classical associations are driven by SNPs.)
Table 1.
Association of PD with HLA Alleles
| HLA Alleles |
Allele Frequency in NGRC |
NGRC |
Replication |
Meta-Analysis |
||||
|---|---|---|---|---|---|---|---|---|
| PD | Control | OR | p | OR | p | OR | p | |
| B∗07:02 | 0.15 | 0.13 | 1.20 | 8 × 10⁻³ | 1.31 | 0.01 | 1.23 | 3 × 10⁻⁴ |
| B∗40:01 | 0.05 | 0.06 | 0.79 | 0.02 | 0.71 | 0.03 | 0.76 | 2 × 10⁻³ |
| C∗03:04 | 0.07 | 0.09 | 0.76 | 2 × 10⁻³ | 0.63 | 6 × 10⁻⁴ | 0.72 | 8 × 10⁻⁶ |
| C∗07:02 | 0.16 | 0.14 | 1.22 | 3 × 10⁻³ | 1.25 | 0.03 | 1.23 | 2 × 10⁻⁴ |
| DRB1∗04:04 | 0.03 | 0.05 | 0.64 | 5 × 10⁻⁴ | 0.67 | 0.03 | 0.65 | 4 × 10⁻⁵ |
| DRB1∗15:01 | 0.16 | 0.13 | 1.26 | 9 × 10⁻⁴ | 1.26 | 0.02 | 1.26 | 6 × 10⁻⁵ |
| DRB4∗01 | 0.26 | 0.29 | 0.85 | 3 × 10⁻³ | 0.80 | 4 × 10⁻³ | 0.83 | 4 × 10⁻⁵ |
| DRB5∗01 | 0.16 | 0.14 | 1.25 | 8 × 10⁻⁴ | 1.25 | 0.03 | 1.25 | 5 × 10⁻⁵ |
| DQA1∗01:02 | 0.22 | 0.20 | 1.15 | 0.02 | 1.22 | 0.02 | 1.17 | 1 × 10⁻³ |
| DQA1∗03:01 | 0.15 | 0.19 | 0.77 | 1 × 10⁻⁴ | 0.76 | 3 × 10⁻³ | 0.77 | 1 × 10⁻⁶ |
| DQB1∗03:02 | 0.09 | 0.11 | 0.75 | 3 × 10⁻⁴ | 0.73 | 7 × 10⁻³ | 0.74 | 7 × 10⁻⁶ |
| DQB1∗06:02 | 0.16 | 0.13 | 1.26 | 7 × 10⁻⁴ | 1.27 | 0.02 | 1.26 | 4 × 10⁻⁵ |
Class I and class II HLA alleles with frequency ≥ 0.01 were tested in NGRC. Fourteen alleles with p < 0.05 for association with PD were tested for replication. Twelve that replicated are shown. Tests were conducted under the additive model and adjusted for principal components 1 and 2. p values (including those for the replication data set) are two sided and uncorrected for multiple testing. The Bonferroni-corrected threshold for 14 tests is p = 3 × 10⁻³.
The following SNPs in the HLA region have been reported as being associated with the risk of PD: rs3129882,1 rs75855844,2 rs9268515,3 rs2395163,4 rs660895,5 and rs42481666 (Table 2). rs3129882, rs660895, rs2395163, and rs4248166 were genotyped on the GWAS arrays both for NGRC and the replication data set. rs9268515 was also genotyped in NGRC, and we imputed it into the replication data set (info_score = 0.96) by using the IMPUTE2.2.2 software17 and the 1000 Genomes phase I integrated variant set (release v3, April 2012) as the reference panel. We were unable to generate rs75855844 genotypes (this SNP was not on the GWAS arrays or in 1000 Genomes phase I, and it was removed from ImmunoChip calls by technical filtering); we therefore used the best imputed proxies, rs41269955 (info_score = 0.99) in NGRC and rs77539933 (info_score = 0.86) in the replication data set (r2 = 1 with each other, r2 = 0.75 with rs75855844 in 1000 Genomes Pilot 1). rs4248166 was not associated with PD in NGRC or in the replication data set, and thus we did not pursue it further. The LD structure constructed in the NGRC data for the five PD-associated SNPs (Figure 1) suggests that rs3129882 is not strongly correlated with the other four SNPs (0.06 ≤ r2 ≤ 0.16). Whereas rs9268515, rs41269955, and rs77539933 (the latter two of which were used as proxies for rs75855844), rs660895, and rs2395163 are in moderate LD with each other (0.52 ≤ r2 ≤ 0.77) and therefore might be tagging the same PD-associated factor. In fact, adjusting for either rs9268515 or rs2395163 abolished the association signals for rs41269955, rs77539933, and rs660895 (Table S4). Thus, the PD-associated SNPs in HLA might represent two disease-associated elements, which in our study are best tagged by rs3129882 and by rs9268515 and/or rs2395163.
Table 2.
Association of PD with SNPs in the HLA Region
|
Previously Published PD-Associated SNPs |
Allele Freqeuncy in NGRC |
Present Study |
|||||||||||
|---|---|---|---|---|---|---|---|---|---|---|---|---|---|
| SNP (Reference) | BP | Location | Gene |
Original Report |
NGRC |
Replication |
Meta-analysis |
||||||
| OR | p | PD | Control | OR | p | OR | p | OR | p | ||||
| rs31298821 | 32,409,530 | intron 1 | DRA | 1.31 | 3 × 10⁻⁸ | 0.47 | 0.40 | original report | 1.21 | 5 × 10⁻³ | 1.30 | 9 × 10⁻¹¹ | |
| rs92685153 | 32,379,295 | intergenic | BTNL2-DRA | 0.80 | 4 × 10⁻⁴ | 0.15 | 0.20 | original report | 0.75 | 5 × 10⁻³ | 0.75 | 8 × 10⁻⁸ | |
| rs758558442 | 32,480,227 | intergenic | DRA-DRB5 | 0.70 | 1 × 10⁻⁸ | 0.16 | 0.20 | 0.80 | 4 × 10⁻⁴ | 0.82 | 0.02 | 0.78 | 8 × 10⁻⁹ |
| rs6608955 | 32,577,380 | intergenic | DRB1-DQA1 | 0.86 | 1 × 10⁻³ | 0.18 | 0.21 | 0.83 | 2 × 10⁻³ | 0.81 | 0.02 | 0.80 | 8 × 10⁻⁷ |
| rs23951634 | 32,387,809 | intergenic | BTNL2-DRA | 0.81 | 3 × 10⁻¹¹ | 0.19 | 0.23 | 0.77 | 2 × 10⁻⁵ | 0.78 | 3 × 10⁻³ | 0.81 | 3 × 10⁻¹¹ |
| rs42481666 | 32,366,421 | intergenic | BTNL2-DRA | 1.32 | 4 × 10⁻⁵ | 0.16 | 0.17 | 0.98 | 0.72 | 0.94 | 0.50 | 1.08 | 0.07 |
The HLA-region SNPs that have been previously reported as being associated with PD are shown with the originally reported findings and the results in the two data sets used here. Tests were conducted under the additive model and adjusted for principal components 1 and 2. rs75855844 (chr6:32,588,205) could not be generated. Two different SNPs were used as proxies in NGRC and replication data sets. rs2395163 was from a published meta-analysis that included NGRC and replication data sets. The meta-analysis result shown here is that of the original report.
To test the hypothesis that SNP associations are driven by HLA alleles, we performed conditional and stratified analysis and expected the association signal for the SNPs to be lost when conditioned on the HLA variants. To the contrary, the association of rs3129882 with PD and that of tightly linked rs9268515 and rs2395163, remained significant irrespective of the HLA variants (Table 3 and Table S5). When adjusted for HLA, significance dropped slightly, possibly as a result of a loss of power after adjustment and low levels of LD. For example, rs3129882 dropped from having p = 9 × 10⁻¹¹ to pconditioned ≤ 2 × 10⁻⁹ when adjustment was made for DRB1∗04:04 or C∗03:04 and to pconditioned = 3 × 10⁻⁸ when conditioned on the “risk” haplotype. Similarly, rs2395163 dropped from having p = 2 × 10⁻⁷ to pconditioned = 3 × 10⁻⁶ when adjustment was made for the “risk” haplotype and to pconditioned ≤ 5 × 10⁻⁵ when adjustment was made for DRB1∗04:04 or C∗03:04. Stratified analysis demonstrated a significant association of SNPs with PD even in the absence of the associated haplotypes (Table S6). These results indicate that SNP associations were not driven by HLA alleles.
Table 3.
Association of SNPs with PD after Conditioning on HLA Alleles
|
NGRC |
Replication |
Meta-analysis |
||||||||||||||||
|---|---|---|---|---|---|---|---|---|---|---|---|---|---|---|---|---|---|---|
|
rs3129882 |
rs9268515 |
rs2395163 |
rs3129882 |
rs9268515 |
rs2395163 |
rs3129882 |
rs9268515 |
rs2395163 |
||||||||||
| OR | p | OR | p | OR | p | OR | p | OR | p | OR | p | OR | p | OR | p | OR | p | |
| Not conditioned | 1.35 | 1 × 10⁻⁹ | 0.74 | 5 × 10⁻⁶ | 0.77 | 2 × 10⁻⁵ | 1.20 | 0.01 | 0.75 | 5 × 10⁻³ | 0.78 | 3 × 10⁻³ | 1.30 | 9 × 10⁻¹¹ | 0.75 | 8 × 10⁻⁸ | 0.77 | 2 × 10⁻⁷ |
| SNP Association with PD after Conditioning on HLA Alleles | ||||||||||||||||||
| B∗07:02 | 1.33 | 2 × 10⁻⁸ | 0.75 | 1 × 10⁻⁵ | 0.78 | 5 × 10⁻⁵ | 1.16 | 0.04 | 0.77 | 8 × 10⁻³ | 0.79 | 6 × 10⁻³ | 1.27 | 6 × 10⁻⁹ | 0.76 | 3 × 10⁻⁷ | 0.78 | 9 × 10⁻⁷ |
| C∗03:04 | 1.33 | 6 × 10⁻⁹ | 0.76 | 5 × 10⁻⁵ | 0.79 | 1 × 10⁻⁴ | 1.17 | 0.02 | 0.80 | 0.03 | 0.81 | 0.01 | 1.28 | 1 × 10⁻⁹ | 0.78 | 5 × 10⁻⁶ | 0.80 | 5 × 10⁻⁶ |
| C∗07:02 | 1.32 | 3 × 10⁻⁸ | 0.75 | 2 × 10⁻⁵ | 0.78 | 6 × 10⁻⁵ | 1.17 | 0.03 | 0.76 | 7 × 10⁻³ | 0.79 | 5 × 10⁻³ | 1.27 | 7 × 10⁻⁹ | 0.76 | 4 × 10⁻⁷ | 0.78 | 1 × 10⁻⁶ |
| DRB1∗04:04 | 1.32 | 1 × 10⁻⁸ | 0.78 | 4 × 10⁻⁴ | 0.81 | 1 × 10⁻³ | 1.18 | 0.02 | 0.81 | 0.05 | 0.81 | 0.02 | 1.27 | 2 × 10⁻⁹ | 0.79 | 6 × 10⁻⁵ | 0.81 | 5 × 10⁻⁵ |
| DRB1∗15:01 | 1.33 | 2 × 10⁻⁷ | 0.77 | 8 × 10⁻⁵ | 0.80 | 3 × 10⁻⁴ | 1.15 | 0.08 | 0.78 | 0.01 | 0.80 | 0.01 | 1.27 | 2 × 10⁻⁷ | 0.77 | 3 × 10⁻⁶ | 0.80 | 8 × 10⁻⁶ |
| DRB5∗01 | 1.33 | 3 × 10⁻⁷ | 0.77 | 9 × 10⁻⁵ | 0.80 | 3 × 10⁻⁴ | 1.15 | 0.08 | 0.78 | 0.01 | 0.80 | 0.01 | 1.27 | 2 × 10⁻⁷ | 0.77 | 3 × 10⁻⁶ | 0.80 | 8 × 10⁻⁶ |
| DQA1∗01:02 | 1.35 | 1 × 10⁻⁸ | 0.76 | 4 × 10⁻⁵ | 0.78 | 1 × 10⁻⁴ | 1.15 | 0.06 | 0.78 | 0.01 | 0.80 | 0.01 | 1.28 | 1 × 10⁻⁸ | 0.76 | 2 × 10⁻⁶ | 0.79 | 5 × 10⁻⁶ |
| DQA1∗03:01 | 1.30 | 3 × 10⁻⁷ | 0.78 | 0.02 | 0.82 | 0.04 | 1.13 | 0.09 | 0.85 | 0.3 | 0.88 | 0.3 | 1.24 | 2 × 10⁻⁷ | 0.80 | 0.01 | 0.84 | 0.03 |
| DQB1∗06:02 | 1.33 | 3 × 10⁻⁷ | 0.77 | 8 × 10⁻⁵ | 0.80 | 3 × 10⁻⁴ | 1.15 | 0.08 | 0.78 | 0.01 | 0.80 | 0.01 | 1.26 | 2 × 10⁻⁷ | 0.77 | 3 × 10⁻⁶ | 0.80 | 8 × 10⁻⁶ |
| SNP Association with PD after Conditioning on Haplotypes | ||||||||||||||||||
| B∗07:02_C∗07:02 | 1.33 | 2 × 10⁻⁸ | 0.75 | 1 × 10⁻⁵ | 0.78 | 5 × 10⁻⁵ | 1.16 | 0.03 | 0.77 | 8 × 10⁻³ | 0.79 | 6 × 10⁻³ | 1.27 | 6 × 10⁻⁹ | 0.76 | 3 × 10⁻⁷ | 0.78 | 9 × 10⁻⁷ |
| DRB5∗01_DRB1∗15:01_DQA1∗01:02_DQB1∗06:02 | 1.33 | 3 × 10⁻⁷ | 0.77 | 8 × 10⁻⁵ | 0.80 | 3 × 10⁻⁴ | 1.15 | 0.08 | 0.78 | 0.01 | 0.80 | 0.01 | 1.27 | 2 × 10⁻⁷ | 0.77 | 3 × 10⁻⁶ | 0.80 | 8 × 10⁻⁶ |
| B∗07:02_C∗07:02_DRB5∗01_DRB1∗15:01_DQA1∗01:02_DQB1∗06:02 | 1.33 | 5 × 10⁻⁸ | 0.76 | 4 × 10⁻⁵ | 0.79 | 1 × 10⁻⁴ | 1.15 | 0.06 | 0.77 | 9 × 10⁻³ | 0.79 | 7 × 10⁻³ | 1.27 | 3 × 10⁻⁸ | 0.76 | 1 × 10⁻⁶ | 0.79 | 3 × 10⁻⁶ |
This table displays the PD-associated SNPs that remained significant after being conditioned on other SNPs (Table S4); similarly, it includes only the PD-associated HLA-alleles that remained significant after being conditioned on other HLA-alleles (Table S3). For a comprehensive analysis with all PD-associated SNPs and all HLA-alleles see Table S5. P values are two sided for all analyses (including replication) and not corrected for multiple testing. Tests were adjusted for principal components 1 and 2.
In reciprocal experiments, i.e., testing association of HLA with PD conditioned on SNPs (Table 4 and Table S7), the signal for the “risk” haplotype B∗07:02_C∗07:02_DRB5∗01_DRB1∗15:01_DQA1∗01:02_DQB1∗06:02 was lost to rs3129882 (ORconditioned = 1.13, pconditioned = 0.1). We did not find evidence of association for this haplotype in stratified analysis either (Table S6). Because of strong LD (D′ = 0.83–1.0), the haplotype did not occur in the absence of the rs3129882_G risk allele, and it was not associated with PD in rs3129882_GA or rs3129882_GG individuals. LD with rs3129882 was responsible for the association of this haplotype with PD.
Table 4.
Association of HLA Alleles with PD after Conditioning on SNPs
|
NGRC |
Replication |
Meta-analysis |
||||||||||||||||||||||
|---|---|---|---|---|---|---|---|---|---|---|---|---|---|---|---|---|---|---|---|---|---|---|---|---|
|
Not conditioned |
rs3129882 |
rs9268515 |
rs2395163 |
Not conditioned |
rs3129882 |
rs9268515 |
rs2395163 |
Not conditioned |
rs3129882 |
rs9268515 |
rs2395163 |
|||||||||||||
| OR | p | OR | P | OR | p | OR | p | OR | p | OR | p | OR | p | OR | p | OR | p | OR | p | OR | p | OR | p | |
| Association of HLA Alleles with PD after Conditioning on SNPs | ||||||||||||||||||||||||
| B∗07:02 | 1.20 | 8 × 10⁻³ | 1.09 | 0.2 | 1.18 | 0.02 | 1.17 | 0.03 | 1.31 | 0.01 | 1.25 | 0.04 | 1.33 | 9 × 10⁻³ | 1.29 | 0.02 | 1.23 | 3 × 10⁻⁴ | 1.13 | 0.04 | 1.22 | 8 × 10⁻⁴ | 1.20 | 1 × 10⁻³ |
| C∗03:04 | 0.76 | 2 × 10⁻³ | 0.81 | 0.02 | 0.81 | 0.02 | 0.80 | 0.02 | 0.63 | 6 × 10⁻⁴ | 0.65 | 2 × 10⁻³ | 0.67 | 4 × 10⁻³ | 0.66 | 2 × 10⁻³ | 0.72 | 8 × 10⁻⁶ | 0.75 | 2 × 10⁻⁴ | 0.77 | 5 × 10⁻⁴ | 0.76 | 3 × 10⁻⁴ |
| C∗07:02 | 1.22 | 3 × 10⁻³ | 1.11 | 0.1 | 1.20 | 7 × 10⁻³ | 1.19 | 0.01 | 1.25 | 0.03 | 1.19 | 0.1 | 1.27 | 0.02 | 1.23 | 0.05 | 1.23 | 2 × 10⁻⁴ | 1.13 | 0.03 | 1.22 | 5 × 10⁻⁴ | 1.20 | 1 × 10⁻³ |
| DRB1∗04:04 | 0.64 | 5 × 10⁻⁴ | 0.71 | 8 × 10⁻³ | 0.75 | 0.03 | 0.75 | 0.03 | 0.67 | 0.03 | 0.70 | 0.05 | 0.70 | 0.09 | 0.77 | 0.2 | 0.65 | 4 × 10⁻⁵ | 0.71 | 1 × 10⁻³ | 0.73 | 7 × 10⁻³ | 0.75 | 0.01 |
| DRB1∗15:01 | 1.26 | 9 × 10⁻⁴ | 1.04 | 0.6 | 1.18 | 0.02 | 1.18 | 0.02 | 1.26 | 0.02 | 1.15 | 0.2 | 1.20 | 0.09 | 1.21 | 0.07 | 1.26 | 6 × 10⁻⁵ | 1.07 | 0.3 | 1.19 | 4 × 10⁻³ | 1.19 | 3 × 10⁻³ |
| DRB5∗01 | 1.25 | 8 × 10⁻⁴ | 1.04 | 0.6 | 1.18 | 0.02 | 1.18 | 0.02 | 1.25 | 0.03 | 1.13 | 0.3 | 1.18 | 0.1 | 1.19 | 0.08 | 1.25 | 5 × 10⁻⁵ | 1.07 | 0.3 | 1.18 | 4 × 10⁻³ | 1.18 | 3 × 10⁻³ |
| DQA1∗01:02 | 1.15 | 0.02 | 0.99 | 0.9 | 1.07 | 0.3 | 1.07 | 0.3 | 1.22 | 0.02 | 1.14 | 0.2 | 1.16 | 0.1 | 1.16 | 0.1 | 1.17 | 1 × 10⁻³ | 1.04 | 0.5 | 1.10 | 0.06 | 1.10 | 0.06 |
| DQA1∗03:01 | 0.77 | 1 × 10⁻⁴ | 0.87 | 0.04 | 0.94 | 0.5 | 0.92 | 0.5 | 0.76 | 3 × 10⁻³ | 0.80 | 0.02 | 0.85 | 0.3 | 0.85 | 0.3 | 0.77 | 1 × 10⁻⁶ | 0.84 | 3 × 10⁻³ | 0.91 | 0.3 | 0.90 | 0.2 |
| DQB1∗06:02 | 1.26 | 7 × 10⁻⁴ | 1.05 | 0.5 | 1.19 | 0.01 | 1.19 | 0.01 | 1.27 | 0.02 | 1.15 | 0.2 | 1.20 | 0.08 | 1.21 | 0.07 | 1.26 | 4 × 10⁻⁵ | 1.08 | 0.2 | 1.19 | 3 × 10⁻³ | 1.19 | 2 × 10⁻³ |
| Haplotype Association with PD after Conditioning on SNPs | ||||||||||||||||||||||||
| B∗07:02_C∗07:02 | 1.21 | 6 × 10⁻³ | 1.09 | 0.2 | 1.18 | 0.02 | 1.18 | 0.02 | 1.29 | 0.02 | 1.23 | 0.06 | 1.32 | 0.01 | 1.27 | 0.03 | 1.23 | 3 × 10⁻⁴ | 1.13 | 0.04 | 1.22 | 8 × 10⁻⁴ | 1.20 | 2 × 10⁻³ |
| DRB5∗01_DRB1∗15:01_DQA1∗01:02_DQB1∗06:02 | 1.26 | 7 × 10⁻⁴ | 1.04 | 0.6 | 1.19 | 0.02 | 1.19 | 0.02 | 1.27 | 0.02 | 1.15 | 0.2 | 1.20 | 0.09 | 1.21 | 0.07 | 1.27 | 5 × 10⁻⁵ | 1.08 | 0.3 | 1.19 | 3 × 10⁻³ | 1.20 | 2 × 10⁻³ |
| B∗07:02_C∗07:02_DRB5∗01_DRB1∗15:01_DQA1∗01:02_DQB1∗06:02 | 1.29 | 3 × 10⁻³ | 1.08 | 0.4 | 1.22 | 0.03 | 1.22 | 0.03 | 1.38 | 0.02 | 1.26 | 0.1 | 1.34 | 0.04 | 1.33 | 0.04 | 1.32 | 2 × 10⁻⁴ | 1.13 | 0.1 | 1.25 | 3 × 10⁻³ | 1.25 | 3 × 10⁻³ |
This table displays the PD-associated SNPs that remained significant after being conditioned on other SNPs (Table S4); similarly, it includes only the PD-associated HLA alleles that remained significant after being conditioned on other HLA alleles (Table S3). For a comprehensive analysis including all PD-associated SNPs and all HLA alleles, see Table S7. P values are two sided for all analyses (including those involving the replication data set) and are not corrected for multiple testing. Tests were adjusted for principal components 1 and 2.
As for the “protective” HLA alleles, adjusting for rs2395163 or rs9268515 abolished the DQA1∗03:01 signal (p = 1 × 10⁻⁶ to pconditioned = 0.2–0.3). However, DRB1∗04:04 and C∗03:04 retained their effect sizes and significance after being adjusted for every SNP (Table 4). C∗03:04 was reduced from OR = 0.72, p = 8 × 10⁻⁶ to 0.75 ≤ ORconditioned ≤ 0.80, 1 × 10⁻⁴ ≤ pconditioned ≤ 4 × 10⁻³. Similarly, DRB1∗04:04 went from OR = 0.65, p = 4 × 10⁻⁵ to 0.71 ≤ ORconditioned ≤ 0.75, 1 × 10⁻³ ≤ pconditioned ≤ 0.01. These results are not likely to be artifacts of imputation inaccuracy. The accuracy of imputation for the C locus is reportedly > 97%.12,13 Whereas sensitivity of imputed DRB1∗04:04 was only ∼90%, NGS, free of imputation uncertainty, supported the association of DRB1∗04:04 with PD (OR = 0.49, p = 0.12, power < 10%).
Step-wise conditional analysis18 sums up the findings clearly (Table 5). We tested all 17 variants (12 HLA alleles and 5 SNPs from Tables 1 and 2) that individually associated with PD and identified the associations in the order of significance in successive rounds of conditional analysis. rs3129882 had the strongest effect and was followed by C∗03:04, rs9268515, and DRB1∗04:04.
Table 5.
Step-wise Conditional Analysis of PD-Associated Variants
| Allele |
Round 1: Not Conditioned |
Round 2: Conditioned on rs3129882 |
Round 3: Conditioned on rs3129882 and C∗03:04 |
Round 4: Conditioned on rs3129882, C∗03:04, and rs9268515 |
||||
|---|---|---|---|---|---|---|---|---|
| OR | p | OR | p | OR | p | OR | p | |
| rs3129882_G | 1.30 | 9 × 10⁻¹¹ | - | - | 1.28 | 1 × 10−09 | 1.22 | 2 × 10⁻⁶ |
| rs9268515_C | 0.75 | 8 × 10⁻⁸ | 0.81 | 3 × 10⁻⁴ | 0.84 | 2 × 10⁻³ | - | - |
| rs2395163_C | 0.77 | 2 × 10⁻⁷ | 0.86 | 5 × 10⁻³ | 0.88 | 0.02 | 1.00 | 0.97 |
| DQA1∗03:01 | 0.77 | 1 × 10⁻⁶ | 0.84 | 3 × 10⁻³ | 0.87 | 0.01 | 0.97 | 0.77 |
| DQB1∗03:02 | 0.74 | 7 × 10⁻⁶ | 0.82 | 3 × 10⁻³ | 0.86 | 0.03 | 0.92 | 0.33 |
| C∗03:04 | 0.72 | 8 × 10⁻⁶ | 0.75 | 2 × 10⁻⁴ | - | - | 0.78 | 2 × 10⁻³ |
| rs41269955/rs77539933 | 0.81 | 2 × 10⁻⁵ | 0.88 | 0.02 | 0.90 | 0.05 | 0.97 | 0.67 |
| DRB1∗04:04 | 0.65 | 4 × 10⁻⁵ | 0.71 | 1 × 10⁻³ | 0.75 | 8 × 10⁻³ | 0.78 | 0.03 |
| DQB1∗06:02 | 1.26 | 4 × 10⁻⁵ | 1.08 | 0.24 | 1.07 | 0.26 | 1.06 | 0.37 |
| DRB4∗01 | 0.83 | 4 × 10⁻⁵ | 0.93 | 0.17 | 0.95 | 0.30 | 1.03 | 0.63 |
| DRB5∗01 | 1.25 | 5 × 10⁻⁵ | 1.07 | 0.30 | 1.06 | 0.35 | 1.05 | 0.49 |
| DRB1∗15:01 | 1.26 | 6 × 10⁻⁵ | 1.07 | 0.29 | 1.07 | 0.33 | 1.05 | 0.46 |
| rs660895_G | 0.82 | 9 × 10⁻⁵ | 0.88 | 0.02 | 0.91 | 0.07 | 1.02 | 0.74 |
| C∗07:02 | 1.23 | 2 × 10⁻⁴ | 1.13 | 0.03 | 1.11 | 0.08 | 1.13 | 0.04 |
| B∗07:02 | 1.23 | 3 × 10⁻⁴ | 1.13 | 0.04 | 1.11 | 0.08 | 1.12 | 0.05 |
| DQA1∗01:02 | 1.17 | 1 × 10⁻³ | 1.04 | 0.49 | 1.06 | 0.30 | 1.03 | 0.59 |
| B∗40:01 | 0.76 | 2 × 10⁻³ | 0.79 | 9 × 10⁻³ | 1.12 | 0.46 | 1.09 | 0.58 |
Five SNPs and 12 HLA variants that were individually associated with PD were included in the analysis (round 1). The marker with the strongest effect (in this case, lowest p value, rs3129882) was selected as a covariate for successive analyses, and association tests were repeated (round 2) with conditioning on rs3129882. The strongest effect in round 2 was associated with C∗03:04. Round 3 tested remaining markers conditioned on rs3129882 and C∗03:04. Round 4, with rs3129882, C∗03:04, and rs9268515 in the model, identified DRB1∗04:04. No marker survived being adjusted for rs3129882, C∗03:04, rs9268515, and DRB1∗04:04.
It is possible that the associated SNPs are tagging genes that we did not test here. Exploring LD with our strongest signal, rs3129882, we found no SNP that correlated with r2 > 0.65. All SNPs with r2 > 0.2 mapped between 32.2 Mb and 32.7 Mb on chromosome 6; this region includes class II genes and BTNL2 (MIM 606000) (Figure 1). The BTNL2 SNP with strongest association with PD (OR = 1.31, p = 2 × 10⁻⁷) lost its signal (ORconditioned = 1.05, pconditioned = 0.53) when conditioned on rs3129882. These data are not best suited to address the question of whether any of these SNPs are tagging genes not tested here; failing to find evidence for another gene does not negate the possibility that one is present.
Regulation of gene expression is an alternative explanation for association of disease with HLA.19–21 Interestingly, SNPs that have emerged from GWAS are more likely to be eQTLs than frequency-matched “control” SNPs.22 Increasing interest in eQTLs has led to the generation of data sets where SNPs are tested for correlation with gene expression genome-wide, and these data are now compiled in publically available databases. We used three commonly used online databases: Genevar, eQTL, and SCAN. Within each database, we used published sources. We selected only expression data sets that were generated on individuals of European descent. We used data from immune-related cells, including lymphoblastoid cell lines, T cells, and monocytes, which might be better proxies for an HLA-associated disease than skin or adipose. We specified each of the five SNPs in turn and queried cis association with expression of genes that lie within 1 Mb in each direction of the SNP. We set the significance threshold at p ≤ 1 × 10⁻⁴, which was corrected for multiple comparisons with Bonferroni correction for five SNPs tested with 130 genes, the average number for a 2 Mb region of HLA (UCSC Genome Browser) if we assume that every gene was probed during expression analysis. As noted above, PD-associated SNPs form two blocks, best tagged by 3129882 and by rs9268515 and/or rs2395163. We found that rs3129882 is an eQTL for DRA (p = 4 × 10⁻⁵; p = 1 × 10⁻⁵),23,24 DRB (p = 3 × 10⁻¹⁴),25 DQA2 (p = 2 × 10⁻⁷),26 and DQB1 (p = 3 × 10⁻¹⁴).25 rs9268515 was not included in any of the eQTL studies. rs2395163 (r2 = 0.67, D′ = 0.90 with rs9268515) was associated with expression of DQA1 (p = 5 × 10⁻¹⁴, p = 5 × 10⁻¹³, p = 2 × 10−79, p = 6 × 10⁻⁶),23,27,28 DRB1 (p = 5 × 10⁻¹⁶),27 DQA2 (p = 1 × 10⁻⁶, p = 9 × 10⁻¹⁵),24,26 and DQB1 (p = 2 × 10⁻³⁰).27 rs660895, which is in the same LD block as rs9268515 and rs2395163 (r2 = 0.55, D′ = 0.77), was also associated with expression levels of DQA1 (p = 2 × 10⁻¹⁷; p = 1 × 10⁻¹³; p = 6 × 10⁻¹¹)23,28 and DQA2 (p = 6 × 10⁻⁷; p = 1 × 10⁻²¹)24,26 (Table 6 and Table S8). These findings suggest that PD susceptibility might be influenced by HLA expression levels, a viable hypothesis that should be tested rigorously in the future.
Table 6.
eQTL Data: Association of PD-Associated SNPs with Expression of Genes in the HLA Region
| PD-SNP | Gene Expression | p | Specificity | Browser | Original Data Source |
|---|---|---|---|---|---|
| rs3129882 | DRA | 1 × 10⁻⁵, 7 × 10⁻⁴ | unique | Genevar | Nica, 201123 |
| DRA | 4 × 10⁻⁵ | unique | eQTL | Montgomery, 201024 | |
| DRB5 | 9 × 10⁻⁵ | unique | eQTL | Montgomery, 201024 | |
| DQB1 | 3 × 10⁻¹⁴ | unique | SCAN | Gamazon, 201025 | |
| DQA2 | 2 × 10⁻⁷ | 100% DQA2, 88% DQA1 | eQTL | Stranger, 200726 | |
| DRB5 | 9 × 10⁻⁹ | 100% DRB5, 92% DRB1, 88% DRB3 | Genevar | Stranger, 201229 | |
| DRB5 | 4 × 10⁻⁵, 9 × 10⁻⁵ | 100% DRB5, 92% DRB1, 88% DRB3 | Genevar | Dimas, 200930 | |
| DQB2 | 3 × 10⁻¹⁴ | unknown | SCAN | Gamazon, 201025 | |
| DRB1 | 3 × 10⁻¹⁴ | unknown | SCAN | Gamazon, 201025 | |
| DRB3,4,5 | 3 × 10⁻¹⁴ | unknown | SCAN | Gamazon, 201025 | |
| rs2395163 and/or rs9268515a | DQA1 | 5 × 10⁻¹⁴, 5 × 10⁻¹³ | unique | Genevar | Nica, 201123 |
| DQA2 | 1 × 10⁻⁶ | unique | eQTL | Montgomery, 201024 | |
| DRB1 | 5 × 10⁻¹⁶ | 100% DRB1, 94% DRB4, 92% DRB5, 82% DRB3 | eQTL | Zeller, 201027 | |
| DQA1 | 2 × 10−79 | 100% DQA1, 98% DQA2, 74% DOA | eQTL | Zeller, 201027 | |
| DQA1 | 6 × 10⁻⁶ | 100% DQA1, 94% DQA2 | eQTL | Veyrieras, 200828 | |
| DQA2 | 9 × 10⁻¹⁵ | 100% DQA2, 88% DQA1 | eQTL | Stranger, 200726 | |
| DQB1 | 2 × 10⁻³⁰ | 100% DQB1, 86% DQB2, 74% DRB5 | eQTL | Zeller, 201027 | |
| DRB5 | 1 × 10⁻¹⁴ | 100% DRB5, 92% DRB1, 88% DRB3 | eQTL | Zeller, 201027 | |
| DRB5 | 3 × 10⁻⁶ | 100% DRB5, 92% DRB1, 88% DRB3 | Genevar | Stranger, 201229 |
PD-associated SNPs in the HLA region form two blocks tagged by rs3129882 and by rs9268515 and/or rs2395163. The table shows the evidence, from three publically available databases (browser), of association of rs3129882 and rs2395163 with the expression of genes within 1 Mb of the SNP. For additional data, including evidence for association of rs660895 with HLA genes,23, 24, 26, 28, 29, 31 see Table S8. We used data that were collected from immune-related cells of individuals of European origin. SNP-gene associations that passed Bonferroni-corrected significance are shown. Rows that have two p values denote independent confirmation in co-twins or in two different tissues. We went back to the original data sources to determine the specificity of each probe to the identified gene and its allelic variants (see Table S8 for details). Specificity denotes whether the probe hybridized with only one gene or with multiple genes. “Unique” denotes when probe hybridized with only one gene with a 100% sequence match. Percentages denote the nucleotide match between the probe (usually 50 nucleotides) and the targeted sequences. Except in one case, the probes were against a functionally nonpolymorphic gene (e.g., DRA) or the 3′-UTR, and therefore allele specificity was not of relevance. In the one exception (see rs2395163, DQB1, Zeller, 201027) where the probe mapped to exon 4, it was a 100% match to all DQB1∗02 alleles, 98% to DQB1∗03, and DQB1∗04 alleles, 82%–92% to DQB1∗06 alleles, and 82%–88% to DQB1∗05 alleles.
rs9268515 was not included in any of the eQTL databases, but rs2395163, which is in LD with rs9268515 (D’ = 0.9, r2 = 0.67), was in several databases.
High homology among HLA genes raises the concern that probes might cross-react with more than one gene. For experiments conducted with microarrays, we identified the probes from the original experiment and assessed the gene specificity of each probe by blasting it against the NCBI whole-genome sequence and RNA reference sequence, and we then assessed allele specificity of the probe by using the IMGT/HLA Database. For the RNASeq experiment, we confirmed that all multimapped reads were filtered out (S. Montgomery, personal communication). Indeed, homology among DRB loci prevents assignment of some eQTLs unambiguously; otherwise, there were several probes that had perfect homology with one gene and no cross-reactivity with any others (Table 6). These unique specificities linked rs3129882 with the expression of DRA and DQB1 and linked rs2395163/rs9268515 with the expression of DQA1 and DQA2.
In summary, with the caveats that HLA studies can be very complex and that the winner’s curse prevents conclusions to be drawn with total confidence, our results suggest the existence of more than one HLA-region factor that affects PD risk, represented by the predisposing effect of rs3129882 and the protective effects of C∗03:04, DRB1∗04:04, and the closely linked SNPs rs9268515, rs2395163, and rs660895. The PD-associated SNPs are most likely eQTLs. Whether the protective factors that are represented by C∗03:04 and DRB1∗04:04 are classical variants affecting antigen binding affinity or regulatory elements affecting gene expression levels is unknown. We have not excluded the possibility that one or more of the SNPs tags another gene. We have not demonstrated a direct cause-and-effect link between gene expression and disease risk. However, the strong association of SNPs with both PD risk and gene expression, in the absence of evidence for involvement of classical HLA alleles, supports gene regulation as a viable mechanism for association of HLA with PD. There is emerging evidence for the importance of HLA gene regulation in disease pathogenesis,19–21 as exemplified by recent studies that have shown that expression levels of HLA-C influence outcomes of HIV infection.21 Our work demonstrates that noncoding SNPs in HLA can be associated with disease irrespective of classical HLA variants and that observed associations with classical HLA variants can sometimes be secondary to a noncoding variant. This realization is a sharp departure from how studies of HLA-related diseases have been conducted in the past, but it could be helpful for resolving the complex roles that HLA genes play in disease pathogenesis.
Acknowledgments
We thank the research participants. We thank Tatiana Foroud and Richard Myers for making their datasets available for replication. The project was supported by award number R01NS36960 from the National Institute of Neurological Disorders and Stroke (NINDS). Additional support was provided by a Global Genetic Consortium Grant from the Michael J. Fox Foundation for Parkinson’s Disease Research, a Merit Review Award from the Department of Veterans Affairs (1I01BX000531), the National Institutes of Aging (P30AG08017), the Office of Research & Development, the Clinical Sciences Research & Development Service, the Department of Veteran Affairs, Close to the Cure Foundation, and National Institutes of Health contract HHSN272201200028C. Funding for PROGENI and GenePD studies, which generated the data used for replication, was provided by NINDS, and the GWAS data were obtained from the NINDS database at dbGaP accession number phs000126.v1.p1. The content is solely the responsibility of the authors and does not necessarily represent the official views of the funding agencies.
Supplemental Data
Web Resources
The URLs for data presented herein are as follows:
BEAGLE, http://faculty.washington.edu/browning/beagle/beagle.html
eQTL database, http://eqtl.uchicago.edu/cgi-bin/gbrowse/eqtl/
Genevar (Gene Expression Variation), http://www.sanger.ac.uk/resources/software/genevar/
HLA∗IMP, https://oxfordhla.well.ox.ac.uk/hla/
IMGT/HLA Database, http://www.ebi.ac.uk/ipd/imgt/hla/
IMPUTE2, http://mathgen.stats.ox.ac.uk/impute/impute_v2.html
Online Mendelian Inheritance in Man (OMIM), http://www.omim.org/
The R Project for statistical computing, http://www.r-project.org/
UCSC Human Genome Browser, http://genome.ucsc.edu/cgi-bin/hgGateway
References
- 1.Hamza T.H., Zabetian C.P., Tenesa A., Laederach A., Montimurro J., Yearout D., Kay D.M., Doheny K.F., Paschall J., Pugh E. Common genetic variation in the HLA region is associated with late-onset sporadic Parkinson’s disease. Nat. Genet. 2010;42:781–785. doi: 10.1038/ng.642. [DOI] [PMC free article] [PubMed] [Google Scholar]
- 2.Nalls M.A., Plagnol V., Hernandez D.G., Sharma M., Sheerin U.M., Saad M., Simón-Sánchez J., Schulte C., Lesage S., Sveinbjörnsdóttir S., International Parkinson Disease Genomics Consortium Imputation of sequence variants for identification of genetic risks for Parkinson’s disease: a meta-analysis of genome-wide association studies. Lancet. 2011;377:641–649. doi: 10.1016/S0140-6736(10)62345-8. [DOI] [PMC free article] [PubMed] [Google Scholar]
- 3.Hill-Burns E.M., Factor S.A., Zabetian C.P., Thomson G., Payami H. Evidence for more than one Parkinson’s disease-associated variant within the HLA region. PLoS ONE. 2011;6:e27109. doi: 10.1371/journal.pone.0027109. [DOI] [PMC free article] [PubMed] [Google Scholar]
- 4.Pankratz N., Beecham G.W., DeStefano A.L., Dawson T.M., Doheny K.F., Factor S.A., Hamza T.H., Hung A.Y., Hyman B.T., Ivinson A.J., PD GWAS Consortium Meta-analysis of Parkinson’s disease: identification of a novel locus, RIT2. Ann. Neurol. 2012;71:370–384. doi: 10.1002/ana.22687. [DOI] [PMC free article] [PubMed] [Google Scholar]
- 5.Ahmed I., Tamouza R., Delord M., Krishnamoorthy R., Tzourio C., Mulot C., Nacfer M., Lambert J.C., Beaune P., Laurent-Puig P. Association between Parkinson’s disease and the HLA-DRB1 locus. Mov. Disord. 2012;27:1104–1110. doi: 10.1002/mds.25035. [DOI] [PubMed] [Google Scholar]
- 6.Simón-Sánchez J., van Hilten J.J., van de Warrenburg B., Post B., Berendse H.W., Arepalli S., Hernandez D.G., de Bie R.M., Velseboer D., Scheffer H. Genome-wide association study confirms extant PD risk loci among the Dutch. Eur. J. Hum. Genet. 2011;19:655–661. doi: 10.1038/ejhg.2010.254. [DOI] [PMC free article] [PubMed] [Google Scholar]
- 7.Mosley R.L., Hutter-Saunders J.A., Stone D.K., Gendelman H.E. Inflammation and adaptive immunity in Parkinson’s disease. Cold Spring Harb Perspect Med. 2012;2:a009381. doi: 10.1101/cshperspect.a009381. [DOI] [PMC free article] [PubMed] [Google Scholar]
- 8.Saiki M., Baker A., Williams-Gray C.H., Foltynie T., Goodman R.S., Taylor C.J., Compston D.A., Barker R.A., Sawcer S.J., Goris A. Association of the human leucocyte antigen region with susceptibility to Parkinson’s disease. J. Neurol. Neurosurg. Psychiatry. 2010;81:890–891. doi: 10.1136/jnnp.2008.162883. [DOI] [PubMed] [Google Scholar]
- 9.Pankratz N., Wilk J.B., Latourelle J.C., DeStefano A.L., Halter C., Pugh E.W., Doheny K.F., Gusella J.F., Nichols W.C., Foroud T., Myers R.H., PSG-PROGENI and GenePD Investigators, Coordinators and Molecular Genetic Laboratories Genomewide association study for susceptibility genes contributing to familial Parkinson disease. Hum. Genet. 2009;124:593–605. doi: 10.1007/s00439-008-0582-9. [DOI] [PMC free article] [PubMed] [Google Scholar]
- 10.Hughes A.J., Daniel S.E., Ben-Shlomo Y., Lees A.J. The accuracy of diagnosis of parkinsonian syndromes in a specialist movement disorder service. Brain. 2002;125:861–870. doi: 10.1093/brain/awf080. [DOI] [PubMed] [Google Scholar]
- 11.Holcomb C.L., Höglund B., Anderson M.W., Blake L.A., Böhme I., Egholm M., Ferriola D., Gabriel C., Gelber S.E., Goodridge D. A multi-site study using high-resolution HLA genotyping by next generation sequencing. Tissue Antigens. 2011;77:206–217. doi: 10.1111/j.1399-0039.2010.01606.x. [DOI] [PMC free article] [PubMed] [Google Scholar]
- 12.Jia X., Han B., Onengut-Gumuscu S., Chen W.M., Concannon P.J., Rich S.S., Raychaudhuri S., de Bakker P.I. Imputing amino acid polymorphisms in human leukocyte antigens. PLoS ONE. 2013;8:e64683. doi: 10.1371/journal.pone.0064683. [DOI] [PMC free article] [PubMed] [Google Scholar]
- 13.Dilthey A.T., Moutsianas L., Leslie S., McVean G. HLA∗IMP—an integrated framework for imputing classical HLA alleles from SNP genotypes. Bioinformatics. 2011;27:968–972. doi: 10.1093/bioinformatics/btr061. [DOI] [PMC free article] [PubMed] [Google Scholar]
- 14.Purcell S., Neale B., Todd-Brown K., Thomas L., Ferreira M.A., Bender D., Maller J., Sklar P., de Bakker P.I., Daly M.J., Sham P.C. PLINK: a tool set for whole-genome association and population-based linkage analyses. Am. J. Hum. Genet. 2007;81:559–575. doi: 10.1086/519795. [DOI] [PMC free article] [PubMed] [Google Scholar]
- 15.Browning S.R., Browning B.L. Rapid and accurate haplotype phasing and missing-data inference for whole-genome association studies by use of localized haplotype clustering. Am. J. Hum. Genet. 2007;81:1084–1097. doi: 10.1086/521987. [DOI] [PMC free article] [PubMed] [Google Scholar]
- 16.Barrett J.C., Fry B., Maller J., Daly M.J. Haploview: analysis and visualization of LD and haplotype maps. Bioinformatics. 2005;21:263–265. doi: 10.1093/bioinformatics/bth457. [DOI] [PubMed] [Google Scholar]
- 17.Howie B.N., Donnelly P., Marchini J. A flexible and accurate genotype imputation method for the next generation of genome-wide association studies. PLoS Genet. 2009;5:e1000529. doi: 10.1371/journal.pgen.1000529. [DOI] [PMC free article] [PubMed] [Google Scholar]
- 18.Payami H., Joe S., Farid N.R., Stenszky V., Chan S.H., Yeo P.P., Cheah J.S., Thomson G. Relative predispositional effects (RPEs) of marker alleles with disease: HLA-DR alleles and Graves disease. Am. J. Hum. Genet. 1989;45:541–546. [PMC free article] [PubMed] [Google Scholar]
- 19.Kulkarni S., Savan R., Qi Y., Gao X., Yuki Y., Bass S.E., Martin M.P., Hunt P., Deeks S.G., Telenti A. Differential microRNA regulation of HLA-C expression and its association with HIV control. Nature. 2011;472:495–498. doi: 10.1038/nature09914. [DOI] [PMC free article] [PubMed] [Google Scholar]
- 20.Knight J.C. Genomic modulators of the immune response. Trends Genet. 2013;29:74–83. doi: 10.1016/j.tig.2012.10.006. [DOI] [PMC free article] [PubMed] [Google Scholar]
- 21.Apps R., Qi Y., Carlson J.M., Chen H., Gao X., Thomas R., Yuki Y., Del Prete G.Q., Goulder P., Brumme Z.L. Influence of HLA-C expression level on HIV control. Science. 2013;340:87–91. doi: 10.1126/science.1232685. [DOI] [PMC free article] [PubMed] [Google Scholar]
- 22.Nicolae D.L., Gamazon E., Zhang W., Duan S., Dolan M.E., Cox N.J. Trait-associated SNPs are more likely to be eQTLs: annotation to enhance discovery from GWAS. PLoS Genet. 2010;6:e1000888. doi: 10.1371/journal.pgen.1000888. [DOI] [PMC free article] [PubMed] [Google Scholar]
- 23.Nica A.C., Parts L., Glass D., Nisbet J., Barrett A., Sekowska M., Travers M., Potter S., Grundberg E., Small K., MuTHER Consortium The architecture of gene regulatory variation across multiple human tissues: the MuTHER study. PLoS Genet. 2011;7:e1002003. doi: 10.1371/journal.pgen.1002003. [DOI] [PMC free article] [PubMed] [Google Scholar]
- 24.Montgomery S.B., Sammeth M., Gutierrez-Arcelus M., Lach R.P., Ingle C., Nisbett J., Guigo R., Dermitzakis E.T. Transcriptome genetics using second generation sequencing in a Caucasian population. Nature. 2010;464:773–777. doi: 10.1038/nature08903. [DOI] [PMC free article] [PubMed] [Google Scholar]
- 25.Gamazon E.R., Zhang W., Konkashbaev A., Duan S., Kistner E.O., Nicolae D.L., Dolan M.E., Cox N.J. SCAN: SNP and copy number annotation. Bioinformatics. 2010;26:259–262. doi: 10.1093/bioinformatics/btp644. [DOI] [PMC free article] [PubMed] [Google Scholar]
- 26.Stranger B.E., Nica A.C., Forrest M.S., Dimas A., Bird C.P., Beazley C., Ingle C.E., Dunning M., Flicek P., Koller D. Population genomics of human gene expression. Nat. Genet. 2007;39:1217–1224. doi: 10.1038/ng2142. [DOI] [PMC free article] [PubMed] [Google Scholar]
- 27.Zeller T., Wild P., Szymczak S., Rotival M., Schillert A., Castagne R., Maouche S., Germain M., Lackner K., Rossmann H. Genetics and beyond—the transcriptome of human monocytes and disease susceptibility. PLoS ONE. 2010;5:e10693. doi: 10.1371/journal.pone.0010693. [DOI] [PMC free article] [PubMed] [Google Scholar]
- 28.Veyrieras J.B., Kudaravalli S., Kim S.Y., Dermitzakis E.T., Gilad Y., Stephens M., Pritchard J.K. High-resolution mapping of expression-QTLs yields insight into human gene regulation. PLoS Genet. 2008;4:e1000214. doi: 10.1371/journal.pgen.1000214. [DOI] [PMC free article] [PubMed] [Google Scholar]
- 29.Stranger B.E., Montgomery S.B., Dimas A.S., Parts L., Stegle O., Ingle C.E., Sekowska M., Smith G.D., Evans D., Gutierrez-Arcelus M. Patterns of cis regulatory variation in diverse human populations. PLoS Genet. 2012;8:e1002639. doi: 10.1371/journal.pgen.1002639. [DOI] [PMC free article] [PubMed] [Google Scholar]
- 30.Dimas A.S., Deutsch S., Stranger B.E., Montgomery S.B., Borel C., Attar-Cohen H., Ingle C., Beazley C., Gutierrez Arcelus M., Sekowska M. Common regulatory variation impacts gene expression in a cell type-dependent manner. Science. 2009;325:1246–1250. doi: 10.1126/science.1174148. [DOI] [PMC free article] [PubMed] [Google Scholar]
- 31.Grundberg E., Small K.S., Hedman A.K., Nica A.C., Buil A., Keildson S., Bell J.T., Yang T.P., Meduri E., Barrett A., Multiple Tissue Human Expression Resource (MuTHER) Consortium Mapping cis- and trans-regulatory effects across multiple tissues in twins. Nat. Genet. 2012;44:1084–1089. doi: 10.1038/ng.2394. [DOI] [PMC free article] [PubMed] [Google Scholar]
Associated Data
This section collects any data citations, data availability statements, or supplementary materials included in this article.