

Abstract
Epigenetic modifications such as DNA methylation play a key role in gene regulation and disease susceptibility. However, little is known about the genome-wide frequency, localization, and function of methylation variation and how it is regulated by genetic and environmental factors. We utilized the Multiple Tissue Human Expression Resource (MuTHER) and generated Illumina 450K adipose methylome data from 648 twins. We found that individual CpGs had low variance and that variability was suppressed in promoters. We noted that DNA methylation variation was highly heritable (h2median = 0.34) and that shared environmental effects correlated with metabolic phenotype-associated CpGs. Analysis of methylation quantitative-trait loci (metQTL) revealed that 28% of CpGs were associated with nearby SNPs, and when overlapping them with adipose expression quantitative-trait loci (eQTL) from the same individuals, we found that 6% of the loci played a role in regulating both gene expression and DNA methylation. These associations were bidirectional, but there were pronounced negative associations for promoter CpGs. Integration of metQTL with adipose reference epigenomes and disease associations revealed significant enrichment of metQTL overlapping metabolic-trait or disease loci in enhancers (the strongest effects were for high-density lipoprotein cholesterol and body mass index [BMI]). We followed up with the BMI SNP rs713586, a cg01884057 metQTL that overlaps an enhancer upstream of ADCY3, and used bisulphite sequencing to refine this region. Our results showed widespread population invariability yet sequence dependence on adipose DNA methylation but that incorporating maps of regulatory elements aid in linking CpG variation to gene regulation and disease risk in a tissue-dependent manner.
Introduction
The molecular basis of complex traits and diseases has only partially been explained by common sequence variants.1 Of the hundreds of already identified common complex-trait-associated genetic loci, the majority of which map to noncoding DNA,2 only a few have been translated to biological mechanisms. An approach to understanding noncoding variation and its impact on quantitative traits and disease susceptibility is linking cellular phenotypes, such as gene expression3–5 or chromatin state6,7 in disease-targeted cells or tissues, with common sequence variants.
Epigenetic variation such as DNA methylation is now acknowledged to make a significant contribution to complex disease susceptibility.8,9 To this end, we have developed one of the largest population collections of multiple primary tissues (i.e., adipose, skin, and blood) in the Multiple Tissue Human Expression Resource (MuTHER) project, where the tissues were obtained through punch biopsies from an area adjacent and inferior to the umbilicus. Using this resource, we recently presented the most precise decomposition to date of gene expression variability: that genetic effects contribute on average ∼30% of the variation in gene expression. We also showed evidence of the importance of using disease-targeted tissue or cell panels for accurate interpretation of functionality of disease loci from genome-wide association studies (GWASs).10 We are now expanding our efforts on population-based cellular phenotyping to also include methylome data.
DNA methylation patterns differ with age;11 compared with newborns, centenarians have more hypomethylated CpGs,12 believed to be regulated by stochastic, environmental, and genetic variation.13 For instance, several studies are reporting direct effects of cigarette smoking on the epigenome,14,15 whereas others have shown a correlation between epigenetic modification and common diseases.8 A pioneering study using allele-specific DNA methylation and mRNA expression showed evidence of a genotype-dependent effect of DNA methylation, as well as a correlation with gene expression.16 It was also demonstrated that the sequence variants regulating DNA methylation are predominantly located in cis. These results have been confirmed and followed up in more detail in more recent studies exploring the effect of genetic factors in modulating DNA methylation,17–19 providing further evidence of both a strong genetic component in interindividual DNA methylation variation and a common mechanism regulating gene expression and DNA methylation. However, most of the studies presented to date have been limited to either whole-blood-derived DNA samples or targeted arrays of promoter regions (i.e., Illumina 27K), which include only a small fraction of methylation variation. Although several studies have demonstrated that changes in promoter methylation could significantly affect gene expression,20,21 the function of DNA methylation in intergenic and gene-body regions is less defined. Consequently, studies using more homogeneous cell or tissue samples for the analysis of genome-wide DNA methylation patterns in larger sample sizes are in high demand.
We estimated methylation levels of 485,764 sites covering not only gene promoters but also several other genomic features22 in subcutaneous adipose tissue derived from 648 female twins. Taking advantage of the twin structure, we performed large-scale heritability analysis of global DNA methylation variation by dissecting it into genetic and environmental (both common and unique) effects. In addition, we used previously collected genomic (SNP) and transcriptomic (IlluminaHT12) data to assess the impact of common variants on DNA methylation differences and to estimate the global correlation with expression of nearby genes. Finally, in an attempt to understand the functional role of epigenetic variants, we correlated our methylation quantitative-trait loci (metQTL) findings with publicly available reference epigenome data on human cells differentiated into adipocytes from the National Institutes of Health (NIH) RoadMap Epigenomics Project.23 The complete analysis outline is presented in Figure S1, available online.
Subjects and Methods
Sample Inclusion
A total of 662 adipose tissue samples collected in the MuTHER study were included herein. The MuTHER study includes 856 female European-descent individuals recruited from the TwinsUK Adult Twin Registry,24 as previously described.10 In brief, 8 mm punch biopsies were taken from a relatively photo-protected area adjacent and inferior to the umbilicus. Subcutaneous adipose tissue was carefully dissected from each biopsy, weighted and split into multiple pieces, and immediately stored in liquid nitrogen until analysis. All the procedures followed were in accordance with the ethical standards of the St. Thomas’ Research Ethics Committee (REC reference 07/H0802/84) at St. Thomas’ Hospital in London, and all study subjects provided written informed consent. As recently described, RNA was extracted from the MuTHER adipose tissues and used for expression profiling using Illumina Human HT-12 V3 BeadChips.
DNA Isolation and Bisulphite Conversion
In order to avoid sampling biases, we randomized the included adipose tissue samples prior to DNA extraction. Genomic DNA was then isolated with a NORGEN DNA Purification Kit (Norgen Biotek Corporation) according to the manufacturer’s protocol and quantified with PicoGreen. Prior to bisulphite conversion, the DNA samples were further randomized, and exactly 700 ng of each DNA sample was taken for bisulphite conversion with the EZ-96 DNA Methylation Kit (Zymo Research) according to the supplier’s protocol. Before proceeding with methylation profiling, we quantified concentrations of the bisulphite-treated DNA samples with NanoDrop ND-1000 (NanoDrop Technologies).
Genome-wide Methylation Profiling
Methylation profiling was performed on the bisulphite-converted samples with the Illumina Infinium HumanMethylation450 BeadChip; 5 μl of each eluted bisulphite-treated DNA sample was processed according to the protocol supplied by Illumina. The methylation array targeted 485,764 methylation sites across the genome with both the Infinium I (two bead types per CpG site; one each for the methylated and unmethylated states) and II (one bead type per CpG site; the methylated state is determined at the single-base extension step) assay designs. Given the complexity of the probe design, methylation scores (beta values) have different distributions for the different probe types (Figure S2). The BeadChips were scanned with the IlluminaHiScan SQ scanner, and raw data were imported to the GenomeStudio v.2010.3 software with the methylation module 1.8.2 for the extraction of the image intensities. Sample quality control based on probe detection and using the GenomeStudio p values of detection of signal above background resulted in the exclusion of 11 samples (at least 95% coverage per sample was required). In addition, probes that failed in at least one individual (n = 13,686) and that were not reported by the GenomeStudio software were discarded.
The signal intensities for the methylated and unmethylated states were then quantile normalized for each probe type separately, and beta values were calculated with R 2.12.0.25 Beta values are the ratio of the normalized intensity of the methylated bead type to the combined normalized locus intensity, and they range from 0 (hypomethylated) to 1 (hypermethylated). Principal-component analysis of the beta values was then performed for assessing the impact of known technical factors on the variation in beta values, as well as for detecting any potential outliers. Beadchip, bisulphite-sequencing (BS) conversion efficiency (assessed with the built-in BS conversion efficiency controls), and BS-treated DNA input were shown to contribute significantly to the variation in beta levels and were thus included together with age as covariates in subsequent analysis. After principal-component analysis, three samples were considered outliers and removed, leaving a total of 648 samples for subsequent analysis (see below).
Probe Mapping and Annotation
To test for cross hybridization, we mapped all probe sequences of Illumina’s Infinium HumanMethylation450K BeadChip (n = 485,764) to the human reference genome (GRCh37) with BLAT with default parameters.26 As described earlier, probes that were mapped to multiple locations with at least two mismatches were considered to be ambiguous.18 A total of 459,433 uniquely mapped autosomal probes were chosen and further filtered for sequence polymorphisms. Sequence variants from CEU (Utah residents with ancestry from northern and western Europe from the CEPH collection) populations were downloaded from the 1000 Genomes Project (release 3).27 Irrespective of their frequency, SNPs spanning the ten bases around the methylated base of the probes were deleted. A threshold of minor allele frequency (MAF) = 1% was set for SNPs overlapping the rest of the probe sequence. In addition, probes overlapping copy-number variants were deleted. This resulted in a final set of 357,802 probes. However, we restricted all of our analysis to 344,303 sites that were measured across all samples (Table S1).
Filtered probes were assigned to CpG islands (CGIs) and RefSeq transcripts that were downloaded from the UCSC Genome Browser. With the methylated site as a reference, all the probes were allocated to different gene properties, namely TSS200 (200 bases away from the 5′ end of the transcription start site [TSS]), TSS1500 (1,300 bases away from the 5′ end of TSS200), the 5′ UTR, the first exon, the gene body, and the 3′ UTR. Probes that were 2 kb away from either side of the CGIs were considered to be shores, and shelves were a further 2 kb away from either side of the shores.22
Methylation and Gene Expression Association
Associations between DNA methylation and gene expression levels were analyzed for 210,984 methylation and 18,818 expression probes situated on or 1,500 bp upstream of 13,532 genes. To test the associations, we used a linear mixed-effects model in R25 with the lme4 package28 lmer() function, fitted by maximum likelihood. The linear mixed-effects model was adjusted for both fixed effects (age, beadchip, BS conversion efficiency, and BS-treated DNA input) and random effects (family relationship and zygosity). We used a likelihood ratio test to assess the significance of the gene expression effect. The p value of the gene expression effect in each model was calculated from the Chi-square distribution with 1 degree of freedom (df) and −2log(likelihood ratio) as the test statistic. False-discovery rate (FDR) was calculated with the q value package29 implemented in R 2.11.25
Heritability Analysis
The classical twin design was applied for comparing the similarity of monozygotic (MZ) and dizygotic (DZ) twins by means of the ACE model, which partitions the variance into additive genetic (A), common environment (variance due to environmental effects shared within twin pairs) (C), and unique environment (environmental effects not shared within twin pairs) (E). Because all twin pairs included in the study visited the clinic in pairs and because MZ twins share 100% of their genes, any differences arising between them in these circumstances are unique (E). The correlation observed between MZ twins thus provides an estimate of A + C. In contrast, DZ twins have a common shared environment but share on average only 50% of their genes, such that the correlation between DZ twins is a direct estimate of 0.5(A + C). Consequently, twice the difference between MZ and DZ twins gives the genetic additive effect (A), and the common environment (E) is the MZ correlation minus the estimate of the genetic effect (A). A standard linear mixed model was used for estimating these variance components, as previously described.30 All available complete twin pairs were included in the model and corresponded to 97 MZ and 162 DZ pairs. Age, beadchip, BS conversion efficiency, and BS-treated DNA input were included in the model as covariates.
Pathway Analysis
In order to visualize the data in the context of biological networks, we analyzed functions or pathways data through the use of the Ingenuity Pathway Analysis (IPA) system (Ingenuity Systems). The data set containing genes for which shared environmental effect accounted for more than 30% of the total variance in methylation levels was uploaded to the application. Each gene identifier was mapped to its corresponding gene object in the Ingenuity Knowledge Base. These genes, called focus genes, were overlaid onto a global molecular network developed from information contained in the Ingenuity Knowledge Base. The functional analysis identified the biological functions that were most significant to the data set. In the data set, genes that met the cutoff and were associated with biological functions in the Ingenuity Knowledge Base were considered for the analysis. Fisher’s exact test was used for calculating a p value determining the probability that each biological function assigned to the data set was due to chance alone.
Insulin Association
Associations between DNA methylation and insulin levels were modeled with a linear mixed-effects model in R25 with the lme4 package28 lmer() function, fitted by maximum likelihood. The linear mixed-effects model was adjusted for both fixed effects (age, beadchip, BS conversion efficiency, and BS-treated DNA input) and random effects (family relationship and zygosity). A likelihood ratio test was used for assessing the significance of the phenotype effect. The p value of the phenotype effect in each model was calculated from the Chi-square distribution with 1 df and −2log(likelihood ratio) as the test statistic. Fisher’s exact test was used for assessing enrichment of phenotype associations in the set of shared environmentally controlled sites versus the full set of methylation sites.
Genotyping and Genotype Imputation
Genotyping of the TwinsUK data set (n = ∼6,000) was done with a combination of Illumina arrays (HumanHap300, HumanHap610Q, 1M-Duo, and 1.2MDuo 1M). Intensity data for each of the three arrays were pooled separately (with 1M-Duo and 1.2MDuo 1M pooled together), and genotypes were called with the Illuminus31 calling algorithm with the use of a threshold on a maximum posterior probability of 0.95, as previously described.32
Imputation was performed with the IMPUTE software package (v.2)33 with two reference panels, P0 (HapMap2, rel 22, combined CEU, YRI [Yoruba in Ibadan, Nigeria], and ASN [East Asian] panels) and P1 (610k+, including the combined HumanHap610k and 1M array). After imputation, SNPs were filtered at a MAF > 5% and IMPUTE info value of >0.8.
metQTL Analysis
Associations between DNA methylation levels and probabilities of imputed genotypes (MAF > 5%, info > 0.8) were tested in samples of related individuals by means of a two-step statistical approach implemented in the GenABEL and ProbABEL packages.34,35 In brief, a linear mixed (polygenic) model of methylation levels, covariates, and a kinship matrix was estimated in GenABEL, and a score test in ProbABEL followed. Age, beadchip, BS conversion efficiency, and BS-treated DNA input were included as cofactors. In total, 603 adipose samples had both methylation profiles and imputed genotypes and were thus included in the analysis. Cis analysis was limited to SNPs located within 100 kb of either side of the probe location. FDR for the cis analysis was calculated with the q value package29 implemented in R 2.11.25
The score test is known to slightly underestimate the additive effect sizes36 of each SNP, so the top association per probe was validated with a linear mixed-effects model in R with the lme4 package28 lmer() function, fitted by maximum likelihood. The linear mixed-effects model was adjusted for both fixed effects (age, beadchip, BS conversion efficiency, and BS-treated DNA input) and random effects (family relationship and zygosity). A likelihood ratio test was then applied for assessing the significance of the SNP effect. The p value of the SNP effect in each model was calculated from the Chi-square distribution with 1 df and −2log(likelihood ratio) as the test statistic.
To estimate the significance of our calculated FDR levels, we performed permutation tests as follows: 100 probes were selected at random from probes with at least one SNP association at a 1% FDR. For each probe, models were fitted to all SNPs in its 100 kb cis region. Current results are based on 100 permutations of the genotype data; the same permutation scheme (accounting for relatedness) was applied across the whole 100 kb cis region for preserving linkage disequilibrium (LD) structure. We then calculated the percentage of models in each permutation round (across all probe-SNP models) with a parametric p value below the threshold corresponding to a 1% FDR estimated from the data with a q value. We found ∼0.46% of the “permuted models” to have a p < 2.7 × 10⁻³ (corresponding to a 1% FDR) by chance. However, at the 1% FDR threshold, we found that in 2/100 permutation rounds, at least 1% of 14,803 random models had a p value below the threshold purely by chance. From the permuted data, we thus estimated that p < 6.46 × 10⁻³ corresponded to a 1% FDR, suggesting that the q value slightly overestimated the significance required at the selected FDR level when data were correlated.
metQTL and eQTL Overlap
Expression profiling of the MuTHER twins was performed on Illumina HT12 BeadChip as previously described.10 A total of 3,478 cis-eQTL (defined as a 1 Mb region on either side of the transcript) at a 1% FDR using 2,029,988 imputed SNPs (MAF > 5% and IMPUTE info value > 0.8) were discovered.10
To test the overlap of SNPs associated with methylation and expression, we used a two-step procedure. First, we considered expression and methylation probes situated on the same gene or 1,500 bp upstream of the gene (applicable to methylation probes only) and asked whether the top SNP associated with expression is the same as that associated with DNA methylation. In the second step, we used conditional analysis to test whether top SNPs associated with expression probes are in LD with any of the significant SNPs associated with methylation probes.37 For this, we ran a linear mixed model by conditioning on top SNPs associated with corresponding expression probes (expression score was used as the response variable, and batch and age were used as covariates).
Analysis of ChIP-Seq Data
Aligned chromatin immunoprecipitation sequencing (ChIP-seq) reads (.BAM files) from nuclei from adipose tissue derived from five independent donors were downloaded from the NIH Roadmap Epigenomics Project from the Gene Expression Omnibus repository. More specifically, aligned ChIP-seq reads of the H3K4me1 and H3K4me3 marks and the ChIP-seq input were used. The corresponding accession numbers were GSM621425, GSM669908, GSM669975, GSM670045, and GSM772757 for H3K4me1; GSM621435, GSM669925, GSM669988, GSM669998, and GSM670041 for H3K4me3; and GSM621401, GSM669934, GSM669940, GSM669984, and GSM670043 for the ChIP-seq input files. The embargo end date spanned from August 12, 2011 to September 28, 2012. The ChIP-seq data were processed as recently described.38 In brief, each file of the H3K4me1 and H3K4me3 marks was divided into 100 bp bins, and the number of reads within each bin was counted. For generating normalized intensity signals, the counts in each bin were further normalized according to the total number of reads. Input reads were processed in the same way, and their normalized signal-intensity values were subsequently subtracted from the ChIP-seq bins. The H3K4me1 and H3K4me3 bins were then ranked according to their normalized signal-intensity values, and the top 200,000 bins per histone mark and individual were kept. These top-ranked bins were further filtered such that only those that were present in at least three individuals for either mark were kept. For mapping promoters with the H3K4me3 mark, only bins mapping within 1 kb of the TSS of known RefSeq transcripts were considered. Finally, enhancers were identified with the H3K4me1 mark under the condition that no H3K4me3 bins could overlap.
Whole-Genome Bisulphite Sequencing
Whole genome bisulphite sequencing (WGBS) and library construction were carried out as described by Kulis et al.9 In brief, 1 μg of adipose-tissue-derived DNA was spiked with 0.2% unmethylated λ DNA (Promega) and sheared by sonication to 150–300 bp with a Covaris E220 Focused-ultrasonicator. Genomic DNA libraries were constructed with the TruSeq Sample Preparation Kit (Illumina) according to Illumina’s standard protocol. After adaptor ligation, bisulphite conversion was carried out with the Epitect Fast Bisulphite Kit (QIAGEN) according to the manufacturer’s protocol, ensuring conversion efficiency of >99%. The adaptor-ligated DNA was then enriched through four to eight cycles of PCR with the KAPA HiFi HotStart DNA Polymerase Kit (KAPA Biosystems). Library quality and quantity were monitored with the Agilent 2100 BioAnalyzer (Agilent) and the Quant-iT PicoGreen dsDNA Assay Kit (Life Technologies).
Each sample was sequenced on one lane of an Illumina HiSeq 2000 or 2500 system with the use of 100 bp paired-end sequencing, yielding on average 366 million total reads per sample. Reads were aligned to the bisulphite-converted reference genome with the Burrows-Wheeler Aligner; (1) clonal reads, (2) reads with a low-mapping quality score (<20), (3) reads with a more than 2% mismatch to the converted reference over the alignment length, (4) reads mapping to the forward and reverse strand of the bisulphite-converted genome, (5) read pairs not mapped to the expected distance according to the library insert size, and (6) read pairs mapping in the wrong direction were removed as described by Johnson et al.39 For avoiding potential biases in downstream analyses, the following WGBS-interrogated CpG sites were further filtered: sites not covered by at least three reads, sites overlapping a SNP (dbSNP 137), and sites overlapping DAC Blacklisted Regions or Duke Excluded Regions generated for the ENCODE project. The mean genome coverage was estimated to be ∼7-fold.
Results
Adipose DNA Methylation Profiles in Twins
DNA methylation profiles were successfully obtained from subcutaneous abdominal adipose tissue from 648 female twins (97 MZ pairs, 162 DZ pairs, and 130 singletons) included in the MuTHER study with the use of the Illumina HumanMethylation450 BeadChip. This array harbors a total of 485,764 probes, which interrogate almost exclusively CpG sites (see Subjects and Methods)40. We restricted our analyses to 344,303 probes (Table S1) that were unambiguously mapped, did not overlap with any common sequence polymorphisms, and were successfully measured in all samples (see Subjects and Methods). These are referred to here as methylation sites. These methylation sites were densely distributed across the genome; the median distance between adjacent sites was 391 bp, and a large proportion (32.3%) mapped to promoter regions, defined here as mapping in a window of 1,500 bp upstream of the TSS, in the 5′ UTR, or in the first exon of RefSeq transcripts. Of the 23,667 RefSeq genes, 20,144 (85.1%) had at least one site, and the average was 17 methylation sites per gene. We estimated 65,821 (19.1%) sites to be located in CGIs, where CpGs are highly clustered and mostly located near gene promoters and expressed genes; the mean methylation level was beta = 0.15 (Figure S3). This observation in adipose tissue is in line with previous findings showing hypomethylation of CGIs in other cell types.41
We then compared methylation levels of the 344,303 sites across all individuals and noted little variation at most sites (Figure S4). When restricting to the top 10% of variable sites (TVSs), we found enrichment in gene bodies (p = 1.7 × 10⁻⁴) and intergenic regions (p < 1 × 10⁻⁵), whereas promoter regions were depleted of TVSs (p < 1 × 10⁻⁵) (Figure 1). Similarly, we found TVSs to be depleted in CGIs (Figure S5).
Figure 1.
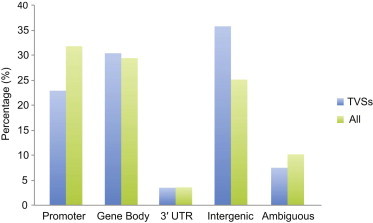
Distribution of Assessed Methylation Sites Based on Genomic Regions
Methylation sites were categorized in groups on the basis of their genomic location (x axis). The promoter region includes methylation sites located in a window of 1,500 bp upstream of the TSS, in the 5′ UTR, and in the first exon. Intergenic regions include methylation sites not mapping to any of the other categories, and ambiguous sites refer to sites that fell in at least two different categories. “TVSs” stands for top 10% of variable sites, and “All” stands for all mapped methylation sites (n = 344,303).
As previously shown, methylation levels of nearby CpG sites tend to be correlated.18,22 We found approximately a third of the TVSs to be clustered with a maximum probe-pair distance of 1 kb. The correlation of methylation levels between probes decreased with increasing interprobe distance (rho1–100 bp = 0.75 versus rho900–1,000 bp = 0.25) and dropped significantly once it exceeded 300 bp. Given that most of the non-TVSs exhibited minor variation across individuals, it is not a surprise that the correlation pattern of adjacent probes differed from that of TVSs (Figure S6).
DNA Methylation Variation and the Impact of Gene Expression
The MuTHER adipose tissue samples included here have previously been profiled on the IlluminaHT12 array for global gene expression patterns.10 Therefore, we were able to study the degree of association between DNA methylation and expression of nearby genes in this tissue. We limited the analysis to methylation sites that directly mapped to a RefSeq gene or 1,500 bp upstream of the TSS (see Subjects and Methods). Because the majority of genes harbor multiple methylation sites and expression probes, we ended up with 210,984 methylation and 18,818 expression probes situated in 13,532 genes. For any given gene, we tested associations between all methylation and expression-probe combinations mapping to the same transcript. From 314,697 associations, we found 7,706 to be significant at a 1% FDR (p = 2.6 × 10⁻⁴) (Table S2), indicating that 6,933 methylation sites (3.2% of the tested sites) and 2,334 genes (17.2% of the tested genes) had at least one significant association. Extending the support for earlier findings18,42 with regard to the direction of the effect, we found only a slight enrichment of negative correlations (median beta = −0.015) among all significant associations between DNA methylation and gene expression (Figure 2A), indicating that a large proportion of the significant associations were positive, i.e., increased methylation was linked to increased expression of the corresponding gene. We further divided our methylation-expression correlations into three groups based on the location(s) of the methylated site (promoter region, gene-body region, and 3′ UTR) and found negative correlations in all of them; median beta in promoter regions, gene-body regions, and 3′ UTRs was −0.018, −0.013, and −0.007, respectively. However, when we restricted to TVSs, we observed negative correlations for the sites located in promoter regions (median beta = −0.03) and positive correlations for those closer to 3′ UTRs (median beta = 0.02) (Figure 2B). This paradox of the positive correlation between gene-body methylation and gene expression levels is in line with previous reports43,44 but remains largely unexplained. However, it was recently suggested that gene-body methylation might serve to repress spurious transcription from intragenic promoters and thus allow for more efficient transcriptional elongation.45
Figure 2.
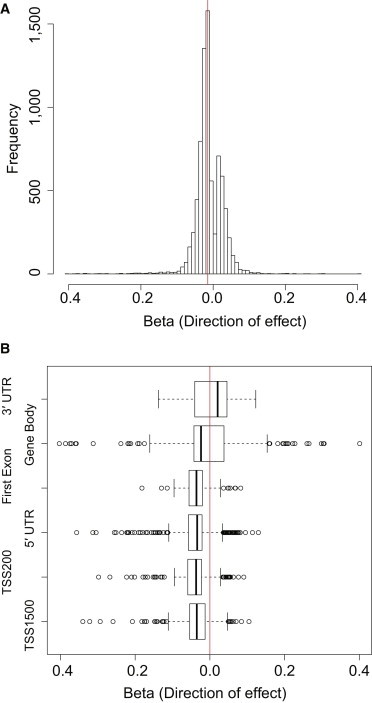
DNA Methylation Variation and the Impact of Gene Expression
We studied the correlation between DNA methylation and expression variation in adipose tissue by associating methylation sites mapping to RefSeq genes or 1,500 bp upstream of the TSS with the corresponding transcripts from the IlluminaHT12 expression array.
(A) Histogram showing the direction of effect (x axis) of all 7,706 associations significant at a 1% FDR; the vertical red line highlights the median value.
(B) Box plot of the direction of effect (x axis) of the significant associations limited to TVSs categorized in groups based on the location(s) of the methylation site (y axis). The five-number summaries in the plot of each group represent the smallest observation, lower quartile, median, upper quartile, and largest observation (sample maximum). The vertical red line indicates the central point of 0.
Impact of Genetic and Environmental Factors on DNA Methylation
Because our study included MZ (n = 97) and DZ (n = 162) twin pairs, we were able to distinguish between genetic and environmental effects on methylation variation and estimate their respective contributions. We first sought to study the correlation of adipose methylation states between individuals sharing 100% (MZ) or 50% (DZ) of the genetic makeup, as well as between unrelated individuals. Both using all sites and limiting to TVSs, we noted that concordance in methylation between MZ twins was greater than that in DZ twins and unrelated individuals, indicating genetic influences of DNA methylation (Figure S7). Given the invariability of methylation levels for the majority of the sites, correlation levels were relatively higher in the analysis of all sites (Figure S7A) than in that of only TVSs (Figure S7B). Next, we estimated narrow-sense heritability, h2, for 344,092 methylation sites by using a variance-component model adjusting for the identified technical cofactors (see Subjects and Methods).30 The average h2 estimates of methylation sites genome-wide corresponded to 0.19, which is well in agreement with estimates from a smaller twin study11 using the Illumina HumanMethylation27 panel. However, this array targets only sites located within proximal promoters of known genes (∼27,000 CpG sites in total). Here, we noted that the heritability estimate was considerably increased when we took variance into account (Figure S8). Limiting to the TVSs, we estimated that, on average, as much as 37% (median h2 = 0.34) of the phenotypic variance can be in fact attributed to genetic factors (Figure 3A).
Figure 3.
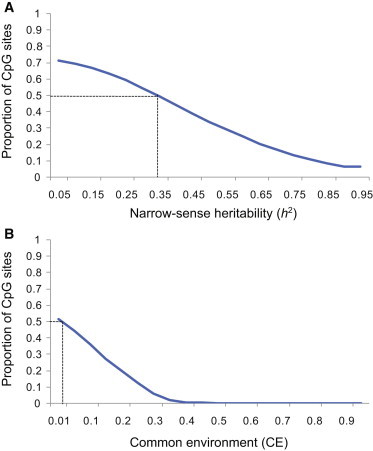
Genetic and Nongenetic Effect on Adipose DNA Methylation
For adipose methylation levels of TVSs (n = 34,430; measured on the Illumina450K array), the proportion of variation attributable to (A) genetic (h2) or (B) familial nongenetic factors (shared common environment [CE]) was estimated. The y axis shows the proportion of CpG sites at the h2 or CE cutoff indicated on the x axis. The dotted line represents median estimates.
As was the case for TVSs, we noted that highly heritable sites (h2 > 0.5, n = 48,072) were depleted in promoter regions (p < 1 × 10⁻⁵), which are known to be mainly hypomethylated.45 As such, when we compared the methylation profiles of these highly heritable sites to those of nonheritable sites, we found an enrichment of hypermethylation among highly heritable sites (Figures S9A and S9B). In addition, we also found that the proportion of heritable methylation sites was associated with genomic locations, given that significantly more heritable sites were noted in gene-body or intergenic regions than in regions close to the TSS (p < 1 × 10⁻⁵) (Figure S9B).
Twin studies also allow calculation of the proportion of phenotypic variation attributable to familial nongenetic factors, i.e., the shared common environment. We found shared environment to contribute little to methylation variation in adipose tissue (i.e., average 2% of TVSs and 0.2% of all sites), indicating that the remaining proportion of the nongenetic variance was due to nonshared environment and stochastic factors (Figure 3B). However, for 8,638 sites, we found shared environmental effect to account for more than 30% of the total variance in methylation levels. These sites, corresponding to 4,133 unique genes, were subjected to pathway analysis, where we found them to be significantly associated with functions related to metabolic diseases (p = 2.5 × 10⁻¹⁰). The top five functions associated with these genes are listed in Table 1 and include functions related to diabetes mellitus. Interestingly, when associating methylation levels of our TVSs with concurrently measured insulin levels, we noted a 2.3-fold enrichment (p < 1 × 10⁻⁵) of insulin-associated methylation sites regulated by shared environment factors among all significant associations (Bonferroni p < 1.4 × 10⁻⁶).
Table 1.
Top Functions of Genes with CpG Sites Affected by Shared Common Environment
| Category | Function Annotation | p Value | Number of Genes |
|---|---|---|---|
| Metabolic disease | glucose-metabolism disorder | 2.47 × 10⁻¹⁰ | 193 |
| Metabolic disease | diabetes mellitus | 1.41 × 10⁻⁹ | 176 |
| Metabolic disease | insulin resistance | 1.80 × 10⁻⁸ | 106 |
| Metabolic disease | non-insulin-dependent diabetes mellitus | 4.79 × 10⁻⁸ | 88 |
| Metabolic disease | insulin-dependent diabetes mellitus | 3.55 × 10⁻⁴ | 70 |
Common Variants Regulating DNA Methylation in Adipose Tissue
To map the underlying (common) genetic effect of adipose DNA methylation levels, we performed metQTL mapping by associating methylation levels with common sequence variants (MAF > 0.05) located close to the methylation site (CpG site ± 100 kb). This was performed with imputed HapMap2 genotypes in a linear mixed (polygenic) model and a subsequent score test accounting for relatedness. We called metQTL at a 1% FDR, corresponding to p < 8.6 × 10⁻⁴, and detected a high number of associations, i.e., 98,085 (28.5%) of the sites tested (corresponding to 74,174 unique SNPs) had a significant association with a common sequence variant (Table S3). The sequence variants associated with the methylation traits were overrepresented in regions close to the methylation site (Figure 4). Applying a more conservative threshold for significance as the Bonferroni correction (p < 1.2 × 10⁻⁹) led to the detection of 36,139 (10.5%) sites with a significant association. Although extensive filtering of probes was done prior to analysis (see Subjects and Methods) on the basis of known sequence variants both within the probe and at the CpG site, we did not rule out the possibility of additional low-frequency or rare variants at the CpG site, explaining some of these associations.
Figure 4.
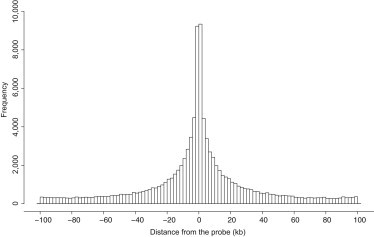
Distribution of Top SNPs Associated with the Probe
We performed metQTL analysis by associating methylation levels with common sequence variants (MAF > 0.05) located close to the probe (probe ± 100 kb). The histogram shows the distance from the methylation site (kb, x axis) for the significant associations identified at a 1% FDR.
For the sites associated with at least one common sequence variant at a 1% FDR, the average h2 estimate was 0.32, and when we restricted to those passing the Bonferroni correction, h2 was markedly higher (h2 = 0.44). We then sought to estimate how much of the heritability of each methylation site was driven by the identified metQTL SNPs. Because the current sample size was not sufficient for obtaining reliable h2 estimates of less than 0.1, we focused on the TVSs with h2 > 0.1 (n = 21,144) and combined the results from the heritability and metQTL analyses. We found that 15% of the sequence variants each explained more than 50% of the methylation heritability per site and that, on average, common variants explained 19% of the total genetic variance of DNA methylation (Figure S10). Taken together, the genetic contribution of the variation in methylation for a large proportion of the measured sites seems to be linked to a limited number of common variants.
In an attempt to study shared genetic regulation and links between DNA methylation and gene expression in adipose tissue, we overlapped our metQTL with eQTL from the same tissue and sample set.10 Of the 3,478 adipose tissue eQTL mapping to 3,142 genes at a 1% FDR, we found that 751 (21.6%) of the eQTL overlapped with at least one metQTL (i.e., a total of 1,510 metQTL overlapped with the 751 eQTL) at a similar significance (1% FDR) and also when LD was taken into account (see Subjects and Methods), i.e., sequence variants at 751 loci regulated both expression and DNA methylation of the corresponding gene (Table S4). These 751 loci corresponded to 702 genes (22.3%). We then studied whether there was a direct association between DNA methylation and gene expression at these 751 loci (Table S2). We found that 223 of the 751 loci also had a significant association (1% FDR) between gene expression and DNA methylation and were enriched with negative correlations (median beta = −0.02). These 223 eQTL were linked to 444 unique metQTL (a total of 473 metQTL), which we thereafter considered our set of high-confidence expression metQTL (Table S5).
Degree of Tissue Dependency of Expression metQTL
We next sought to study tissue dependency and independency of the 444 expression metQTL (i.e., genetic variants regulating both gene expression and DNA methylation in adipose tissue) and thus included data from eQTL mapping efforts in multiple tissues,10 such as skin and lymphoblastoid cell lines (LCLs). As described above, these 444 loci corresponded to 223 unique eQTL or genes, indicating that multiple methylation sites regulated by the same variant overlap with the same eQTL. Interestingly, when assessing tissue independency by studying shared effects at a 1% FDR, we found 58% of these adipose eQTL to be significant in at least one other tissue at a similar FDR. Using a conservative threshold of calling tissue-dependent effects (p > 0.05 in both LCLs and skin), we found that 20% of the eQTL were, however, restricted to adipose tissue. Thus, only a small proportion of expression metQTL appeared to be restricted to gene regulation in adipose tissue, although confirming this pattern will require the assessment of additional tissue types.
Given the high abundance of adipose metQTL, we next aimed to study the tissue dependency by performing replication studies in a subset of the samples where peripheral-blood-derived DNA was collected for methylation profiling with the Illumina450 array (n = 200). Of the 98,085 adipose tissue metQTL identified at a 1% FDR, 88,751 were available for testing in the corresponding blood-sample set. We found that 31,735 (35.7%) of the adipose tissue metQTL replicated in whole blood (same direction, p < 0.05) (Table S6). Estimating the proportion of true positives from the enrichment of low association p values (see Subjects and Methods), we confirmed the high replication rate of metQTL as π1 = 0.49 (Figure S10). The replication rate was significantly increased (p = 2.3 × 10⁻¹⁶) when we restricted to either TVSs, Bonferroni-corrected metQTL, or metQTL overlapping eQTL; as much as 48% of the TVS metQTL, 52% of the Bonferroni-corrected metQTL, and 52% of the expression metQTL were replicated in whole blood. The difference in replication rate might have been due to larger effect sizes of individual metQTL among the TVSs or enrichment of tissue-dependent metQTL with smaller effect sizes among all sites where the replication cohort lacked sufficient power to detect those effects. The correlation between highly heritable sites and significant replicated and nonreplicated metQTL is shown in Figure S12.
Epigenetic-Variant Annotation Using Regulatory-Element Mapping
As discussed above, we found that population variability of individual methylation sites was depleted in promoter regions (Figure 1). We also showed that most variable methylation sites led to no detectable changes in gene expression. Together, these findings indicate that methylation variation has “structure” and that blind mining of variable sites across the genome is likely to be ineffective in building insight into disease biology given the considerable nonfunctional methylation pattern. As a first hypothesis-free approach to understanding where the epigenetic variants lie in our 450K population data, we used publicly available reference epigenome data on human cells differentiated into adipocytes from the NIH RoadMap Epigenomics Mapping Consortium.23 The NIH RoadMap Project has not developed full integrative epigenomes from these cells, but chromatin mark data have been generated in five independent samples. We considered marks informative for active promoter (H3K4me3)46,47 and enhancer (H3K4me1) function48 and employed a simple background-subtracted binning approach.38 Considering only autosomes, we divided each data set into 100 bp bins, and after background subtraction and normalization, we restricted the analysis to the top 200,000 bins per sample (see Subjects and Methods). We then picked the bins present in at least three of the five samples for either mark. For H3K4me3, we further restricted to bins mapping within 1 kb of the TSS of known RefSeq transcripts. Finally, H3K4me1 bins overlapping with H3K4me3 were excluded. These bins were then overlapped with our methylation sites from the 450K data, which showed that 10,180 of 344,303 (3%) methylation sites were uniquely annotated to enhancer elements and 72,983 of 344,303 (21%) CpG sites were uniquely annotated to promoter elements (Table S7). These annotated regions, particularly promoter regions, were shown to be less variable than nonannotated regions (median varenhancer = 7.9 × 10⁻⁴, median varpromoter = 9.5 × 10⁻⁵, median varnonannotated = 6.1 × 10⁻⁴), as well as have distinct methylation profiles with clear hypomethylated states in the annotated regulatory regions (Figure 5). We then sought to correlate our epigenetic variants with their genomic location. For this purpose, we first used the metQTL shown to overlap with an eQTL in the same tissue as described above (n = 444) and divided this set of expression metQTL into those that were restricted to adipose tissue alone (20%) and the remaining expression metQTL. For both sets of sites, we noted significant enrichment (p < 1 × 10⁻⁵) in proximal regulatory elements (promoters) compared to all metQTLs (Figure 5D), which was most likely due to the fact that eQTL themselves were enriched in these regions. However, for the expression metQTL restricted to adipose tissue, we also noted significant enrichment (p = 0.03) in distal regulatory (enhancer) elements (Figure 5D), which is well in line with the notion that enhancer elements are involved in tissue-specific gene regulation. Next, we examined metQTL that overlapped with disease or trait loci reported in the National Human Genome Research Institute GWAS catalog (accessed January 2, 2013). Of the 74,174 sequence variants associated with at least one methylation site (metSNPs) (see above) and their proxies (R′ > 0.8), 2,768 overlapped with at least one disease locus and were included here for functional annotation. As we did for the expression metQTL, we divided the set of sites into those that overlapped with a metabolic disease locus (Table S8) and the remaining disease or trait loci. Interestingly, for both sets we noted significant enrichment (p < 0.0001) of metSNPs associated with a disease locus in distal (enhancer) regulatory elements but that metQTL overlapping metabolic trait loci had a slightly more pronounced effect (1.9-fold versus 1.7-fold) (Figure 5D). As proof of principle, we followed up in more detail with one of the top metabolic disease loci overlapping an enhancer metQTL, namely the SNP rs713586, which is associated with body mass index (BMI) from a large GWAS of almost 250,000 individuals49 and is a metQTL for the nearby cg01884057 site (chr2: 25,150,051) (Figures 6A–6C). The enhancer region mapped to chr2: 25,149,200–25,150,300 and included three additional CpG sites measured by the 450K array: cg08526959 (chr2: 25,149,334), cg22480783 (chr2: 25,149,622), and cg15423357 (chr2: 25,149,977) (Figure 7). Apart from cg01884057 (p = 1.49 × 10⁻¹⁴), only cg15423357 (p = 3.3 × 10⁻¹¹) was associated with the rs713586 SNP, and both had low methylation levels. We next sought to fine map and validate the methylation status and sequence-dependent effect and thus performed WGBS experiments in 30 adipose samples (Figure 7). In total, 41 methylation sites in the enhancer region were measured by WGBS, and the methylation levels of the four sites corresponding to the 450K probes were significantly correlated (Spearman rho = 0.99). Because of our limited sample size for WGBS, we restricted the replication of the sequence-dependent effect to the hypomethylated region showing an association with rs713586 on the 450K array, i.e., chr2: 25,149,628–25,150,147. Our WGBS covered 23 CpG sites in this region; however, only 9 of the 23 sites had measurements from at least three individuals per rs713586-genotype group and were included in the replication analysis. The overall direction of effect was in agreement with the 450K data, and a combined test of all CpG sites confirmed the significant rs713586-genotype dependency of methylation status in the region (Spearman rho = −0.21, p = 2.0 × 10⁻³) (Figure 7). Interestingly, rs713586 was in perfect LD (i.e., LD = 1) with an untyped 1000 Genomes SNP (rs6749422, chr2: 25,150,011) that maps to the refined enhancer region just downstream of our top methylation association (Figure 7). More specifically, as shown by RegulomeDB,50 rs6749422 directly overlaps with four transcription factor binding sites identified by the ENCODE project;51 these include USF1, previously linked to transcriptional control of metabolic processes and metabolic disorders.46,47 This is of interest because the refined enhancer region is <10 kb upstream of ADCY3, which encodes a protein that belongs to the adenylate cyclase family of enzymes responsible for the synthesis of cyclic AMP and has been linked to obesity (MIM 601665)52 and metabolic processes such as the insulin-signaling pathway53.
Figure 5.
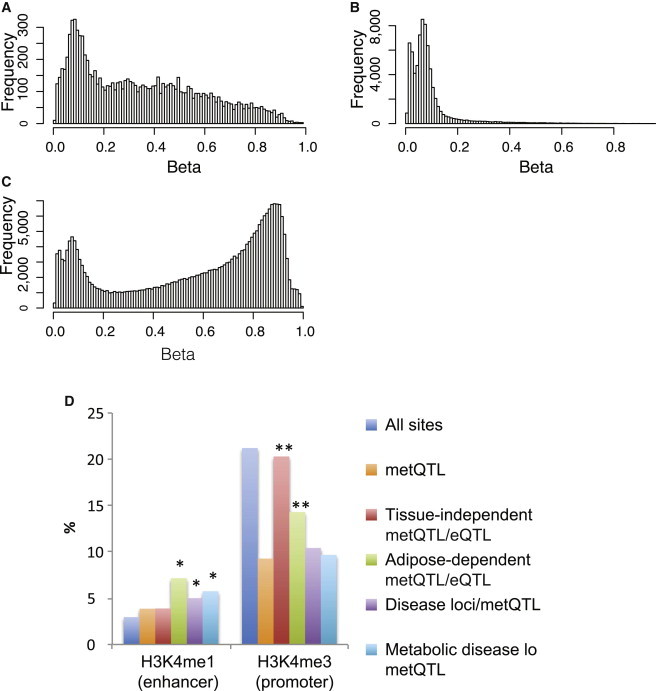
Annotation of Functional Epigenetic Variation in Regulatory Elements
(A–C) DNA methylation sites assessed by the Illumina 450K array were correlated with regulatory elements in human adipocytes from the NIH RoadMap Epigenomics Project with the use of the H3K4me1 (enhancer) and H3K4me3 (promoter) marks. Methylation profiles (beta-values, x axis) of methylation sites overlapping (A) distal regulatory elements (enhancers, n = 10,180), (B) promoter elements (n = 72,983), and (C) nonannotating regions (n = 261,140) are plotted.
(D) Bar plot showing the proportion (%, y axis) of all methylation sites (blue bars, n = 344,303), metQTL (orange bars, n = 98,085), metQTL overlapping with eQTL independently of tissue type (red bars, n = 360), metQTL overlapping with eQTL in adipose tissue only (green bars, n = 70), metQTL overlapping disease loci (purple bars, n = 3,583), and metQTL overlapping metabolic disease loci (light blue bars, n = 383) in enhancer (left) and promoter regions (right). ∗p < 0.05, ∗∗p < 10−4, Fisher’s exact test.
Figure 6.
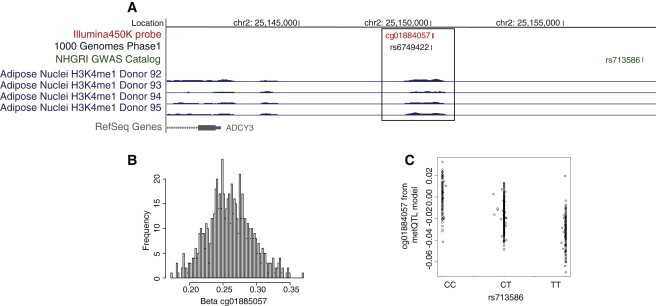
Example Region of a metQTL Overlapping with a BMI Locus Mapping to an Enhancer Element in Adipose Tissue
(A) The methylation site measured by the cg01884057 probe (red panel) mapped to an enhancer bin region (chr2: 25,149,200–25,150,300) identified in four independent adipocyte samples included in the NIH Roadmap Epigenomics Project (blue panel). The methylation site (cg01884057, red panel) was significantly associated (p = 1.5 × 10⁻¹⁴) with the nearby rs713586 SNP (green panel), which is also a GWAS locus for BMI. The rs713586 SNP was in perfect LD (R′ = 1) with rs6749422 (black panel), recently identified in the 1000 Genomes Project.
(B) Methylation profile of the cg01884057 methylation site; the beta-value (x axis) indicates the hypomethylated state.
(C) A scatterplot of the association between rs713586 genotypes (x axis) and cg01884057 methylation (y axis) is represented by residuals from the metQTL model after adjustment for confounders.
Figure 7.
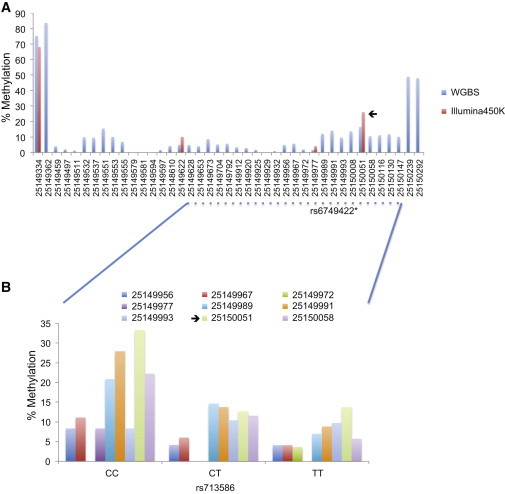
Validation of Disease-Linked Enhancer Region by WGBS
(A) The methylation status (y axis) of methylation sites in the complete enhancer region (chr2: 25,149,200–25,150,300) was measured by the Illumina450K array (red bars) or WGBS (blue bars). The black arrow indicates the top methylation site associated with the rs713586 SNP.
(B) WGBS replication analysis of the methylation status (y axis) of nine methylation sites and rs713586 genotypes (x axis). The black arrow indicates the top CpG site associated with the rs713586 SNP on the Illumina450K array.
Discussion
We performed a large population-based methylation survey of >450,000 CpG sites across the genome in 648 deeply phenotyped female twins from the MuTHER adipose tissue resource by using the Illumina 450K array. In this study, we integrated our methylation data with existing genetic and gene expression information,10 extending our understanding of the regulation of global DNA methylation patterns and the degree of interindividual variation. For instance, we showed that there is remarkably low variance in global methylation patterns across healthy individuals after technical and biological factors such as age are taken into account.11 This invariability in methylation levels has an impact on the discovery rate of the various analyses performed and has a pronounced effect on global heritability estimates and detected metQTL (Figure S13). We also note that population variability in DNA methylation is suppressed in regions known to be important in gene regulation, such as promoters, whereas variable methylation sites are found in gene-body and intergenic regions. These findings are in line with evidence showing that epigenetic states at promoter regions are evolutionarily conserved,54 and such regions are believed to have low levels of variation. In parallel, we confirmed the inverse relationship of methylation states in promoter versus gene-body regions in that CpG sites around the TSS were shown to be hypomethylated, whereas clear hypermethylation was seen for sites located in gene bodies.55 The dense coverage of CpG sites across most RefSeq genes22 allowed a comprehensive assessment of directionality for associations between DNA methylation and gene expression. First, we confirmed previous studies showing only a slight enrichment of negative correlations between DNA methylation and gene expression.18,42 Second, when taking CpG site variability into account, we found evidence that the direction of the effect of DNA methylation on the expression of neighboring genes is dependent on the genomic location of the CpG site. As expected, significant associations between promoter DNA methylation and gene expression were found to be negative, but there were indications of the opposite scenario (i.e., positive correlations) for associations between gene-body (including the 3′ UTR) DNA methylation and gene expression.43,44 This phenomenon has been suggested to be related to elongation efficiency and prevention of spurious initiation of transcription.45 Namely, a high level of gene-body methylation might improve transcription efficiency of actively transcribed genes by interfering with nonproductive transcription initiation within transcribed regions.44
With the advantage of a twin-study design, we were also able to perform large-scale heritability analysis of DNA methylation patterns not limited to promoter CpG sites, as were previous studies.11,56 These nonpromoter (gene-body and intergenic), hypermethylated CpGs were found not only to be highly variable across individuals but also to be regulated to a large extent by genetic factors. This pattern was further supported by metQTL mapping showing a high degree of sequence dependency of variable CpG sites. However, the majority of these genetically controlled CpG sites seem to be “neutral” without a clear biological or functional mechanism such as changes in gene expression or disease risk. This is, in fact, in agreement with a recent report in which the mouse methylome showed a high degree of sequence dependency of methylation sites occurring at bases adjacent to the CG site57 and might indicate high sequence specificity for the DNA methylation machinery even in the human methylome. Nevertheless, we show examples of how functional epigenetic variants important in gene regulation or disease susceptibility can be identified and characterized by the integration of methylome data with reference epigenomes. Using ChiP-seq data from human cells differentiated into adipocytes (from the NIH RoadMap Epigenomics Mapping Consortium),23 we found that metQTL overlapping eQTL restricted to adipose tissue or metabolic-trait or disease loci were enriched in distal regulatory elements (i.e., enhancers). These enhancer elements were mostly hypomethylated, which is in line with previous findings of the correlation between low methylation levels and open chromatin.18,58 This is believed to occur to facilitate chromatin accessibility for the cellular machinery and thereby modulate the transcriptional potential of the underlying DNA sequence.59 These findings also highlight the tissue- or cell-specific nature of disease-associated gene regulation and that, similar to transcriptomic approaches designed for understanding disease associations and their underlying biological mechanisms, epigenomic studies require samples that are directly targeted to the disease or trait of interest. Our findings also support recent reports of the enrichment of disease SNPs in active chromatin measured by DNaseI hypersensitivity sites60 or within enhancer elements specifically active in relevant cell types,61 but our data indicate that this association is due to genetically driven methylation variation occurring at these regulatory elements. Using WGBS, we followed up with one of the metabolic disease and adipose-tissue-specific metQTL identified in our adipose 450K array analysis. The association mapped to an enhancer element located ∼10 kb upstream of ADCY3, which has been linked to multiple metabolic diseases and processes.52,53 Our fine-mapping efforts here suggest that the link between the enhancer metQTL and the regulation of the metabolic-disease-associated gene is through altered binding of a transcription factor. This as the sequence variant (associated with adipose DNA methylation status and BMI from large GWASs) seems to alter the binding of USF1, which is known to be a transcription factor controlling the expression of several genes involved in lipid and glucose homeostasis.
In conclusion, we present a unique large-scale population- and tissue-based methylome survey by the Illumina450K array. Our results showed low levels of variation in global CpG methylation, particularly in hypomethylated promoter regions, which still represent a substantial proportion of sites included on the 450K array. On the other hand, gene-body methylation and intergenic CpG methylation showed a different pattern: apart from being more hypermethylated, they were also more variable across individuals with a higher degree of heritable sequence dependency. The exact biological role of this phenomenon remains unclear and warrants continued investigation. Finally, we show evidence that the presence of functional relevant hypomethylated regions mapping to regulatory elements specific to adipose tissue plays a key role in adipose-dependent gene regulation and metabolic-disease susceptibility. These regions are, however, only sparsely covered by the 450K array, and together with the small fraction of methylation variation accessible through this targeted array, our data highlight the need for more comprehensive and unbiased disease-tailored studies of CpG variation in the future.
Consortia
The members of the MuTHER Consortium are Kourosh R. Ahmadi, Chrysanthi Ainali, Amy Barrett, Veronique Bataille, Jordana T. Bell, Alfonso Buil, Panos Deloukas, Emmanouil T. Dermitzakis, Antigone S. Dimas, Richard Durbin, Daniel Glass, Elin Grundberg, Neelam Hassanali, Åsa K. Hedman, Catherine Ingle, David Knowles, Maria Krestyaninova, Cecilia M. Lindgren, Christopher E. Lowe, Mark I. McCarthy, Eshwar Meduri, Paola di Meglio, Josine L. Min, Stephen B. Montgomery, Frank O. Nestle, Alexandra C. Nica, James Nisbet, Stephen O’Rahilly, Leopold Parts, Simon Potter, Johanna Sandling, Magdalena Sekowska, So-Youn Shin, Kerrin S. Small, Nicole Soranzo, Tim D. Spector, Gabriela Surdulescu, Mary E. Travers, Loukia Tsaprouni, Sophia Tsoka, Alicja Wilk, Tsun-Po Yang, and Krina T. Zondervan
Acknowledgments
P.D. is supported by Wellcome Trust (WT) core grant 098051 to the WT Sanger Institute (WTSI), which covered genotyping and DNA methylation analysis. We thank the Genotyping Facilities and Variation Informatics at the WTSI for sample preparation, quality control, and genotyping. Genotyping was also performed by the Center for Inherited Disease Research as part of a National Eye Institute, National Institutes of Health (NIH) project grant. The MuTHER Study was funded by the WT (081917/Z/07/Z) and core funding for the WT Centre for Human Genetics (090532). TwinsUK was funded by the WT and European Community’s Seventh Framework Programme (FP7/2007-2013). The study also received support from the National Institute for Health Research (NIHR) Clinical Research Facility at Guy’s & St. Thomas’ National Health Service (NHS) Foundation Trust and NIHR Biomedical Research Centre based at Guy’s and St. Thomas’ NHS Foundation Trust and King’s College London. T.D.S. is an NIHR senior investigator and holder of a European Research Council Advanced Principal Investigator award. M.I.M. is supported by the WT (083270/Z/07/Z), and J.K.S. is supported by a Swedish Research Council postdoc grant (C0025601). The authors thank the McGill University Epigenome Mapping Centre, funded by the Canadian Institutes of Health Research Canadian Epigenetics, Environment, and Health Research Consortium (EP1-120608), and NIH Roadmap Epigenomics Mapping Consortium and Mapping Centers for the production of publicly available reference epigenomes. Specifically, we thank the mapping center at Massachusetts General Hospital and the Broad Institute of MIT and Harvard for generating human adipose reference epigenomes used in this study.
Contributor Information
Elin Grundberg, Email: elin.grundberg@mcgill.ca.
Panos Deloukas, Email: p.deloukas@qmul.ac.uk.
the Multiple Tissue Human Expression Resource Consortium:
Kourosh R. Ahmadi, Chrysanthi Ainali, Amy Barrett, Veronique Bataille, Jordana T. Bell, Alfonso Buil, Panos Deloukas, Emmanouil T. Dermitzakis, Antigone S. Dimas, Richard Durbin, Daniel Glass, Elin Grundberg, Neelam Hassanali, Åsa K. Hedman, Catherine Ingle, David Knowles, Maria Krestyaninova, Cecilia M. Lindgren, Christopher E. Lowe, Mark I. McCarthy, Eshwar Meduri, Paola di Meglio, Josine L. Min, Stephen B. Montgomery, Frank O. Nestle, Alexandra C. Nica, James Nisbet, Stephen O’Rahilly, Leopold Parts, Simon Potter, Johanna Sandling, Magdalena Sekowska, So-Youn Shin, Kerrin S. Small, Nicole Soranzo, Tim D. Spector, Gabriela Surdulescu, Mary E. Travers, Loukia Tsaprouni, Sophia Tsoka, Alicja Wilk, Tsun-Po Yang, and Krina T. Zondervan
Supplemental Data
Web Resources
The URLs for data presented herein are as follows:
Genevar (Gene Expression Variation), http://www.sanger.ac.uk/resources/software/genevar/
Multiple Tissue Human Expression Resource (MuTHER), http://www.muther.ac.uk
NIH Roadmap Epigenomics Project, www.ncbi.nlm.nih.gov/geo/roadmap/epigenomics/
Online Mendelian Inheritance in Man (OMIM), www.omim.org
Accession Numbers
The ArrayExpress accession numbers for the gene expression and DNA methylation data sets reported in this paper are E-TABM-1140 and E-MTAB-1866.
References
- 1.Visscher P.M., Brown M.A., McCarthy M.I., Yang J. Five years of GWAS discovery. Am. J. Hum. Genet. 2012;90:7–24. doi: 10.1016/j.ajhg.2011.11.029. [DOI] [PMC free article] [PubMed] [Google Scholar]
- 2.Hindorff L.A., Sethupathy P., Junkins H.A., Ramos E.M., Mehta J.P., Collins F.S., Manolio T.A. Potential etiologic and functional implications of genome-wide association loci for human diseases and traits. Proc. Natl. Acad. Sci. USA. 2009;106:9362–9367. doi: 10.1073/pnas.0903103106. [DOI] [PMC free article] [PubMed] [Google Scholar]
- 3.Grundberg E., Kwan T., Ge B., Lam K.C., Koka V., Kindmark A., Mallmin H., Dias J., Verlaan D.J., Ouimet M. Population genomics in a disease targeted primary cell model. Genome Res. 2009;19:1942–1952. doi: 10.1101/gr.095224.109. [DOI] [PMC free article] [PubMed] [Google Scholar]
- 4.Dimas A.S., Deutsch S., Stranger B.E., Montgomery S.B., Borel C., Attar-Cohen H., Ingle C., Beazley C., Gutierrez Arcelus M., Sekowska M. Common regulatory variation impacts gene expression in a cell type-dependent manner. Science. 2009;325:1246–1250. doi: 10.1126/science.1174148. [DOI] [PMC free article] [PubMed] [Google Scholar]
- 5.Dixon A.L., Liang L., Moffatt M.F., Chen W., Heath S., Wong K.C., Taylor J., Burnett E., Gut I., Farrall M. A genome-wide association study of global gene expression. Nat. Genet. 2007;39:1202–1207. doi: 10.1038/ng2109. [DOI] [PubMed] [Google Scholar]
- 6.Degner J.F., Pai A.A., Pique-Regi R., Veyrieras J.B., Gaffney D.J., Pickrell J.K., De Leon S., Michelini K., Lewellen N., Crawford G.E. DNase I sensitivity QTLs are a major determinant of human expression variation. Nature. 2012;482:390–394. doi: 10.1038/nature10808. [DOI] [PMC free article] [PubMed] [Google Scholar]
- 7.Paul D.S., Albers C.A., Rendon A., Voss K., Stephens J., van der Harst P., Chambers J.C., Soranzo N., Ouwehand W.H., Deloukas P., HaemGen Consortium Maps of open chromatin highlight cell type-restricted patterns of regulatory sequence variation at hematological trait loci. Genome Res. 2013;23:1130–1141. doi: 10.1101/gr.155127.113. [DOI] [PMC free article] [PubMed] [Google Scholar]
- 8.Liu Y., Aryee M.J., Padyukov L., Fallin M.D., Hesselberg E., Runarsson A., Reinius L., Acevedo N., Taub M., Ronninger M. Epigenome-wide association data implicate DNA methylation as an intermediary of genetic risk in rheumatoid arthritis. Nat. Biotechnol. 2013;31:142–147. doi: 10.1038/nbt.2487. [DOI] [PMC free article] [PubMed] [Google Scholar]
- 9.Kulis M., Heath S., Bibikova M., Queirós A.C., Navarro A., Clot G., Martínez-Trillos A., Castellano G., Brun-Heath I., Pinyol M. Epigenomic analysis detects widespread gene-body DNA hypomethylation in chronic lymphocytic leukemia. Nat. Genet. 2012;44:1236–1242. doi: 10.1038/ng.2443. [DOI] [PubMed] [Google Scholar]
- 10.Grundberg E., Small K.S., Hedman A.K., Nica A.C., Buil A., Keildson S., Bell J.T., Yang T.P., Meduri E., Barrett A., Multiple Tissue Human Expression Resource (MuTHER) Consortium Mapping cis- and trans-regulatory effects across multiple tissues in twins. Nat. Genet. 2012;44:1084–1089. doi: 10.1038/ng.2394. [DOI] [PMC free article] [PubMed] [Google Scholar]
- 11.Bell J.T., Tsai P.C., Yang T.P., Pidsley R., Nisbet J., Glass D., Mangino M., Zhai G., Zhang F., Valdes A., MuTHER Consortium Epigenome-wide scans identify differentially methylated regions for age and age-related phenotypes in a healthy ageing population. PLoS Genet. 2012;8:e1002629. doi: 10.1371/journal.pgen.1002629. [DOI] [PMC free article] [PubMed] [Google Scholar]
- 12.Gentilini D., Mari D., Castaldi D., Remondini D., Ogliari G., Ostan R., Bucci L., Sirchia S.M., Tabano S., Cavagnini F. Role of epigenetics in human aging and longevity: genome-wide DNA methylation profile in centenarians and centenarians’ offspring. Age (Dordr.) 2013;35:1961–1973. doi: 10.1007/s11357-012-9463-1. [DOI] [PMC free article] [PubMed] [Google Scholar]
- 13.McKay J.A., Groom A., Potter C., Coneyworth L.J., Ford D., Mathers J.C., Relton C.L. Genetic and non-genetic influences during pregnancy on infant global and site specific DNA methylation: role for folate gene variants and vitamin B12. PLoS ONE. 2012;7:e33290. doi: 10.1371/journal.pone.0033290. [DOI] [PMC free article] [PubMed] [Google Scholar]
- 14.Joubert B.R., Håberg S.E., Nilsen R.M., Wang X., Vollset S.E., Murphy S.K., Huang Z., Hoyo C., Midttun O., Cupul-Uicab L.A. 450K epigenome-wide scan identifies differential DNA methylation in newborns related to maternal smoking during pregnancy. Environ. Health Perspect. 2012;120:1425–1431. doi: 10.1289/ehp.1205412. [DOI] [PMC free article] [PubMed] [Google Scholar]
- 15.Breitling L.P., Yang R., Korn B., Burwinkel B., Brenner H. Tobacco-smoking-related differential DNA methylation: 27K discovery and replication. Am. J. Hum. Genet. 2011;88:450–457. doi: 10.1016/j.ajhg.2011.03.003. [DOI] [PMC free article] [PubMed] [Google Scholar]
- 16.Kerkel K., Spadola A., Yuan E., Kosek J., Jiang L., Hod E., Li K., Murty V.V., Schupf N., Vilain E. Genomic surveys by methylation-sensitive SNP analysis identify sequence-dependent allele-specific DNA methylation. Nat. Genet. 2008;40:904–908. doi: 10.1038/ng.174. [DOI] [PubMed] [Google Scholar]
- 17.Gibbs J.R., van der Brug M.P., Hernandez D.G., Traynor B.J., Nalls M.A., Lai S.L., Arepalli S., Dillman A., Rafferty I.P., Troncoso J. Abundant quantitative trait loci exist for DNA methylation and gene expression in human brain. PLoS Genet. 2010;6:e1000952. doi: 10.1371/journal.pgen.1000952. [DOI] [PMC free article] [PubMed] [Google Scholar]
- 18.Bell J.T., Pai A.A., Pickrell J.K., Gaffney D.J., Pique-Regi R., Degner J.F., Gilad Y., Pritchard J.K. DNA methylation patterns associate with genetic and gene expression variation in HapMap cell lines. Genome Biol. 2011;12:R10. doi: 10.1186/gb-2011-12-1-r10. [DOI] [PMC free article] [PubMed] [Google Scholar]
- 19.Drong A.W., Nicholson G., Hedman A.K., Meduri E., Grundberg E., Small K.S., Shin S.Y., Bell J.T., Karpe F., Soranzo N., MolPAGE Consortia The presence of methylation quantitative trait loci indicates a direct genetic influence on the level of DNA methylation in adipose tissue. PLoS ONE. 2013;8:e55923. doi: 10.1371/journal.pone.0055923. [DOI] [PMC free article] [PubMed] [Google Scholar]
- 20.Eckhardt F., Lewin J., Cortese R., Rakyan V.K., Attwood J., Burger M., Burton J., Cox T.V., Davies R., Down T.A. DNA methylation profiling of human chromosomes 6, 20 and 22. Nat. Genet. 2006;38:1378–1385. doi: 10.1038/ng1909. [DOI] [PMC free article] [PubMed] [Google Scholar]
- 21.Irizarry R.A., Ladd-Acosta C., Wen B., Wu Z., Montano C., Onyango P., Cui H., Gabo K., Rongione M., Webster M. The human colon cancer methylome shows similar hypo- and hypermethylation at conserved tissue-specific CpG island shores. Nat. Genet. 2009;41:178–186. doi: 10.1038/ng.298. [DOI] [PMC free article] [PubMed] [Google Scholar]
- 22.Bibikova M., Barnes B., Tsan C., Ho V., Klotzle B., Le J.M., Delano D., Zhang L., Schroth G.P., Gunderson K.L. High density DNA methylation array with single CpG site resolution. Genomics. 2011;98:288–295. doi: 10.1016/j.ygeno.2011.07.007. [DOI] [PubMed] [Google Scholar]
- 23.Chadwick L.H. The NIH Roadmap Epigenomics Program data resource. Epigenomics. 2012;4:317–324. doi: 10.2217/epi.12.18. [DOI] [PMC free article] [PubMed] [Google Scholar]
- 24.Spector T.D., Williams F.M. The UK Adult Twin Registry (TwinsUK) Twin Res. Hum. Genet. 2006;9:899–906. doi: 10.1375/183242706779462462. [DOI] [PubMed] [Google Scholar]
- 25.R Development Core Team . R Foundation for Statistical Computing; Vienna: 2010. R: A language and environment for statistical computing.http://www.R-project.org ISBN 3-900051-07-0. [Google Scholar]
- 26.Kent W.J. BLAT—the BLAST-like alignment tool. Genome Res. 2002;12:656–664. doi: 10.1101/gr.229202. [DOI] [PMC free article] [PubMed] [Google Scholar]
- 27.Abecasis G.R., Altshuler D., Auton A., Brooks L.D., Durbin R.M., Gibbs R.A., Hurles M.E., McVean G.A., 1000 Genomes Project Consortium A map of human genome variation from population-scale sequencing. Nature. 2010;467:1061–1073. doi: 10.1038/nature09534. [DOI] [PMC free article] [PubMed] [Google Scholar]
- 28.Bates, D., Maechler, M., Bolker, B. (2011). lme4: linear mixed-effects models using S4 classes, http://lme4.r-forge.r-project.org/.
- 29.Storey J.D., Tibshirani R. Statistical significance for genomewide studies. Proc. Natl. Acad. Sci. USA. 2003;100:9440–9445. doi: 10.1073/pnas.1530509100. [DOI] [PMC free article] [PubMed] [Google Scholar]
- 30.Visscher P.M., Benyamin B., White I. The use of linear mixed models to estimate variance components from data on twin pairs by maximum likelihood. Twin Res. 2004;7:670–674. doi: 10.1375/1369052042663742. [DOI] [PubMed] [Google Scholar]
- 31.Teo Y.Y., Inouye M., Small K.S., Gwilliam R., Deloukas P., Kwiatkowski D.P., Clark T.G. A genotype calling algorithm for the Illumina BeadArray platform. Bioinformatics. 2007;23:2741–2746. doi: 10.1093/bioinformatics/btm443. [DOI] [PMC free article] [PubMed] [Google Scholar]
- 32.Small K.S., Hedman A.K., Grundberg E., Nica A.C., Thorleifsson G., Kong A., Thorsteindottir U., Shin S.Y., Richards H.B., Soranzo N., GIANT Consortium. MAGIC Investigators. DIAGRAM Consortium. MuTHER Consortium Identification of an imprinted master trans regulator at the KLF14 locus related to multiple metabolic phenotypes. Nat. Genet. 2011;43:561–564. doi: 10.1038/ng.833. [DOI] [PMC free article] [PubMed] [Google Scholar]
- 33.Howie B.N., Donnelly P., Marchini J. A flexible and accurate genotype imputation method for the next generation of genome-wide association studies. PLoS Genet. 2009;5:e1000529. doi: 10.1371/journal.pgen.1000529. [DOI] [PMC free article] [PubMed] [Google Scholar]
- 34.Aulchenko Y.S., Ripke S., Isaacs A., van Duijn C.M. GenABEL: an R library for genome-wide association analysis. Bioinformatics. 2007;23:1294–1296. doi: 10.1093/bioinformatics/btm108. [DOI] [PubMed] [Google Scholar]
- 35.Aulchenko Y.S., Struchalin M.V., van Duijn C.M. ProbABEL package for genome-wide association analysis of imputed data. BMC Bioinformatics. 2010;11:134. doi: 10.1186/1471-2105-11-134. [DOI] [PMC free article] [PubMed] [Google Scholar]
- 36.Chen W.M., Abecasis G.R. Family-based association tests for genomewide association scans. Am. J. Hum. Genet. 2007;81:913–926. doi: 10.1086/521580. [DOI] [PMC free article] [PubMed] [Google Scholar]
- 37.Yang J., Ferreira T., Morris A.P., Medland S.E., Madden P.A., Heath A.C., Martin N.G., Montgomery G.W., Weedon M.N., Loos R.J., Genetic Investigation of ANthropometric Traits (GIANT) Consortium. DIAbetes Genetics Replication And Meta-analysis (DIAGRAM) Consortium Conditional and joint multiple-SNP analysis of GWAS summary statistics identifies additional variants influencing complex traits. Nat. Genet. 2012;44:369–375. doi: 10.1038/ng.2213. S1–S3. [DOI] [PMC free article] [PubMed] [Google Scholar]
- 38.Shen Y., Yue F., McCleary D.F., Ye Z., Edsall L., Kuan S., Wagner U., Dixon J., Lee L., Lobanenkov V.V., Ren B. A map of the cis-regulatory sequences in the mouse genome. Nature. 2012;488:116–120. doi: 10.1038/nature11243. [DOI] [PMC free article] [PubMed] [Google Scholar]
- 39.Johnson M.D., Mueller M., Game L., Aitman T.J. Single nucleotide analysis of cytosine methylation by whole-genome shotgun bisulphite sequencing. Curr. Protoc. Mol. Biol. 2012;Chapter 21:23. doi: 10.1002/0471142727.mb2123s99. [DOI] [PubMed] [Google Scholar]
- 40.Bibikova M., Le J., Barnes B., Saedinia-Melnyk S., Zhou L., Shen R., Gunderson K.L. Genome-wide DNA methylation profiling using Infinium® assay. Epigenomics. 2009;1:177–200. doi: 10.2217/epi.09.14. [DOI] [PubMed] [Google Scholar]
- 41.Doi A., Park I.H., Wen B., Murakami P., Aryee M.J., Irizarry R., Herb B., Ladd-Acosta C., Rho J., Loewer S. Differential methylation of tissue- and cancer-specific CpG island shores distinguishes human induced pluripotent stem cells, embryonic stem cells and fibroblasts. Nat. Genet. 2009;41:1350–1353. doi: 10.1038/ng.471. [DOI] [PMC free article] [PubMed] [Google Scholar]
- 42.Zhang Y., Rohde C., Tierling S., Jurkowski T.P., Bock C., Santacruz D., Ragozin S., Reinhardt R., Groth M., Walter J., Jeltsch A. DNA methylation analysis of chromosome 21 gene promoters at single base pair and single allele resolution. PLoS Genet. 2009;5:e1000438. doi: 10.1371/journal.pgen.1000438. [DOI] [PMC free article] [PubMed] [Google Scholar]
- 43.Laurent L., Wong E., Li G., Huynh T., Tsirigos A., Ong C.T., Low H.M., Kin Sung K.W., Rigoutsos I., Loring J., Wei C.L. Dynamic changes in the human methylome during differentiation. Genome Res. 2010;20:320–331. doi: 10.1101/gr.101907.109. [DOI] [PMC free article] [PubMed] [Google Scholar]
- 44.Ball M.P., Li J.B., Gao Y., Lee J.H., LeProust E.M., Park I.H., Xie B., Daley G.Q., Church G.M. Targeted and genome-scale strategies reveal gene-body methylation signatures in human cells. Nat. Biotechnol. 2009;27:361–368. doi: 10.1038/nbt.1533. [DOI] [PMC free article] [PubMed] [Google Scholar]
- 45.Jjingo D., Conley A.B., Yi S.V., Lunyak V.V., Jordan I.K. On the presence and role of human gene-body DNA methylation. Oncotarget. 2012;3:462–474. doi: 10.18632/oncotarget.497. [DOI] [PMC free article] [PubMed] [Google Scholar]
- 46.Rada-Iglesias A., Ameur A., Kapranov P., Enroth S., Komorowski J., Gingeras T.R., Wadelius C. Whole-genome maps of USF1 and USF2 binding and histone H3 acetylation reveal new aspects of promoter structure and candidate genes for common human disorders. Genome Res. 2008;18:380–392. doi: 10.1101/gr.6880908. [DOI] [PMC free article] [PubMed] [Google Scholar]
- 47.Shoulders C.C., Naoumova R.P. USF1 implicated in the aetiology of familial combined hyperlipidaemia and the metabolic syndrome. Trends Mol. Med. 2004;10:362–365. doi: 10.1016/j.molmed.2004.06.011. [DOI] [PubMed] [Google Scholar]
- 48.Heintzman N.D., Hon G.C., Hawkins R.D., Kheradpour P., Stark A., Harp L.F., Ye Z., Lee L.K., Stuart R.K., Ching C.W. Histone modifications at human enhancers reflect global cell-type-specific gene expression. Nature. 2009;459:108–112. doi: 10.1038/nature07829. [DOI] [PMC free article] [PubMed] [Google Scholar]
- 49.Speliotes E.K., Willer C.J., Berndt S.I., Monda K.L., Thorleifsson G., Jackson A.U., Lango Allen H., Lindgren C.M., Luan J., Mägi R., MAGIC. Procardis Consortium Association analyses of 249,796 individuals reveal 18 new loci associated with body mass index. Nat. Genet. 2010;42:937–948. doi: 10.1038/ng.686. [DOI] [PMC free article] [PubMed] [Google Scholar]
- 50.Boyle A.P., Hong E.L., Hariharan M., Cheng Y., Schaub M.A., Kasowski M., Karczewski K.J., Park J., Hitz B.C., Weng S. Annotation of functional variation in personal genomes using RegulomeDB. Genome Res. 2012;22:1790–1797. doi: 10.1101/gr.137323.112. [DOI] [PMC free article] [PubMed] [Google Scholar]
- 51.ENCODE Project Consortium An integrated encyclopedia of DNA elements in the human genome. Nature. 2012;489:57–74. doi: 10.1038/nature11247. [DOI] [PMC free article] [PubMed] [Google Scholar]
- 52.Hurtado del Pozo C., Vesperinas-García G., Rubio M.A., Corripio-Sánchez R., Torres-García A.J., Obregon M.J., Calvo R.M. ChREBP expression in the liver, adipose tissue and differentiated preadipocytes in human obesity. Biochim. Biophys. Acta. 2011;1811:1194–1200. doi: 10.1016/j.bbalip.2011.07.016. [DOI] [PubMed] [Google Scholar]
- 53.Johansson J., Mannerås-Holm L., Shao R., Olsson A., Lönn M., Billig H., Stener-Victorin E. Electrical vs manual acupuncture stimulation in a rat model of polycystic ovary syndrome: different effects on muscle and fat tissue insulin signaling. PLoS ONE. 2013;8:e54357. doi: 10.1371/journal.pone.0054357. [DOI] [PMC free article] [PubMed] [Google Scholar]
- 54.Carninci P., Sandelin A., Lenhard B., Katayama S., Shimokawa K., Ponjavic J., Semple C.A., Taylor M.S., Engström P.G., Frith M.C. Genome-wide analysis of mammalian promoter architecture and evolution. Nat. Genet. 2006;38:626–635. doi: 10.1038/ng1789. [DOI] [PubMed] [Google Scholar]
- 55.Li Y., Zhu J., Tian G., Li N., Li Q., Ye M., Zheng H., Yu J., Wu H., Sun J. The DNA methylome of human peripheral blood mononuclear cells. PLoS Biol. 2010;8:e1000533. doi: 10.1371/journal.pbio.1000533. [DOI] [PMC free article] [PubMed] [Google Scholar]
- 56.Gordon L., Joo J.E., Powell J.E., Ollikainen M., Novakovic B., Li X., Andronikos R., Cruickshank M.N., Conneely K.N., Smith A.K. Neonatal DNA methylation profile in human twins is specified by a complex interplay between intrauterine environmental and genetic factors, subject to tissue-specific influence. Genome Res. 2012;22:1395–1406. doi: 10.1101/gr.136598.111. [DOI] [PMC free article] [PubMed] [Google Scholar]
- 57.Xie W., Barr C.L., Kim A., Yue F., Lee A.Y., Eubanks J., Dempster E.L., Ren B. Base-resolution analyses of sequence and parent-of-origin dependent DNA methylation in the mouse genome. Cell. 2012;148:816–831. doi: 10.1016/j.cell.2011.12.035. [DOI] [PMC free article] [PubMed] [Google Scholar]
- 58.Lister R., Pelizzola M., Dowen R.H., Hawkins R.D., Hon G., Tonti-Filippini J., Nery J.R., Lee L., Ye Z., Ngo Q.M. Human DNA methylomes at base resolution show widespread epigenomic differences. Nature. 2009;462:315–322. doi: 10.1038/nature08514. [DOI] [PMC free article] [PubMed] [Google Scholar]
- 59.Cedar H., Bergman Y. Linking DNA methylation and histone modification: patterns and paradigms. Nat. Rev. Genet. 2009;10:295–304. doi: 10.1038/nrg2540. [DOI] [PubMed] [Google Scholar]
- 60.Maurano M.T., Humbert R., Rynes E., Thurman R.E., Haugen E., Wang H., Reynolds A.P., Sandstrom R., Qu H., Brody J. Systematic localization of common disease-associated variation in regulatory DNA. Science. 2012;337:1190–1195. doi: 10.1126/science.1222794. [DOI] [PMC free article] [PubMed] [Google Scholar]
- 61.Ernst J., Kheradpour P., Mikkelsen T.S., Shoresh N., Ward L.D., Epstein C.B., Zhang X., Wang L., Issner R., Coyne M. Mapping and analysis of chromatin state dynamics in nine human cell types. Nature. 2011;473:43–49. doi: 10.1038/nature09906. [DOI] [PMC free article] [PubMed] [Google Scholar]
Associated Data
This section collects any data citations, data availability statements, or supplementary materials included in this article.