

Abstract
The purpose of the present study was to estimate the relative contributions of degradation and brain-to-blood elimination processes to the clearance of microinjected human amyloid-β peptide(1-40) (hAβ(1-40)) from mouse cerebral cortex, using a solid-phase extraction method together with a newly developed ultraperformance liquid chromatography/tandem mass spectrometry (UPLC/MS/MS) quantitation method for intact hAβ(1-40). The clearance rate constant of hAβ(1-40) in mouse cerebral cortex was determined to be 3.21 × 10⁻²/min under conditions where the saturable brain-to-blood elimination process across the blood–brain barrier (BBB) was expected to be saturated. Thus, this clearance rate constant should mainly reflect degradation. The [125I]hAβ(1-40) elimination rate across the BBB under nonsaturating conditions was determined to be 1.48 × 10⁻²/min. Inhibition studies suggested that processes sensitive to insulin and phosphoramidon, which inhibit neprilysin, insulin-degrading enzyme, and endothelin-converting enzyme, are involved not only in degradation, but also in elimination of hAβ(1-40). In conclusion, our results suggest a dominant contribution of degradation to cerebral hAβ(1-40) clearance, and also indicate that a sequential process of degradation and elimination of degradation products is involved in cerebral hAβ(1-40) clearance.
Keywords: amyloid-β peptide, Aβ-degrading enzyme, Alzheimer's disease, blood–brain barrier, efflux transport
Introduction
The accumulation of amyloid-β peptide (Aβ) in extracellular space is thought to trigger Aβ aggregation and deposition, which contribute to development of Alzheimer's disease (AD).1, 2 Amyloid-β peptide is normally produced and cleared at the same rate in human brain.3 In late-onset AD (99% of cases), the clearance rate of Aβ from brain is lower than that in non-AD brains, but there is no significant difference in Aβ production rate.4 Thus, impaired clearance of soluble Aβ could be the major cause of elevated levels of Aβ, ultimately leading to deposition of Aβ aggregates in the brain.5 Cerebral clearance of soluble Aβ involves both degradation in the brain6, 7, 8 and brain-to-blood elimination across the blood–brain barrier (BBB).9, 10 The relative contributions of these processes are poorly understood, though this information would be important to understand in detail the pathogenesis of AD, and also to develop treatments.
Therefore, the aim of the present study was to evaluate the degradation and brain-to-blood elimination rate constants of human Aβ (hAβ)(1-40) from mouse brain by using a newly developed ultraperformance liquid chromatography/tandem mass spectrometry (UPLC/MS/MS) method for quantitation of intact hAβ(1-40) after microinjection of hAβ(1-40), and thus to estimate separately the contributions of the two processes to cerebral Aβ clearance in mouse. The elimination rate of hAβ(1-40) from the rodent cerebral cortex has been determined from the time course of 125I radioactivity remaining in the ipsilateral cerebrum.10, 11 However, intact and degraded hAβ(1-40) cannot be distinguished by measuring radioactivity. The degradation of Aβ(1-40) has also been examined by using labeled hAβ(1-40) or knockout mice.6, 7, 8, 9, 10 However, to separate the contributions of degradation or elimination to cerebral clearance of hAβ(1-40), it is necessary to quantify both the radiolabel and intact hAβ(1-40).
For quantification of intact hAβ(1-40), enzyme-linked immunosorbent assay has been widely used. However, enzyme-linked immunosorbent assay results can be influenced by crossreactivity of Aβ antibody, the presence of Aβ binding protein, and/or nonspecific binding of compounds in brain extract.12 However, quantification by means of liquid chromatography/tandem mass spectrometry (LC/MS/MS) with selected/multiple reaction monitoring (SRM/MRM) has the advantages of high selectivity and reliability.13 Therefore, for the present work we used a solid-phase extraction (SPE) procedure to concentrate Aβ from brain extract without anti-Aβ antibody treatment,14 followed by quantitation of intact hAβ(1-40) with a newly developed UPLC/MS/MS method. The combination of this approach with radioactivity measurements allowed us to estimate separately the contributions of degradation and elimination to cerebral Aβ clearance in our experimental model.
Materials and methods
Animals
Male C57BL/6J mice (8 to 10 weeks old) were purchased from Japan SLC (Hamamatsu, Japan). The protocol was approved by the Institutional Animal Care and Use Committee at Tohoku University (Sendai, Japan). The investigation using animals described in this report conformed to the guidelines of the Animal Care Committee, Graduate School of Pharmaceutical Sciences, Tohoku University.
Reagents
Human amyloid-β peptide(1-40) was purchased from Bachem AG (Bubendorf, Switzerland) and Peptide Institute (Osaka, Japan). [15N]-labeled hAβ(1-40) ([15N]hAβ(1-40)) was obtained from rPeptide (Bogart, GA, USA). FITC-labeled inulin (FITC-inulin) was purchased from Sigma (St. Louis, MO, USA). Monoiodinated and nonoxidized [125I]-labeled hAβ(1-40) ([125I]hAβ(1-40)) was prepared from hAβ(1-40) (Biosource, Camarillo, CA, USA) by Perkin-Elmer Life Sciences (Boston, MA, USA) (2,200 Ci/mmol). [3H]Dextran (100 mCi/mg) was obtained from American Radiolabeled Chemicals, Inc. (St Louis, MO, USA). Insulin was purchased from Sigma. Thiorphan was obtained from Wako Pure Chemicals (Osaka, Japan). Phosphoramidon and human insulin were purchased from Peptide Institute. Xylazine hydrochloride was purchased from Sigma. Ketaral 50 (ketamine hydrochloride) was obtained from Sankyo Co. (Tokyo, Japan). All other chemicals were analytical-grade commercial products.
Preparation of Unlabeled Human Amyloid-β Peptide(1-40) and [15N]-Labeled Human Amyloid-β Peptide(1-40)
Unlabeled hAβ(1-40) and [15N]hAβ(1-40) were dissolved in 1,1,1,3,3,3-hexafluoro-2-propanol (HFIP; Kanto Chemical, Tokyo, Japan) at a concentration of 1 mg/mL and stored at 4°C. The amounts of hAβ(1-40) and [15N]hAβ(1-40) in HFIP solution were determined by amino-acid sequence analysis as described previously.15 Unlabeled hAβ(1-40) peptide was dried and then dissolved in distilled water or 0.1% ammonium hydroxide containing 20% acetonitrile before use.
Mass Spectrometric Analysis of Unlabeled Human Amyloid-β Peptide(1-40) and [15N]-Labeled Human Amyloid-β Peptide
Unlabeled hAβ(1-40) and [15N]hAβ(1-40) were detected by following a specific m/z transition from a precursor peptide ion in Q1 to a product peptide ion in Q3 (SRM/MRM transition). A solution of hAβ(1-40) in 0.1% ammonium hydroxide containing 20% acetonitrile (1 μmol/L) was injected into the MS/MS (API5000; Applied Biosystems, Foster City, CA, USA) at 5 μL/min to optimize MS/MS SRM/MRM conditions in the negative ion mode (Table 1).
Table 1. SRM/MRM channels and parameters of unlabeled and 15N-labeled hAβ(1-40).
| Target | Peptide sequence | Charge |
SRM/MRM transition (m/z) |
|||||
|---|---|---|---|---|---|---|---|---|
| Q1 | Q3 | DP | CE | EP | CXP | |||
| hAβ(1-40) | DAEFRHDSGYEVHHQKLVFF- | −5 | 864.7 | 861.3 | −140 | −10 | −30 | −31 |
| AEDVGSNKGAIIGLMVGGVV | −4 | 1,081.3 | 1,076.9 | −190 | −10 | −40 | −27 | |
| [15N]hAβ(1-40) | [15N]DAEFRHDSGYEVHHQKLVFF- | −5 | 875.3 | 871.5 | −140 | −10 | −30 | −31 |
| AEDVGSNKGAIIGLMVGGVV | −4 | 1,094.4 | 1,090.0 | −190 | −10 | −40 | −27 | |
CE, collision energy; CXP, collision cell exit potential; DP, declistering potential; EP, entrance potential; hAβ(1-40), human amyloid-β peptide(1-40); SRM/MRM, selected/multiple reaction monitoring.
Preparation of Standard Solutions
For preparing the calibration curves, unlabeled hAβ(1-40) was diluted in 1.5 mL tubes with 200 μL of 0.1% ammonium hydroxide containing 20% acetonitrile by serial dilution of hAβ(1-40) (0, 20, 40, 200, 400, 2,000, and 4,000 fmol) spiked into 1 pmol of [15N]hAβ(1-40) as an internal standard. Aliquots of 50 μL of these solutions (0, 5, 10, 50, 100, 500, and 1,000 fmol standard/250 fmol internal standard) were injected into the column.
Quantification of Human Amyloid-β Peptide(1-40) by Ultraperformance Liquid Chromatography/Tandem Mass Spectrometry
Human amyloid-β peptide(1-40) and [15N]hAβ(1-40) were analyzed with a UPLC system (Waters ACQUITY UPLC system, Waters Co., Milford, MA, USA) connected to an ESI-triple quadrupole mass spectrometer (API5000; Applied Biosystems). hAβ(1-40) solution was injected into a reversed-phase UPLC column (ACQUITY UPLC BEH C18 column 1.7 μm, 2.1 mm ID × 50 mm, Waters) with the column oven set at 25°C. Mobile phase A consisted of 0.1% ammonium hydroxide and mobile phase B consisted of 0.1% ammonium hydroxide containing 20% acetonitrile. The peptides were separated and eluted from the column using the following gradient system: 0 to 2 minutes 15% B, 2 to 7 minutes 15–30% B, 7.0 to 7.01 minutes 30–60% B, 7.01 to 9 minutes 60% B, 9.0 to 9.01 minutes 60 to 15% B, 9.01 to 14 minutes 15% B at a flow rate of 0.5 mL/min. Samples dissolved in 0.1% ammonium hydroxide containing 20% acetonitrile were added to the sample tray held at 4°C, and 50 μL aliquots of the samples were injected into the column with an auto sampler. To prevent carry-over, 50 μL of 0.1% ammonium hydroxide containing 20% acetonitrile was injected between sample injections. The MS was set up to run an SRM/MRM experiment for detection of each hAβ(1-40) (Table 1). The ion counts in the chromatograms were determined by using the quantitation procedures in Analyst software version 1.4.2 (Applied Biosystems). Human amyloid-β peptide was quantified by calculating the ratios of peak areas to those of isotope-labeled peptides, as described previously.15
Extraction of Human Amyloid-β Peptide(1-40) from Mouse Brain
[15N]hAβ(1-40) (1 pmol) was spiked into samples as an internal standard just before homogenization. Mouse brains were homogenized in nine volumes of 6 mol/L guanidinium hydrochloride (GuHCl) solution in a tissue homogenizer (Model PT1300D; Kinematica AG, Littau, Switzerland) and incubated for 3 hours on ice. Samples were ultracentrifuged at 100,000 g for 60 minutes at 4°C with a TLA-55 rotor using an Optima MAX-E ultracentrifuge (Beckman, Fullerton, CA, USA) and the supernatants were collected in new 1.5 mL tubes. Unlabeled hAβ(1-40) and [15N]hAβ(1-40) were extracted from the supernatant of mouse brain homogenate by SPE as described previously, with minor modifications.12 An Oasis HLB 1 mL (30 mg) extraction cartridge (Waters) was placed on a vacuum manifold and equilibrated using 1 mL of water followed by 1 mL of methanol. Samples were passed through the prepared SPE cartridges at 1 mL/min. To reduce sample loss, 200 μL of 6 M GuHCl solution was added to the sample tubes and these solutions were passed over the prepared SPE cartridges at 1 mL/min again. The SPE cartridges were then washed sequentially with 1 mL of 10% and 30% methanol, and then eluted with 1 mL of 2% NH4OH in 90% MeOH. Eluted samples were dried in a centrifuge concentrator (Tomy Seiko Co., Ltd., Tokyo, Japan). Once samples had been dried completely, they were stored at −80°C until assay. The dried samples were resuspended in 200 μL of 0.1% ammonium hydroxide containing 20% acetronitrile, and these samples (50 μL) were analyzed by UPLC/MS/MS as described above.
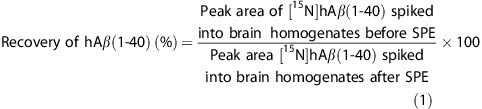
Recovery of hAβ(1-40) from mouse brain homogenates was determined according to equation 1;
 |
Measurement of FITC-Inulin in Mouse Brain
The supernatants of mouse brain homogenate were 10-fold diluted with 500 mmol/L HEPES (pH 7.4), because pH significantly affects the fluorescence of FITC.16 The duplicate samples were then loaded onto a 96-well plate (100 μL sample/well). The standard solution was diluted with mouse brain homogenate without microinjection of FITC-inulin. Fluorescence was determined using a Fluoroscan Ascent FL (FIN-00811; Labsystems, Helsinki, Finland) with excitation at 485 nm and emission at 538 nm. Recovery of inulin in the supernatant of mouse brain homogenate after microinjection was 96.5±0.5% (n=4, data not shown), as determined by 14C-radioactivity measurement of [14C]inulin in the supernatant and pellet of brain homogenate.
Brain Efflux Index Method
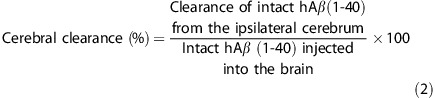
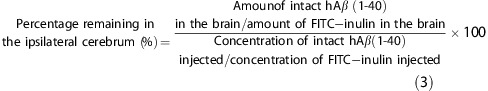
The in vivo brain elimination experiments were performed using the intracerebral microinjection technique previously reported.11 Briefly, mice were anesthetized with an intramuscular injection of xylazine (1.22 mg/kg) and ketamine (125 mg/kg), and placed in a stereotaxic frame (SRS-6; Narishige, Tokyo, Japan) that determines the coordinates of the mouse brain coinciding with the secondary somatosensory cortex (S2) region. A small hole was made 3.8 mm lateral to the bregma, and a fine injection needle fitted on a 5.0 μl microsyringe (Hamilton, Reno, NE, USA) was advanced to a depth of 2.5 mm. The applied solution (0.30 μl) containing hAβ(1-40) and FITC-inulin or [125I]hAβ(1-40) and [3H]dextran in an extracellular fluid (ECF) buffer (122 mmol/L NaCl, 25 mmol/L NaHCO3, 3 mmol/L KCl, 1.4 mmol/L CaCl2, 1.2 mmol/L MgSO4, 0.4 mmol/L K2HPO4, 10 mmol/L D-glucose, and 10 mmol/L HEPES, pH 7.4) was administered into the S2 region over a period of 30 seconds. After microinjection, the microsyringe was left in place for 4 minutes to minimize any backflow. At designated times after microinjection, the ipsilateral (left) and contralateral (right) cerebrum and cerebellum were excised. For measurement of intact hAβ(1-40) and FITC-inulin by UPLC/MS/MS analysis and fluorescence spectrometry, the brain and applied solution (0.30 μl) were snap frozen in liquid nitrogen. The amounts of intact hAβ(1-40) and FITC-inulin in mouse brain were measured as described above. For measurement of 125I and 3H radioactivity, brains were dissolved in 2.0 mL 2 M NaOH at 60°C for 1 hour. The 125I and 3H radioactivity of the samples were measured in a γ-counter (ART300, Aloka, Tokyo, Japan) for 3 minutes and a liquid scintillation counter (TRI-CARB2050CA, Packard Instruments, Meriden, CT, USA) for 5 minutes, respectively. We previously showed that no significant radioactivity was found in the contralateral cerebrum, cerebellum, or CSF at 60 minutes after microinjection of [125I]hAβ(1-40),11 indicating that [125I]hAβ(1-40) did not diffuse to these regions from the injected hemisphere. In that study, the amount of microinjected [3H]dextran, a BBB-impermeable compound, was not significantly changed after microinjection,11 indicating that the BBB remained intact during the Brain Efflux Index (BEI) study. The cerebral clearance was defined according to equation 2, and the percentage of intact hAβ(1-40) remaining in the ipsilateral cerebrum was determined using equation 3:
 |
 |
The clearance rate constant, reflecting both degradation in the brain and elimination across the BBB, was determined from the slope obtained by fitting a semilogarithmic plot of remaining percentage of intact hAβ(1-40) in the ipsilateral cerebrum versus time, using the nonlinear least-squares regression analysis program MULTI.17
To characterize the clearance system in the brain, the clearance rate constant calculated from the slope of the profile of percentage remaining in the ipsilateral cerebrum at 5 and 30 minutes was determined in the presence or absence of several inhibitors.
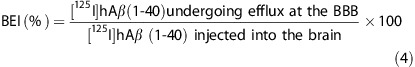
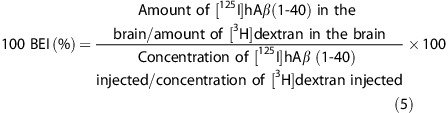
The BEI was defined according to equation 4, and the percentage of substrate remaining in the ipsilateral cerebrum (100-BEI) was determined using equation 5:
 |
 |
The apparent brain-to-blood elimination rate constant across the BBB was determined from the slope obtained by fitting a semilogarithmic plot of (100-BEI) versus time, using the nonlinear least-squares regression analysis program MULTI.17
To characterize the efflux transport system at the BBB, the elimination rate constant across the BBB calculated from the slope of the profile of (100-BEI (%)) at 5 and 30 minutes was determined in the presence or absence of several inhibitors.
Data Analysis
Unless otherwise indicated, all data represent the mean±s.e.m. One-way analysis of variance followed by Dunnett's test was used to assess the statistical significance of differences among the means of more than two groups.
Results
Quantification of Human Amyloid-β Peptide(1-40) by Liquid Chromatography/Tandem Mass Spectrometry with Selected/Multiple Reaction monitoring
Full scanning analyses were performed in the range of m/z 600 to 1,200 for hAβ(1-40) and [15N]hAβ(1-40) and two product ions were selected for SRM/MRM analysis (−5 ion transition and −4 ion transition). Mixtures of different amounts of hAβ(1-40) (5, 10, 50, 100, 500, and 1,000 fmol) and 250 fmol of [15N]hAβ(1-40), used as an internal standard, were measured under optimal conditions using the two SRM/MRM transitions. Calibration curves showed linear regression lines in the range of 5 to 1,000 fmol for hAβ(1-40) (R2=0.999 for the −5 ion transition and 0.996 for the −4 ion transition) (Figure 1A). There was no significant difference in peak area ratio determined using the two different SRM/MRM transitions (R2=0.999; Figure 1B). The limit of detection of hAβ(1-40) was 1.42 fmol for the −5 ion transition and 3.24 fmol for the −4 ion transition. To improve reliability, the amount of hAβ(1-40) was determined from the values of both SRM/MRM transitions.
Figure 1.

Linearity of calibration curves for human amyloid-β peptide(1-40) (hAβ(1-40)) by ultraperformance liquid chromatography/tandem mass spectrometry (UPLC/MS/MS). (A) Calibration curve for hAβ(1-40) by UPLC/MS/MS. Mixtures of hAβ(1-40) (5, 10, 50, 100, 500, or 1,000 fmol) and [15N]hAβ(1-40) (250 fmol) dissolved in 50 μL of 0.1% ammonium hydroxide containing 20% acetronitrile were injected directly into the UPLC/MS/MS and two product ions of each hAβ(1-40) were measured by selected/multiple reaction monitoring (SRM/MRM) analysis (−5 ion transition and −4 ion transition). Peak area ratios were calculated from the peak areas of hAβ(1-40) and [15N]hAβ(1-40) (unlabeled/labeled). Each point represents the mean±s.e.m. (n=3). (B) Comparison of calibration curves of the two product ions of each hAβ(1-40) generated by SRM/MRM analysis. Each point represents the mean±s.e.m. (n=3).
Before homogenizing brain tissue, a fixed amount of [15N]hAβ(1-40) was spiked into each sample as an internal standard, and loss of hAβ(1-40) during sample preparation, including SPE, was compensated by determining the peak area ratio of hAβ(1-40) to [15N]hAβ(1-40). Nevertheless, a low recovery of hAβ(1-40) might still result in inaccuracy of quantification. Therefore, the recovery rate of hAβ(1-40) was determined by comparing the amounts of [15N]hAβ(1-40) in two samples: one in which [15N]hAβ(1-40) was added before brain homogenization and one in which it was added after SPE. The recovery rate of [15N]hAβ(1-40) determined from 116 measurements (n=58 each for −5 ion transition and −4 ion transition) was 74.2±1.2%. This suggested that recovery of hAβ(1-40) from mouse brain in the procedure with SPE was sufficient.
Detection of Human Amyloid-β Peptide(1-40) in Mouse Brain After Microinjection
Human amyloid-β peptide(1-40) (5 μmol/L) was microinjected into the S2 region of mouse brain, and the remaining amount was measured at 30 minutes after microinjection by means of UPLC/MS/MS analysis. The peaks of hAβ(1-40) and [15N]hAβ(1-40) were detected at same retention time using either the −5 or −4 ion transition (Figures 2A and 2B). In contrast, no significant peak of hAβ(1-40) or [15N]hAβ(1-40) was observed in mouse brain in the absence of microinjection (Figures 2C and 2D). There was a high peak at the retention time of 7.5 minutes in all measured samples in either the −5 or −4 ion transition, and this appears to be a nonspecific peak derived from the mouse brain. The peak area ratio of the −5 ion to −4 ion of [15N]hAβ(1-40) from brain (0.953; Figures 2A and 2B) was decreased compared with that in the calibration curve sample (1.53; Figures 2E and 2F). This is presumably due to a greater ion suppression effect of the more highly charged ion, although the ratio of hAβ(1-40) to [15N]hAβ(1-40) was not different in the two cases.
Figure 2.

Detection of human amyloid-β peptide(1-40) (hAβ(1-40)) in mouse brain after microinjection. In all figures, chromatograms of hAβ(1-40) and [15N]hAβ(1-40) (internal standard) are indicated by blue and red lines, respectively. The peaks of hAβ(1-40) and [15N]hAβ(1-40) are indicated by red arrows. (A, B) A mixture of hAβ(1-40) (1.5 pmol) and FITC-inulin (9 μg) dissolved in 0.30 μL of extracellular fluid (ECF) buffer was microinjected into the S2 region of mouse brain. Five minutes after microinjection, whole mouse brain was removed and the microinjected region of the ipsilateral cerebrum was isolated. The brain tissue sample was homogenized in 6 mol/L guanidinium hydrochloride (GuHCl) solution after addition of [15N]hAβ(1-40) (1 pmol) and then ultracentrifuged. The supernatant was passed through an HLB column, dried, and resuspended in 0.1% ammonium hydroxide containing 20% acetonitrile. Two product ions of hAβ(1-40) (blue line) and [15N]hAβ(1-40) (red line) were measured by selected/multiple reaction monitoring (SRM/MRM) analysis (−4 ion transition (A) and −5 ion transition (B)) for each hAβ(1-40). (C, D) Mouse brain without microinjection of a mixture of hAβ(1-40) and FITC-inulin in ECF buffer was homogenized in 6 mol/L GuHCl solution without addition of [15N]hAβ(1-40) and then ultracentrifuged. The supernatant was passed through an HLB column, dried, and resuspended in 0.1% ammonium hydroxide containing 20% acetonitrile. Two product ions of hAβ(1-40) (blue line) and [15N]hAβ(1-40) (red line) were measured by SRM/MRM analysis (−4 ion transition (C) and −5 ion transition (D)). (E, F) The mixture of hAβ(1-40) (100 fmol, blue line) and [15N]hAβ(1-40) (250 fmol, red line) was subjected to SRM/MRM analysis (−4 ion transition (E) and −5 ion transition (F)) for the calibration curve.
Clearance of Intact Human Amyloid-β Peptide(1-40) from Mouse Brain
Clearance of intact hAβ(1-40) from mouse brain was investigated by quantifying intact hAβ(1-40) remaining in the brain after microinjection. Figure 3 shows the time profile of the percentage of intact hAβ(1-40) remaining in the ipsilateral cerebrum after microinjection of 5 μmol/L hAβ(1-40) into the S2 region of mouse brain. Remaining intact hAβ(1-40) decreased in a time-dependent manner, and the clearance rate constant was determined to be 3.21 × 10⁻²±0.42 × 10⁻²/min (mean±s.d.).
Figure 3.

Time course of intact human amyloid-β peptide(1-40) (hAβ(1-40)) remaining in the ipsilateral cerebrum after intracerebral microinjection. A mixture of hAβ(1-40) (1.5 pmol) and FITC-inulin (9 μg) dissolved in 0.30 μL of extracellular fluid (ECF) buffer was injected into the S2 region of mouse brain. After the indicated times, the amounts of hAβ(1-40) and FITC-inulin in mouse brain were measured as described in Materials and methods. The solid line was obtained with the nonlinear least-squares regression analysis program, MULTI. Each point represents the mean±s.e.m. (n=4 to 11).
Inhibitory Effect of Amyloid-β Peptide-Degrading Enzyme Inhibitors on Clearance of Intact Human Amyloid-β Peptide(1-40) in Mouse Brain
To investigate the contribution of degradation processes to hAβ(1-40) clearance, the effects of various enzyme inhibitors on the clearance of intact hAβ(1-40) in mouse brain were examined (Table 2). A mixture of insulin (100 μg/mL) and phosphoramidon (10 mmol/L), which inhibit neprilysin (NEP), insulin-degrading enzyme (IDE) and endothelin-converting enzyme, markedly suppressed the clearance of intact hAβ(1-40) by 94.6%. Thiorphan (1 mmol/L), a selective inhibitor of NEP, and insulin (100 μg/mL) significantly inhibited intact hAβ(1-40) clearance by 85.7% and 54.8%, respectively.
Table 2. Effects of inhibitors of Aβ-degrading enzymes on hAβ(1-40) clearance from mouse brain, obtained from measurements of intact hAβ(1-40).
| Inhibitor | Clearance rate constant (1/min) | % Of control |
|---|---|---|
| Control | 3.25 × 10⁻²±0.46 × 10⁻² | 100 |
| 100 μg/mL insulin +10 mmol/L phosphoramidon | 0.180 × 10⁻²±0.51 × 10⁻² | 5.42*** |
| 100 μg/mL insulin | 1.47 × 10⁻²±0.34 × 10⁻² | 45.2** |
| 1 mmol/L thiorphan | 0.499 × 10⁻²±0.467 × 10⁻² | 15.4*** |
BEI, Brain Efflux Index; ECF, extracellular fluid; hAβ(1-40), human amyloid-β peptide(1-40).
A mixture of hAβ(1-40) (1.5 pmol) and FITC-inulin (9 μg) dissolved in 0.30 μL of ECF buffer was injected into the S2 region of mouse brain in the presence or absence of inhibitors. The clearance rate constant was calculated from the slope of the profile of (100-BEI (%)) at 5 and 30 minutes (each point n=3 to 4).
Each value represents the mean±s.d..
**P<0.01, ***P<0.001, significantly different from control.
Inhibitory Effect of Amyloid-β Peptide-Degrading Enzyme Inhibitors on Brain-to-Blood Elimination of 125I Radioactivity from Mouse Brain After [125I]-Labeled Human Amyloid-β Peptide(1-40) Injection
The inhibitory effects of the same inhibitors were examined on elimination of 125I radioactivity from the mouse brain across the BBB after microinjection of [125I]hAβ(1-40). 125I radioactivity was cleared from mouse brain with an elimination rate constant of 1.48 × 10⁻²±0.17 × 10⁻²/min (mean±s.d., Table 3); this represents brain-to-blood elimination of intact and/or degraded [125I]hAβ(1-40) from the brain to blood across the BBB. Coadministration of a mixture of insulin (100 μg/mL) and phosphoramidon (10 mmol/L), thiorphan (1 mmol/L), and insulin (100 μg/mL) significantly inhibited the elimination of 125I radioactivity and the elimination rate constants were decreased by 97.8%, 35.7%, and 41.4%, respectively (Table 3).
Table 3. Effects of inhibitors for Aβ-degrading enzymes on the elimination of 125I radioactivity from mouse brain after microinjection of [125I]hAβ(1-40).
| Inhibitor | Elimination rate constant (1/min) | % of control |
|---|---|---|
| Control | 1.48 × 10⁻²±0.17 × 10⁻² | 100 |
| 100 μg/mL insulin +10 mmol/L phosphoramidon | 0.03 × 10⁻²±0.27 × 10⁻² | 2.17*** |
| 100 μg/mL Insulin | 0.86 × 10⁻²±0.23 × 10⁻² | 58.6** |
| 1 mmol/L thiorphan | 0.95 × 10⁻²±0.28 × 10⁻² | 64.3* |
BEI, Brain Efflux Index; ECF, extracellular fluid; hAβ(1-40), human amyloid-β peptide(1-40).
A mixture of [125I]hAβ(1-40) (0.012 μCi, 18.2 nmol/L) and [3H]dextran (0.12 μCi) dissolved in 0.30 μL of ECF buffer was injected into the S2 region of mouse brain in the presence or absence of inhibitors. The elimination rate constant was calculated from slope of the profile of (100-BEI (%)) at 5 and 30 minutes (each point n=4).
*P<0.05, **P<0.01, ***P<0.001, significantly different from control.
Discussion
In the present study, we developed a new quantitation method for intact hAβ(1-40) in mouse brain by means of SPE followed by UPLC/MS/MS (Figures 1 and 2). Since hAβ(1-40) is identified in terms of LC retention time and molecular mass, with stable isotope-labeled [15N]hAβ(1-40) as an internal standard, UPLC/MS/MS quantification affords higher specificity than antibody-based quantification. Although the sensitivity of the present UPLC/MS/MS quantification of hAβ(1-40) is at least 10-fold lower than that of commercial enzyme-linked immunosorbent assay, the SPE step can concentrate hAβ(1-40) from large volumes of biologic samples. Human amyloid-β peptide(1-42) was previously reported to be recovered by the same SPE method12 and quantified by LC/MS/MS followed by immunoprecipitation.13 Therefore, it seems likely that various derivatives of hAβ can be quantified by UPLC/MS/MS with high specificity, provided that they can be recovered by SPE.
Using the developed method, the clearance rate constant of intact hAβ(1-40) (5 μmol/L) in mouse brain was determined to be 3.21 × 10⁻²/min (Figure 3). The clearance of intact hAβ(1-40) reflects both degradation by proteases and brain-to-blood elimination by efflux transport at the BBB. We previously reported that the Km value of [125I]hAβ(1-40) elimination across the rat BBB was 247 nmol/L (injectate concentration).10 The elimination rate constant in rat was 1.42 × 10⁻²/min, and 28.5% of the elimination was estimated to be due to a nonsaturable (or low affinity) component.10 A self-inhibition study showed that 20 μmol/L hAβ(1-40) decreased the elimination rate constant across the BBB to 28.9%.10 Similarly, in the mouse study, the elimination rate constant across the BBB was 1.48 × 10⁻²/min (Table 3), and 20 μmol/L hAβ(1-40) decreased the elimination rate constant to 37.5%.11 Therefore, it appears that the Km value of [125I]hAβ(1-40) elimination across the BBB in mouse is similar to that in rat. If this is the case, then the concentration of microinjected hAβ(1-40) (5 μmol/L) was 20.2-fold greater than the Km value. Therefore, we can assume that the saturable component of hAβ(1-40) elimination from mouse brain across the BBB was saturated. Accordingly, the elimination rate constant across the BBB can be estimated to be 0.560 × 10⁻²/min when 5 μmol/L hAβ(1-40) was microinjected, as shown in Table 2 (see Supplementary Information for detailed calculations).
The Km values of NEP, IDE, and endothelin-converting enzyme for hAβ(1-40) have been reported to be in the micromolar range,18, 19, 20 being much greater than the estimated hAβ(1-40) concentration in the injected area, and this suggests that the Aβ degradation process was not saturated. Taking these findings into consideration, the clearance and elimination rate constants across the BBB determined in this study are summarized in Figure 4. From the observation that Aβ-degrading enzyme inhibitors inhibited [125I]hAβ(1-40) elimination across the BBB (Table 3) and our previous finding that both intact and degraded [125I]hAβ(1-40) were detected in plasma at 5 minutes after microinjection into rat cerebral cortex,10 two different brain-to-blood elimination pathways appear to operate; one is the elimination of intact hAβ(1-40), and the other is the elimination of degradation products of hAβ(1-40). The elimination rate constant of intact hAβ(1-40) across the BBB was estimated to be less than 0.560 × 10⁻²/min from the UPLC/MS/MS study (Figure 4A). The degradation rate constant of intact hAβ(1-40) was estimated to be at least 2.69 × 10⁻²/min (3.25 × 10⁻²–0.560 × 10⁻²/min), which is at least 1.8-fold greater than the apparent elimination rate constant of hAβ(1-40) across the BBB (Figures 4A and 4B). On the basis of these calculations, it appears that degradation has a dominant role in cerebral clearance of hAβ(1-40).
Figure 4.

Schematic representations of analysis of cerebral human amyloid-β peptide(1-40) (hAβ(1-40)) clearance by ultraperformance liquid chromatography/tandem mass spectrometry (UPLC/MS/MS) and radioisotope methods. (A) UPLC/MS/MS-based analysis of cerebral hAβ(1-40) clearance. UPLC/MS/MS measures the amount of intact hAβ(1-40) in the brain (yellow box), which includes the brain parenchyma and brain capillary endothelial cells (BCEC). The determined clearance rate constant represents both degradation of intact hAβ(1-40) and brain-to-blood elimination of intact hAβ(1-40) across the blood–brain barrier (BBB) (red arrows). The elimination rate constants of intact and degraded hAβ(1-40) were estimated as described in Discussion and Supplementary Information. (B) Radioisotope-based analysis of brain-to-blood [125I]hAβ(1-40) elimination across the BBB, which measures [125I] radioactivity in the brain (yellow box), including the brain parenchyma and BCEC. The determined elimination rate constant represents brain-to-blood elimination of both intact and degraded hAβ(1-40) across the BBB (blue arrows). Insulin inhibited [125I]hAβ(1-40) uptake into cultured immortalized mouse BCEC, and the possible inhibitory effect in vivo is indicated by dashed lines. NEP, neprilysin; IDE, insulin-degrading enzyme; ECE, endothelin-converting enzyme.
The clearance of hAβ(1-40) was almost completely inhibited by insulin and phosphoramidon (Table 2), indicating that hAβ(1-40) was degraded mainly via insulin- or phosphoramidon-sensitive pathways, which include the reactions catalyzed by IDE, NEP, and endothelin-converting enzyme. The inhibitory effects of insulin alone and thiorphan alone suggest that insulin- and thiorphan-sensitive degradation processes account for at least 54.8% and 84.6% of hAβ(1-40) degradation in the brain (Table 2). It was reported that microinjection of thiorphan (1 mmol/L) and phosphoramidon (10 mmol/L) into rat hippocampus markedly inhibited degradation of radiolabeled hAβ(1-42).21 The Km value of insulin for IDE is 25 nmol/L,22 which is ∼23-fold lower than the estimated insulin concentration at the injection site (568 nmol/L). Thus, these inhibitors appear to be present at sufficiently high concentrations to inhibit Aβ degradation in the brain. The roles of NEP and IDE in Aβ accumulation in mouse brain have been investigated using the corresponding gene-deficient mice.7, 8 In NEP-deficient mouse brain, endogenous Aβ(1-40) was increased by ∼2-fold compared with wild-type mice.8 In IDE-deficient mouse brain, endogenous Aβ(1-40) was increased by ∼1.2- to 1.6-fold compared with wild-type mice.7, 23 The greater effect of NEP is consistent with the contribution of each protease suggested by the present study (Table 2). Furthermore, when the percentage contributions of IDE and NEP to the degradation were added, the total was greater than 100%, suggesting that some part of intact hAβ(1-40) is degraded by both IDE and NEP.
The elimination of [125I]hAβ(1-40) from the brain across the BBB was inhibited by thiorphan (Table 3). Thiorphan (10 μmol/L) did not inhibit the internalization of [125I]hAβ(1-40) into conditionally immortalized mouse brain capillary endothelial cells (TM-BBB4).24 This in vitro concentration was close to the estimated concentration of thiorphan at the injection site in vivo (33 μmol/L=1 mmol/L/30.3), since injectate was reported to be diluted at least 30.3-fold by diffusion in the brain.25 This result suggests that NEP-degraded [125I]hAβ(1-40) was partially eliminated from the brain by efflux transport at the BBB. The thiorphan-sensitive clearance rate constant was estimated to be 2.75 × 10⁻²/min (3.25 × 10⁻² (control)−0.499 × 10⁻²/min (+thiorphan); Table 2), and the thiorphan-sensitive elimination rate constant across the BBB was estimated to be 0.53 × 10⁻²/min (1.48 × 10⁻² (control)–0.95 × 10⁻²/min (+thiorphan); Table 3). On the basis of these rate constants, ∼19% of the [125I]hAβ(1-40) degradation products generated by NEP appears to be eliminated from the brain across the BBB on the assumption that thiorphan inhibited only the hAβ(1-40) degradation process. Since the elimination study using [125I]hAβ(1-40) covered the elimination of only degraded peptides containing 125I-labeled tyrosine, further study may be necessary to examine the elimination of degraded peptide(s) not containing labeled tyrosine and also to clarify the molecular mechanism of the elimination of hAβ(1-40) from the brain across the BBB.
Insulin also inhibited the elimination of [125I]hAβ(1-40) from the brain across the BBB. One possible explanation is that degradation products of [125I]hAβ(1-40) generated by IDE were partially eliminated from the brain by efflux transport at the BBB. However, insulin is also a ligand of various receptors, and the possibility that insulin inhibited the internalization of [125I]hAβ(1-40) into capillary endothelial cells cannot be excluded. Our previous report showed that low-density lipoprotein receptor-related protein 1 does not contribute to the elimination of [125I]hAβ(1-40) from mouse cerebral cortex, but unknown molecules, whose function may be insulin sensitive, have a role in the elimination.10, 11 Indeed, [125I]hAβ(1-40) internalization into TM-BBB4 cells was inhibited by insulin (100 μg/mL), but not by thiorphan (10 μmol/L) or phosphoramidon (100 μmol/L), supporting the idea that an insulin-sensitive internalization process is involved in the elimination of Aβ from the brain across the BBB.24
The present study examined the clearance of hAβ(1-40) in mouse brain. Neprilysin and IDE are expressed in human brain, and their activities are reduced age and region specifically.26, 27, 28 Postmortem studies indicate that NEP protein expression and activity were inversely associated with AD pathology.26, 27, 28, 29, 30, 31, 32, 33 Thus, it seems reasonable to assume that these proteins, especially NEP, are involved in Aβ(1-40) clearance in human brain. As for the brain-to-blood elimination process, our in vitro study showed that [125I]hAβ(1-40) internalization into mouse brain capillary endothelial cell line (TM-BBB4) was significantly inhibited by unlabeled mouse Aβ(1-40),24 suggesting that hAβ(1-40) and mouse Aβ(1-40) share the same molecular mechanism of internalization into mouse brain capillary endothelial cells. The molecule responsible for hAβ(1-40) elimination across the BBB remains unknown even in rodents. The available evidence suggests that cerebral hAβ(1-40) clearance in humans involves similar molecular mechanisms to those in rodents, at least in part. Although the in vivo experiments performed in the present study could not be performed in humans, several human BBB models have recently become available, such as D3 cells,34 TY08 cells,35 and human brain capillary endothelial cells derived from induced pluripotent stem cells.36 Further experiments using these human cells should help to establish the relevance of our mouse data to humans, as well as providing more details of the mechanisms of cerebral hAβ(1-40) degradation and elimination in human brain.
In conclusion, our present study suggests that both degradation and elimination are involved in the cerebral clearance of hAβ(1-40). Furthermore, an insulin- or thiorphan-sensitive process was involved in both degradation and elimination. A part of hAβ(1-40) was eliminated from the brain across the BBB via successive processes of degradation and elimination of the degradation product(s). It remains important to clarify the molecular mechanisms of this multistep clearance system to understand the pathophysiologic role of hAβ(1-40), and to identify potential therapeutic targets for AD.
Acknowledgments
The authors would like to thank Mr K Kawakami for valuable discussions.
The authors declare no conflict of interest.
Footnotes
Supplementary Information accompanies the paper on the Journal of Cerebral Blood Flow & Metabolism website (http://www.nature.com/jcbfm)
This study was supported in part by a Grant-in-Aid for Scientific Research on Priority Areas from the Ministry of Education, Culture, Sports, Science and Technology (MEXT), Japan, and the Industrial Technology Research Grant Program from New Energy and the Industrial Technology Development Organization (NEDO) of Japan.
Supplementary Material
References
- Haass C, Selkoe DJ. Soluble protein oligomers in neurodegeneration: lessons from the Alzheimer's amyloid beta-peptide. Nat Rev Mol Cell Biol. 2007;8:101–112. doi: 10.1038/nrm2101. [DOI] [PubMed] [Google Scholar]
- Tanzi RE, Bertram L. Twenty years of the Alzheimer's disease amyloid hypothesis: a genetic perspective. Cell. 2005;120:545–555. doi: 10.1016/j.cell.2005.02.008. [DOI] [PubMed] [Google Scholar]
- Bateman RJ, Munsell LY, Morris JC, Swarm R, Yarasheski KE, Holtzman DM. Human amyloid-beta synthesis and clearance rates as measured in cerebrospinal fluid in vivo. Nat Med. 2006;12:856–861. doi: 10.1038/nm1438. [DOI] [PMC free article] [PubMed] [Google Scholar]
- Mawuenyega KG, Sigurdson W, Ovod V, Munsell L, Kasten T, Morris JC, et al. Decreased clearance of CNS beta-amyloid in Alzheimer's disease. Science. 2010;330:1774. doi: 10.1126/science.1197623. [DOI] [PMC free article] [PubMed] [Google Scholar]
- Tanzi RE, Moir RD, Wagner SL. Clearance of Alzheimer's Abeta peptide: the many roads to perdition. Neuron. 2004;43:605–608. doi: 10.1016/j.neuron.2004.08.024. [DOI] [PubMed] [Google Scholar]
- Eckman EA, Watson M, Marlow L, Sambamurti K, Eckman CB. Alzheimer's disease beta-amyloid peptide is increased in mice deficient in endothelin-converting enzyme. J Biol Chem. 2003;278:2081–2084. doi: 10.1074/jbc.C200642200. [DOI] [PubMed] [Google Scholar]
- Farris W, Mansourian S, Chang Y, Lindsley L, Eckman EA, Frosch MP, et al. Insulin-degrading enzyme regulates the levels of insulin, amyloid beta-protein, and the beta-amyloid precursor protein intracellular domain in vivo. Proc Natl Acad Sci USA. 2003;100:4162–4167. doi: 10.1073/pnas.0230450100. [DOI] [PMC free article] [PubMed] [Google Scholar]
- Iwata N, Tsubuki S, Takaki Y, Shirotani K, Lu B, Gerard NP, et al. Metabolic regulation of brain Abeta by neprilysin. Science. 2001;292:1550–1552. doi: 10.1126/science.1059946. [DOI] [PubMed] [Google Scholar]
- Shibata M, Yamada S, Kumar SR, Calero M, Bading J, Frangione B, et al. Clearance of Alzheimer's amyloid-ss(1-40) peptide from brain by LDL receptor-related protein-1 at the blood-brain barrier. J Clin Invest. 2000;106:1489–1499. doi: 10.1172/JCI10498. [DOI] [PMC free article] [PubMed] [Google Scholar]
- Shiiki T, Ohtsuki S, Kurihara A, Naganuma H, Nishimura K, Tachikawa M, et al. Brain insulin impairs amyloid-beta(1-40) clearance from the brain. J Neurosci. 2004;24:9632–9637. doi: 10.1523/JNEUROSCI.2236-04.2004. [DOI] [PMC free article] [PubMed] [Google Scholar]
- Ito S, Ueno T, Ohtsuki S, Terasaki T. Lack of brain-to-blood efflux transport activity of low-density lipoprotein receptor-related protein-1 (LRP-1) for amyloid-beta peptide(1-40) in mouse: involvement of an LRP-1-independent pathway. J Neurochem. 2010;113:1356–1363. doi: 10.1111/j.1471-4159.2010.06708.x. [DOI] [PubMed] [Google Scholar]
- Lanz TA, Schachter JB. Demonstration of a common artifact in immunosorbent assays of brain extracts: development of a solid-phase extraction protocol to enable measurement of amyloid-beta from wild-type rodent brain. J Neurosci Methods. 2006;157:71–81. doi: 10.1016/j.jneumeth.2006.03.023. [DOI] [PubMed] [Google Scholar]
- Oe T, Ackermann BL, Inoue K, Berna MJ, Garner CO, Gelfanova V, et al. Quantitative analysis of amyloid beta peptides in cerebrospinal fluid of Alzheimer's disease patients by immunoaffinity purification and stable isotope dilution liquid chromatography/negative electrospray ionization tandem mass spectrometry. Rapid Commun Mass Spectrom. 2006;20:3723–3735. doi: 10.1002/rcm.2787. [DOI] [PubMed] [Google Scholar]
- Lanz TA, Schachter JB. Solid-phase extraction enhances detection of beta-amyloid peptides in plasma and enables Abeta quantification following passive immunization with Abeta antibodies. J Neurosci Methods. 2008;169:16–22. doi: 10.1016/j.jneumeth.2007.11.009. [DOI] [PubMed] [Google Scholar]
- Kamiie J, Ohtsuki S, Iwase R, Ohmine K, Katsukura Y, Yanai K, et al. Quantitative atlas of membrane transporter proteins: development and application of a highly sensitive simultaneous LC/MS/MS method combined with novel in-silico peptide selection criteria. Pharm Res. 2008;25:1469–1483. doi: 10.1007/s11095-008-9532-4. [DOI] [PubMed] [Google Scholar]
- Lorenz JN, Gruenstein E. A simple, nonradioactive method for evaluating single-nephron filtration rate using FITC-inulin. Am J Physiol. 1999;276:F172–F177. doi: 10.1152/ajprenal.1999.276.1.F172. [DOI] [PubMed] [Google Scholar]
- Yamaoka K, Tanigawara Y, Nakagawa T, Uno T. A pharmacokinetic analysis program (multi) for microcomputer. J Pharmacobiodyn. 1981;4:879–885. doi: 10.1248/bpb1978.4.879. [DOI] [PubMed] [Google Scholar]
- Eckman EA, Reed DK, Eckman CB. Degradation of the Alzheimer's amyloid beta peptide by endothelin-converting enzyme. J Biol Chem. 2001;276:24540–24548. doi: 10.1074/jbc.M007579200. [DOI] [PubMed] [Google Scholar]
- Perez A, Morelli L, Cresto JC, Castano EM. Degradation of soluble amyloid beta-peptides 1-40, 1-42, and the Dutch variant 1-40Q by insulin degrading enzyme from Alzheimer disease and control brains. Neurochem Res. 2000;25:247–255. doi: 10.1023/a:1007527721160. [DOI] [PubMed] [Google Scholar]
- Shirotani K, Tsubuki S, Iwata N, Takaki Y, Harigaya W, Maruyama K, et al. Neprilysin degrades both amyloid beta peptides 1-40 and 1-42 most rapidly and efficiently among thiorphan- and phosphoramidon-sensitive endopeptidases. J Biol Chem. 2001;276:21895–21901. doi: 10.1074/jbc.M008511200. [DOI] [PubMed] [Google Scholar]
- Iwata N, Tsubuki S, Takaki Y, Watanabe K, Sekiguchi M, Hosoki E, et al. Identification of the major Abeta1-42-degrading catabolic pathway in brain parenchyma: suppression leads to biochemical and pathological deposition. Nat Med. 2000;6:143–150. doi: 10.1038/72237. [DOI] [PubMed] [Google Scholar]
- Affholter JA, Cascieri MA, Bayne ML, Brange J, Casaretto M, Roth RA. Identification of residues in the insulin molecule important for binding to insulin-degrading enzyme. Biochemistry. 1990;29:7727–7733. doi: 10.1021/bi00485a022. [DOI] [PubMed] [Google Scholar]
- Miller BC, Eckman EA, Sambamurti K, Dobbs N, Chow KM, Eckman CB, et al. Amyloid-beta peptide levels in brain are inversely correlated with insulysin activity levels in vivo. Proc Natl Acad Sci USA. 2003;100:6221–6226. doi: 10.1073/pnas.1031520100. [DOI] [PMC free article] [PubMed] [Google Scholar]
- Ito S, Ohtsuki S, Murata S, Katsukura Y, Suzuki H, Funaki M, et al. Involvement of insulin-degrading enzyme in insulin- and atrial natriuretic peptide-sensitive internalization of amyloid-beta peptide in mouse brain capillary endothelial cells J Alzheimers Dis 2013(e-pub ahead of print). [DOI] [PubMed]
- Kakee A, Terasaki T, Sugiyama Y. Brain efflux index as a novel method of analyzing efflux transport at the blood-brain barrier. J Pharmacol Exp Ther. 1996;277:1550–1559. [PubMed] [Google Scholar]
- Hellstrom-Lindahl E, Ravid R, Nordberg A. Age-dependent decline of neprilysin in Alzheimer's disease and normal brain: inverse correlation with A beta levels. Neurobiol Aging. 2008;29:210–221. doi: 10.1016/j.neurobiolaging.2006.10.010. [DOI] [PubMed] [Google Scholar]
- Caccamo A, Oddo S, Sugarman MC, Akbari Y, LaFerla FM. Age- and region-dependent alterations in Abeta-degrading enzymes: implications for Abeta-induced disorders. Neurobiol Aging. 2005;26:645–654. doi: 10.1016/j.neurobiolaging.2004.06.013. [DOI] [PubMed] [Google Scholar]
- Miners JS, Baig S, Palmer J, Palmer LE, Kehoe PG, Love S. Abeta-degrading enzymes in Alzheimer's disease. Brain Pathol. 2008;18:240–252. doi: 10.1111/j.1750-3639.2008.00132.x. [DOI] [PMC free article] [PubMed] [Google Scholar]
- Akiyama H, Kondo H, Ikeda K, Kato M, McGeer PL. Immunohistochemical localization of neprilysin in the human cerebral cortex: inverse association with vulnerability to amyloid beta-protein (Abeta) deposition. Brain Res. 2001;902:277–281. doi: 10.1016/s0006-8993(01)02390-3. [DOI] [PubMed] [Google Scholar]
- Eckman EA, Adams SK, Troendle FJ, Stodola BA, Kahn MA, Fauq AH, et al. Regulation of steady-state beta-amyloid levels in the brain by neprilysin and endothelin-converting enzyme but not angiotensin-converting enzyme. J Biol Chem. 2006;281:30471–30478. doi: 10.1074/jbc.M605827200. [DOI] [PubMed] [Google Scholar]
- Vardy ER, Catto AJ, Hooper NM. Proteolytic mechanisms in amyloid-beta metabolism: therapeutic implications for Alzheimer's disease. Trends Mol Med. 2005;11:464–472. doi: 10.1016/j.molmed.2005.08.004. [DOI] [PubMed] [Google Scholar]
- Miners JS, Van Helmond Z, Chalmers K, Wilcock G, Love S, Kehoe PG. Decreased expression and activity of neprilysin in Alzheimer disease are associated with cerebral amyloid angiopathy. J Neuropathol Exp Neurol. 2006;65:1012–1021. doi: 10.1097/01.jnen.0000240463.87886.9a. [DOI] [PubMed] [Google Scholar]
- Wang S, Wang R, Chen L, Bennett DA, Dickson DW, Wang DS. Expression and functional profiling of neprilysin, insulin-degrading enzyme, and endothelin-converting enzyme in prospectively studied elderly and Alzheimer's brain. J Neurochem. 2010;115:47–57. doi: 10.1111/j.1471-4159.2010.06899.x. [DOI] [PMC free article] [PubMed] [Google Scholar]
- Weksler BB, Subileau EA, Perriere N, Charneau P, Holloway K, Leveque M, et al. Blood-brain barrier-specific properties of a human adult brain endothelial cell line. FASEB J. 2005;19:1872–1874. doi: 10.1096/fj.04-3458fje. [DOI] [PubMed] [Google Scholar]
- Sano Y, Shimizu F, Abe M, Maeda T, Kashiwamura Y, Ohtsuki S, et al. Establishment of a new conditionally immortalized human brain microvascular endothelial cell line retaining an in vivo blood-brain barrier function. J Cell Physiol. 2010;225:519–528. doi: 10.1002/jcp.22232. [DOI] [PubMed] [Google Scholar]
- Lippmann ES, Azarin SM, Kay JE, Nessler RA, Wilson HK, Al-Ahmad A, et al. Derivation of blood-brain barrier endothelial cells from human pluripotent stem cells. Nat Biotechnol. 2012;30:783–791. doi: 10.1038/nbt.2247. [DOI] [PMC free article] [PubMed] [Google Scholar]
Associated Data
This section collects any data citations, data availability statements, or supplementary materials included in this article.