Abstract
Labeling of cerebral vasculature is important for characterization of anatomical variation, quantification of brain morphology with respect to specific vessels, and inter-subject comparisons of vessel properties and abnormalities. We propose an automated method to label the anterior portion of cerebral arteries using a statistical inference method on the Bayesian network representation of the vessel tree. Our approach combines the likelihoods obtained from a random forest classifier trained using vessel centerline features with a belief propagation method integrating the connection probabilities of the cerebral artery network. We evaluate our method on 30 subjects using a leave-one-out validation, and show that it achieves an average correct vessel labeling rate of over 92%.
Keywords: Automated labeling of vessels, cerebral arteries, random forest, belief propagation, statistical inference on Bayesian networks
1. INTRODUCTION
Cerebrovascular networks exhibit significant differences among subjects. Length, tortuosity (crookedness), and radii of vessels, as well as the topology of vascular networks are highly variable.1,2 These properties of vessels, coupled with the difficulty of obtaining accurate vessel segmentations from MR images, make automated labeling of vasculature a challenging problem. Labeling of cerebral vasculature is important for characterization of anatomical variation, quantification of brain morphology with respect to specific vessels, and inter-subject comparisons of vessel properties and abnormalities. Yet, unlike segmentation, the labeling of segmented vascular trees remains a sparsely studied topic. Early work on automated labeling of tubular structures has focused on labeling of airway trees. Tschirren3 used association graphs to match branchpoints to a reference tree representing a population average. Mori4-6 used a classification scheme constructed on a “knowledge base” and a set of constraints for the labels assigned to the various branches of the airway tree. A cerebrovascular labeling scheme was recently proposed by Bogunović,7 where the authors used an SVM classifier to obtain likelihoods on the bifurcations in the network, which were then used to perform MAP estimation on the vessel tree by finding isomorphic mappings to a reference vessel tree.
We have developed a method for labeling the cerebral arteries by performing statistical inference on a Bayesian network representation of the vessel centerlines. The vessels we consider for this purpose are the internal carotid artery (ICA), the ophthalmic artery, the anterior cerebral artery (ACA – divided into A1 segment, A2 segment, and the rest), the anterior communicating artery, and the middle cerebral artery (MCA – divided into M1 segment and the rest). In addition to likelihoods obtained from a random forest classifier8 for each vessel segment, we incorporate probabilities describing the network topology in solving this inference problem. The statistical inference method we adopt is Pearl’s belief propagation.9
The rest of this paper is organized as follows: Section 2 describes the proposed method starting with the initial vessel segmentation, and presents a brief review of random forests (Sec. 2.1) followed by the integration of the random forest predictors in a belief propagation model (Sec. 2.2) of the vessel tree to improve the classifier. Experimental results on a set of 30 subjects are presented in Section 3, and we conclude with a discussion on the merits and drawbacks of this work in Section 4.
2. METHOD
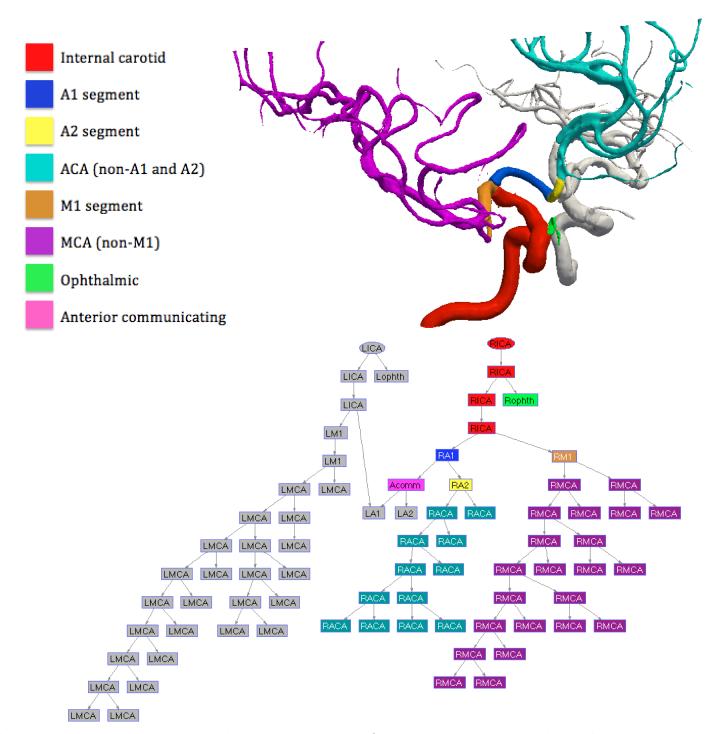
To segment the cerebral arteries from 3D time-of-flight MR angiography (TOF-MRA) images, we use an EM algorithm to fit a four-class mixture model to the intensity values, as described in Hassouna.10 We then extract the centerlines of the vessels and divide them into segments based on their branching points using a method based on fast marching.11 Note that a single continuous anatomical vessel is divided into several shorter segments as a result of this centerline extraction if there are multiple branching points or if there are sudden changes in the vessel radius (as determined by fast marching) or orientation. The inferior-most portions of the left and right internal carotid arteries (ICA) can readily be detected in the resulting set of vessel centerline segments based on their coordinates. A network representation of the vasculature is obtained by designating each vessel centerline segment as a node, with the lowest segments of each ICA serving as the roots of the graph, see Figure 1 for an example. Edges between nodes are placed according to the spatial connectivity of the centerline segments, and are oriented to point away from the nearest root. For this purpose, we define distance as the arc length of the centerline corresponding to the shortest path connecting the node to the root. As we consider only the anterior circulation of the cerebrum, the resulting network is a directed polytree with no loops.
Figure 1.
Vessel segmentation and network representation for one subject. Each node in the graph represents a vessel centerline segment, and the edges reflect the connections between the vessel segments. Edges are directed away from the internal carotid arteries. Legend: ICA=internal carotid a., ophth=ophthalmic a., ACA=anterior cerebral a., MCA=middle cerebral a., Acomm=anterior communicating a. First letter (L or R) indicates the cerebral hemisphere.
For training and validation purposes, each node of the vessel graph is manually labeled with one of the 15 labels: the internal carotid artery (ICA), the ophthalmic artery, the anterior cerebral artery (ACA – divided into A1 segment, A2 segment, and the rest), the anterior communicating artery, and the middle cerebral artery (MCA – divided into M1 segment and the rest). With the exception of the anterior communicating artery, the labels are distinguished as being in the left or right hemisphere (Fig. 1).
The labeling algorithm presented in this work consists of estimating the label of each vessel segment using the likelihoods from a random forest classifier as input to a belief propagation algorithm on the Bayesian network representation of the vasculature. The random forest classifier makes use of the intrinsic features of a vessel segment such as arc length, orientation, and distance from each ICA, and belief propagation incorporates regularization based on the learned vessel network structure.
2.1 Random Forest Classification
The initial step in the vessel labeling process is to assign predicted labels with likelihoods to each vessel centerline segment with a random forest classifier. A random forest is a collection of decision trees that are constructed from randomly selected subsets of training samples and features. Each tree split is designed based on these subsets to maximize the separation of data. The final class label for a sample is the most common label predicted by all trees in the forest. The likelihood value assigned to each prediction is the fraction of leaf observations that are of the predicted class, averaged across all trees in the forest.
For each centerline segment, we calculate a set of features including arc length, length of the line connecting the two end points of the segment, the components of the vector connecting the two end points of the segment, and the components of the vectors connecting the midpoints of the graph root vessels to the midpoints of each vessel. The vessel segments are not restricted to a certain length during the centerline extraction and branch detection step; however, this is not a concern regarding the features used in the random forest classifier as the same anatomical vessels are expected to exhibit similar features across individuals. We then use these features, in addition to the averaged features across siblings and averaged features across parents of the vessel segment, to train a random forest classifier. The resulting classifier is applied to the test subject to obtain likelihoods for each vessel segment belonging to each class. These likelihoods are then incorporated into Pearl’s belief propagation method, as explained below.
2.2 Propagation in Bayesian Belief Network
Even though the random forest classifier incorporates sibling and parent vessel information via the use of features, its label prediction results do not necessarily abide by the connectivity rules of the cerebrovascular network. To incorporate the constraints and probabilities of vascular connections, we frame the labeling task as a statistical inference problem on the Bayesian network representation of the vessels. Using the likelihoods obtained for each node label from the random forest classifier as soft evidence in the Bayesian network, we seek to find the set of node labels that maximize the posterior probabilities for each node. To accomplish this task, we use Pearl’s belief propagation algorithm, which is guarantees convergence to the exact marginal probabilities for each node over all other nodes of the graph on directed trees and polytrees.9
Using Pearl’s choice of variables, the posterior probability, or belief, for variable X = x is denoted BEL(x) = P (x|e), where the evidence e on X can be separated into two disjoint subsets: , the evidence contributed by outgoing links, and , evidence contributed by incoming links. For a node X, we denote the strength of support contributed by each incoming link as , and by each outgoing link X → Yj as . The fixed conditional probability matrix relating X to its parents is P (x|u), which is also referred to as the link matrix. Belief propagation can now be summarized in three steps:
STEP 1 - Belief updating: Incorporating all messages from parents and children of X yields
respectively. The belief measure is then updated to
where ensures that sum of beliefs on node X is 1.
STEP 2 - Bottom-up propagation: The new messages to be propagated upstream in the network are computed as
where β is a normalizing factor.
STEP 3 - Top-down propagation: The new messages to be propagated downstream in the network are computed as
Messages passed between nodes are uniformly initialized at the beginning of the belief propagation algorithm, and these three steps are repeated for each node until the beliefs no longer change.
The 15 possible vessel labels make up the state-space for each node, and we obtain the link matrices for each edge in the vessel network by calculating the frequencies of each parent-child vessel connection in the training set. Soft evidence from the random forest classifier is incorporated for every node in the network by adding a dummy node as a child, and by setting up the link matrix for this connection to reflect the likelihoods. We include an additional dummy node to each leaf node in order to incorporate the probability of a vessel label appearing as a terminal label in the graph representation. We use the belief propagation implementation in the Bayes Net Toolbox for Matlab.12
3. RESULTS
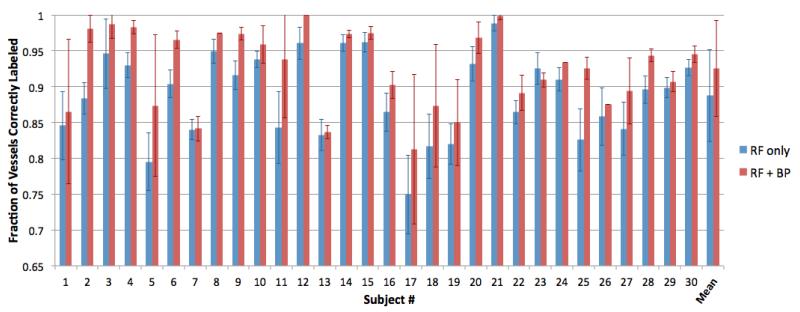
Time-of-flight brain MRA images of 30 subjects were resampled to 0.39×0.39×0.39 mm (originally 0.39×0.39×0.50 mm) prior to artery segmentation. Artery centerlines were extracted and the vessel network representations were obtained for the anterior portion of the cerebral arteries. A total of 10 trees were used in the random forest classifier. Due to the limited size of the labeled data set, a leave-one-out validation was performed. Each leave-one-out experiment was repeated 10 times to account for the stochastic nature of the random forest classifier. Increasing the number of repeats beyond 10 did not noticeably affect the results. The fraction of vessel segments labeled correctly were reported at the end of each validation experiment. Results averaged across all trials for each subject are presented in Figure 2. Across all experiments, the average correct labeling rate was 0.887 ± 0.064 using only the random forest classifier. Our addition of the belief propagation built on top of the random forest classifier had a labeling rate of 0.925 ± 0.067.
Figure 2.
Fraction of vessels correctly labeled, averaged across 10 experiments for each subject. Blue columns are the results of the random forest classifier (RF), and red columns show the results of RF followed by belief propagation (RF+BP). The right-most column pair is the average correct labeling rates across all 30 ± 10 = 300 experiments.
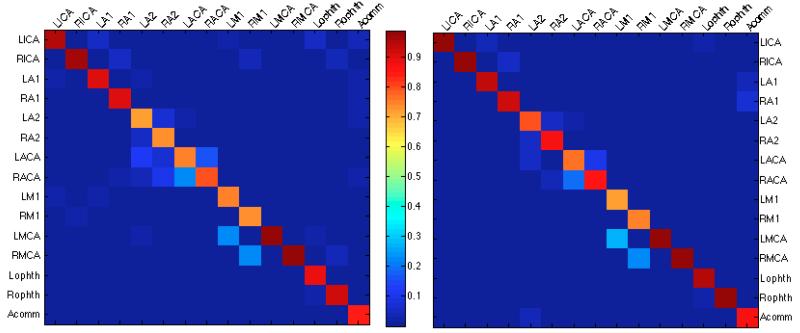
Compared to the results of the random forest (RF) classifier, the incorrect labels at the end of the random forest followed by belief propagation (RF+BP) approach were more closely related to the true vessel labels. This can be deduced by comparing the confusion matrices for each method, which are presented in Figure 3. Ideally, we would like to see a value of 1.0 along the diagonal and 0 everywhere else, which indicates perfect labeling. The RF only approach results in confusion matrix values that have greater deviation from the diagonal compared to the RF+BP approach. While the RF classifier can lead to obvious mislabelings such as classifying the ophthalmic arteries as middle cerebral arteries, RF+BP results are free from such errors that are not allowed given the vessel network topology influence on the belief propagation.
Figure 3.
Confusion matrices for the RF only method (left) and RF+BP (right) for all vessel segments across 30 subjects. True labels are on the horizontal axis, and the predicted labels on the vertical axis. The values presented in the matrices are fraction of vessels with true label x that were assigned label y (i.e. values in each column add up to 1).
4. DISCUSSION AND CONCLUSION
We proposed a method for anatomical labeling of the major arteries making up the anterior portion of the cerebral vasculature with a random forest classifier and belief propagation on the Bayesian network representation of the vessel centerlines. Using a subset of the manually labeled samples, our method learns vessel centerline features and probabilities describing vessel network topology. This approach is capable of capturing anatomical variation, both in terms of branch length, orientation, and vessel network topology. The method presented can be generalized to the whole cerebrovascular network, as the belief propagation algorithm is capable of producing approximate, yet accurate results even in the case of networks with loops.9
Our vessel labeling result of over 92% accuracy compare favorably with those presented in Bogunović et al., who achieved a correct vessel tree labeling rate of 90% by employing an SVM classifier on vessel bifurcations and using the resulting likelihoods in a tree matching algorithm to assign labels to five vessel branches. Their tree matching algorithm, which consists of finding maximal cliques of the association graph of the reference and subject vessel trees, is an NP-complete problem. On the other hand, our proposed method employing belief propagation is linear in the number of network parameters.13,14 The faster computation time of our method makes it more suitable for expansion to more labels (including posterior cerebral arteries).
Subject 23 was the only subject for whom belief propagation yielded worse results on average than those of the random forest classifier. This subject had a much longer M1 segment than the subjects in the training set, and the labeling mistakes at the end of belief propagation in this case were limited to the M1 segment being labeled as non-M1 MCA for two of the vessel segments. The likelihoods obtained from the random forest classifier for these two vessel segments were very close for the M1 and non-M1 MCA labels. Thus, the belief propagation algorithm was not influenced as much by the random forest likelihoods as by the probabilities learned from vessel network connections, which resulted in a worse correct labeling rate. Such a problem is most likely due to the limited number of subjects included in training, and can be fixed by using more data.
One limitation of this work is that while the belief propagation tends to improve upon the results of the random forest classifier, its performance can be significantly affected by the likelihoods obtained from the classifier. Future work will focus on making the statistical inference on the vessel network more robust to the results of the preceding classification step, and will extend this methodology to the rest of the brain vasculature.
REFERENCES
- [1].Pérez-Carrillo GJG, Hogg JP. Intracranial vascular lesions and anatomical variants all residents should know. Current Problems in Diagnostic Radiology. 2010;39(3):91–109. doi: 10.1067/j.cpradiol.2009.07.005. [DOI] [PubMed] [Google Scholar]
- [2].Nowinski WL, Thirunavuukarasuu A, Volkau I, Marchenko Y, Aminah B, Puspitasari F, Runge VM. A three-dimensional interactive atlas of cerebral arterial variants. Neuroinformatics. 2009;7(4):255–264. doi: 10.1007/s12021-009-9055-0. [DOI] [PubMed] [Google Scholar]
- [3].Tschirren J, McLennan G, Palágyi K, Hoffman EA, Sonka M. Matching and anatomical labeling of human airway tree. IEEE Transactions on Medical Imaging. 2005;24(12):1540–1547. doi: 10.1109/TMI.2005.857653. [DOI] [PMC free article] [PubMed] [Google Scholar]
- [4].Mori K, Hasegawa J, Suenaga Y, Toriwaki J. Automated anatomical labeling of the bronchial branch and its application to the virtual bronchoscopy system. IEEE Transactions on Medical Imaging. 2000;19(2):103–114. doi: 10.1109/42.836370. [DOI] [PubMed] [Google Scholar]
- [5].Mori K, Ota S, Deguchi D, Kitasaka T, Suenaga Y, Iwano S, Hasegawa Y, Takabatake H, Mori M, Natori H. Automated anatomical labeling of bronchial branches extracted from CT datasets based on machine learning and combination optimization and its application to bronchoscope guidance; [Proc. MICCAI], LNCS; 2009; Springer; pp. 707–714. [DOI] [PubMed] [Google Scholar]
- [6].Mori K, Oda M, Egusa T, Jiang Z, Kitasaka T, Fujiwara M, Misawa K. Automated nomen-clature of upper abdominal arteries for displaying anatomical names on virtual laparoscopic images; [Proc. MIAR], LNCS; 2010; Springer; pp. 353–362. [Google Scholar]
- [7].Bogunović H, Pozo JM, Cárdenes R, Frangi AF. Anatomical labeling of the anterior circulation of the circle of willis using maximum a posteriori classification; [Proc. MICCAI], LNCS; 2011; Springer; pp. 330–337. [DOI] [PubMed] [Google Scholar]
- [8].Breiman L. Random forests. Machine Learning. 2001;45(1):5–32. [Google Scholar]
- [9].Pearl J. Probabilistic Reasoning in Intelligent Systems: Networks of Plausible Inference. first ed. Morgan Kaufmann; San Mateo, CA: 1988. [Google Scholar]
- [10].Hassouna MS, Farag AA, Hushek S, Moriarty T. Cerebrovascular segmentation from TOF using stochastic models. Medical Image Analysis. 2006;10(1):2–18. doi: 10.1016/j.media.2004.11.009. [DOI] [PubMed] [Google Scholar]
- [11].Van Uitert R, Bitter I. Subvoxel precise skeletons of volumetric data based on fast marching methods. Medical Physics. 2007;34(2):627–638. doi: 10.1118/1.2409238. [DOI] [PubMed] [Google Scholar]
- [12].Murphy KP. The Bayes Net Toolbox for MATLAB. Computing Science and Statistics. 2001;33 [Google Scholar]
- [13].Pearl J. Fusion, propagation, and structuring in belief networks. Artif. Intell. 1986;29(3):241–288. [Google Scholar]
- [14].Cooper GF. The computational complexity of probabilistic inference using Bayesian belief networks. Artif. Intell. 1990;42(2-3):393–405. [Google Scholar]


