Abstract
A Pico digital light projector has been implemented as an integrated illumination source and spatial light modulator for confocal imaging. The target is illuminated with a series of rapidly projected lines or points to simulate scanning. Light returning from the target is imaged onto a 2D rolling shutter CMOS sensor. By controlling the spatio-temporal relationship between the rolling shutter and illumination pattern, light returning from the target is spatially filtered. Confocal retinal, fluorescence, and Fourier-domain optical coherence tomography implementations of this novel imaging technique are presented.
Keywords: Pico projector, rolling shutter, DLP, CMOS, spatial light modulator, confocal imaging, digital imaging, biomedical imaging
1. INTRODUCTION
Confocal imaging is a well-known imaging technique in which light returning from a target is spatially filtered prior to detection. Spatial filtering is commonly used to reduce image artifacts, improve image contrast, and isolate features of interest, which has helped popularize it for biomedical imaging applications.
Laser scanning confocal imaging systems traditionally illuminate a target with a point or line that is rapidly scanned across the field of view. The light returning from the target is descanned and directed through an aperture to a photosensitive detector. By synchronizing the scanning with the exposure timing of the detector, a two-dimensional image of the target is constructed. Adjustments to the aperture position, shape, and size allow a user to trade off the amount of spatial filtering with the amount of light returning from the target that is detected.
An alternate approach to laser scanning confocal imaging makes use of the rolling shutter method of detection that is common to complementary metal oxide semiconductor (CMOS) sensor chips1–3. Unlike a global shutter, which integrates charge evenly across the entire active sensor area during the exposure time, the rolling shutter integrates light over one or more pixel rows at a time, spanning a “shutter width”. During each frame, the rolling shutter progressively scans across the active sensor region with a shutter width related to the total frame exposure time. Light incident on the sensor outside the rolling shutter width is not captured.
The rolling shutter means of detection has historically been criticized for its performance when imaging moving targets and using short exposure times, which can cause wobble, skew, smear, and partial exposure. However, these detection characteristics can also be used to one's advantage, for example, in pose recovery motion algorithms4 and line-scanning confocal retinal imaging5, 6. To perform confocal imaging with the rolling shutter, a target is illuminated with a line that is scanned across the field of view. Rather than descanning the light returning from the target, it is imaged directly onto a 2D CMOS pixel array. The position of the line focused on the target is matched to the position of the rolling shutter throughout the frame exposure. With spatial filtering provided by a narrow shutter width, directly backscattered light is preferentially detected, while out-of-focus and multiply scattered light is rejected.
A benefit of confocal imaging using the rolling shutter is that it allows adjustments to the shutter position and width in pixel increments on a frame-to-frame basis. Compared with mechanical apertures, the rolling shutter allows much more precise and rapid changes to the spatial filter function since it is electronically controlled in real-time.
The Laser Scanning Digital Camera (LSDC) is a line-scanning camera that uses the rolling shutter to obtain confocal images of the retina for cost-effective diabetic retinopathy screening and visual function measurements7–9. By offsetting the rolling shutter position with respect to the illumination line, the imaging system can rapidly switch to a dark-field imaging mode, which has been used to detect scattering defects in the deeper retina that are normally masked by scattering in the superficial retina10.
The rolling shutter spatial filter has also been demonstrated as an optical frequency filter when a dispersive element is added to the detection pathway. In this case, the rolling shutter is matched to a particular wavelength of light returning from the target. The shutter width controls the spectral bandwidth that is detected while its starting position adjusts the center wavelength. When applied to fluorescence imaging, the spectral components of the fluorescent emission from the target can be selectively isolated and imaged11.
To perform confocal imaging, the LSDC requires a laser illumination source and galvanometer scanning element to deliver light onto the retina. In this study, a new technique is demonstrated in which the source and scanning element required in laser scanning confocal systems are substituted for a Pico digital light projector (DLP). The DLP uses high power red, green, and blue light emitting diodes (LEDs) to illuminate a digital micromirror array that is located at a conjugate target plane. When driven with a video signal, the LEDs and micromirror elements are rapidly adjusted to project the desired illumination pattern onto the target. To simulate line-scanning, the DLP is programmed to rapidly project a series of narrow adjacent lines, which are matched to the position of the sensor's rolling shutter.
The combination of the spatial light modulation of a DLP with the spatial filtering provided by the rolling shutter of a CMOS sensor permits a cost effective and compact implementation of a confocal imaging system12. The fact that the DLP can be used as a source without hardware modification and is driven directly from software using a PC video card nearly eliminates all custom-built control electronics, while allowing for more versatile illumination geometries than are possible when using a single scanning element.
In this work, a Pico DLP illumination source produced by Texas Instruments is combined with the rolling shutter means of detection in a novel confocal imaging system. Retinal, fluorescent, and optical coherence tomography (OCT) imaging modes are demonstrated at 20 frames per second with visible illumination wavelengths.
2. METHODOLOGY
The DLP used in this study was the Texas Instruments DLP Pico 2.0 Development Kit (Young Optics, Inc., Hsinchu, TW). It has a 320×480 pixel resolution and a 3 channel 8-bit red, green, and blue LED output. The DLP was driven using the DVI video output from a BeagleBoard-xM single board computer (CircuitCo Electronics, LLC, Richardson, TX, USA). Programming calls to the projector were made through the I2C serial bus13. The spectrum of its white-light output, shown in Figure 1, was measured with a USB4000-VIS-NIR spectrometer (Ocean Optics, Inc., Dunedin, FL, USA). The three peaks show, from left to right, the spectrum from the blue, green and red LED channels, respectively.
Figure 1.
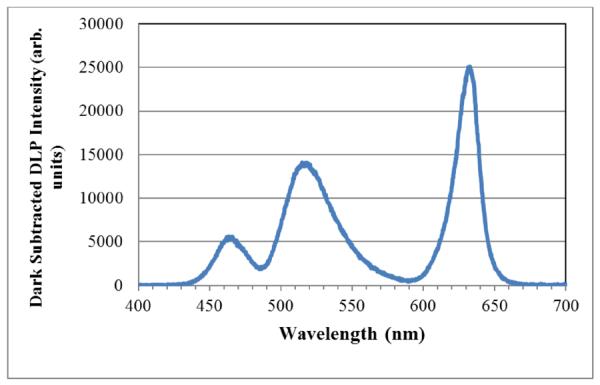
Optical spectrum of the DLP Pico 2.0 Development Kit. The three peaks show, from left to right, the output of the blue, green, and red DLP channels, respectively.
The 2D pixel array detector used in this study was a buffered 8-bit monochrome BCN-B013-U camera board (Mightex Systems, Pleasanton, CA, USA) with an MT9M001 CMOS rolling shutter sensor (Aptina Imaging Corp., San Jose, CA, USA). The sensor has 1024×1280 pixels, and programming calls were made to the camera board through its software development kit. Timing synchronization between the DLP output and rolling shutter position was achieved by externally triggering the camera board from the BeagleBoard-xM's LCD video output signal. The DLP video refresh and sensor frame rates were 60 Hz and 20 Hz, respectively. The camera board's strobe signal, measured with a Picoscope 3424 USB oscilloscope (Pico Technology Ltd., St. Neots, Cambs, UK)) indicated that the rolling shutter takes 38.4 msec to roll across the sensor width of 1024 pixels.
To simulate line-scanning, the DLP projects a series of adjacent rectangular strips in rapid progression that are timed and spatially located according to the position of the rolling shutter. When the shutter width is narrower than the DLP strip width, the discrete steps of the DLP output can cause the detected intensity to dip as the rolling shutter moves from one strip to the next. Since a narrow shutter width is desired to spatially filter unwanted scattered light returning from the target, a narrow DLP strip is also desired to maintain an even image intensity and limit illumination to the regions on the target currently being imaged.
To rapidly illuminate the target with many rectangular strips during a sensor frame, the DLP is set to operate in its 1,440 Hz structured light illumination mode14. This mode remaps the standard 3-channel, 8-bit 60 Hz video input for each pixel to a sequence of 24 1-bit monochrome outputs that are each displayed in 0.68 msec time slots. While operating in this mode, the DLP frame time is still 16.67 msec. During each rolling shutter sweep on the sensor, the DLP will output 2.30 frames. From one DLP frame to the next, there is no illumination during the vertical blanking interval of 0.35 msec. The lack of illumination between display frames will create an undesired dark zone approximately 9 pixels wide on the sensor. In practice, this zone is not completely dark when using a rolling shutter width greater than 9 pixels since some light will be collected during the illumination of the last and first strips of consecutive DLP frames. The location of the dark zones in the image frame will depend on the timing offset between the start of the DLP and sensor frames. Since the sensor frame rate is an integer multiple of the DLP frame rate, the location of the dark zones in the image will remain stationary.
With a 16.67 msec DLP frame time, a total of 55.3 strips can be displayed in sequence as the shutter rolls across the sensor. When temporally matched to the rolling shutter, the illumination strips span 18.1 pixels on the sensor. In this study, each illumination strip was 5 DLP pixels wide, resulting in a conversion of 276.5 DLP to 1024 sensor pixels, and a calculated strip width of 18.5 pixels on the sensor. This strip width difference, caused by the discrete DLP pixel size, will cause the strips to very gradually drift off the center position of the rolling shutter as it sweeps across the field of view. However, the magnitude of the drift, 0.4 pixels per strip or 9.6 pixels per DLP frame, will have a minor effect on the light detected by the sensor for shutter widths significantly larger than 9.6 pixels. Furthermore, a very slight tilt of the sensor can provide minor corrections to the drift between the illumination strips and rolling shutter, but at the cost of adding optical aberrations.
A schematic of an optical system configured for confocal imaging of a target is shown in Figure 2. The output of the DLP is collimated by a 25×50 mm achromat doublet lens (L1) and focused onto a target. A pellicle 45:55 beamsplitter (BS) was used to direct a portion of the light returning from the target toward the CMOS sensor. A 25×100 mm and a 25×40 mm achromat doublet (L2 and L3) were used to magnify and focus the image of the target onto the CMOS sensor. In-house software provided user control of the position, width and direction of the illumination strip sequence. To perform dark-field imaging, the starting position of the strip sequence is shifted by an integer number of DLP pixels. The color of the monochrome output in structured light illumination mode can be switched in real-time through software.
Figure 2.
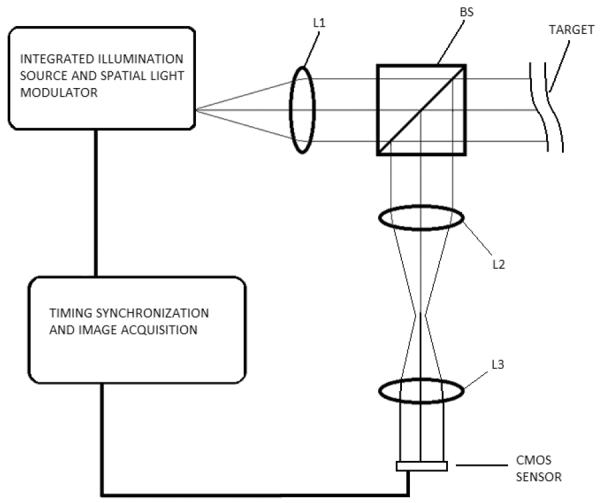
Optical design schematic of a confocal imaging system that uses a DLP source to project a series of illumination strips that are synchronized to the rolling shutter of the CMOS sensor. Lens L1 is used to focus the DLP illumination onto the target, pellicle beamsplitter BS directs a portion of light return to the CMOS sensor, and lenses L2 and L3 adjust the image magnification and focus the image onto the sensor.
The confocal imaging system shown in Figure 2 was further adapted for retinal imaging, shown in Figure 3, by adding a pair of 25×50 mm achromat doublet lenses just after the DLP output to provide access to a conjugate pupil plane (L4, L5), and by adding a 25×125 mm positive meniscus and 25×50 mm achromat doublet ocular lens (both at L6). To remove unwanted corneal reflections from the retinal image, the illumination and imaging regions of the pupil are spatially separated with apertures placed in conjugate pupil planes (A1 and A2). In this configuration, the pupil was separated side-to-side using a D-mirror and razor blade apertures. The working distance was 25 mm, the field of view 15.6 deg, and the pupil diameter was 2.5 mm. To correct for the refractive error of subjects' eyes, L6 was placed on a translation stage. By varying the L6-BS distance over approximately 25 mm, the imaging system corrected +/− 10 D of refractive error. To reduce the footprint of the system, lenses L2 and L3 were substituted for a 25×50 mm and 25×20 mm lens, respectively. Although non-mydriatic imaging was possible using this pupil diameter, the amount of light return was limited by pupil constriction, which was resolved by dilation.
Figure 3.
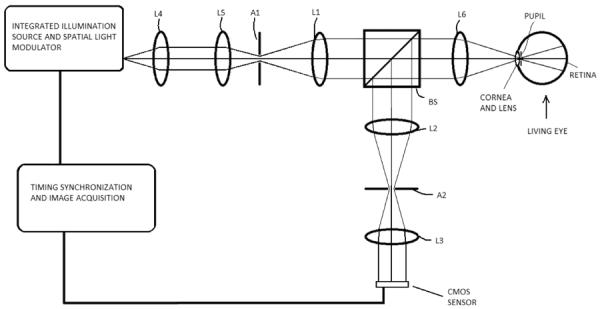
Optical design schematic of a confocal imaging system using a DLP source and rolling shutter CMOS detector adapted for retinal imaging. Apertures A1 and A2 are located at conjugate pupil planes and are used to separate the illumination and imaging pathways to remove corneal reflections. Lenses L1–L6 direct the illumination and imaging light through the system. Pellicle beamsplitter BS directs a portion of imaging light from the retina to the CMOS sensor.
To perform spectroscopy, a ruled diffraction grating (600 grooves/mm, 500 nm blaze wavelength) was added to the detection pathway of the confocal imaging system of Figure 2, as shown in Figure 4a. In this system, the light returning from the target is spatially separated according to its wavelength and then focused on the sensor. The spatial filtering provided by the rolling shutter serves as an adjustable frequency filter. By altering the starting position of the illumination strip sequence, as is done for dark-field imaging in the standard confocal imaging system, the sensor acquires images of the target at various wavelengths.
Figure 4.
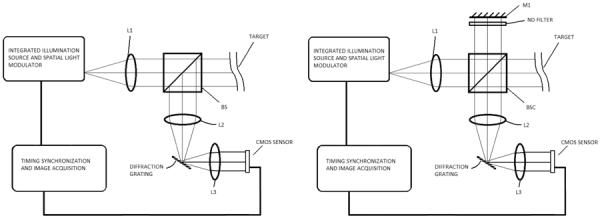
a. Left. Optical design schematic of a confocal multi-spectral imaging system. The rolling shutter of the CMOS sensor acts as a frequency filter with adjustable width and center frequency. Lens L1 is used to focus the DLP illumination onto the target, pellicle beamsplitter BS directs a portion of light return to the CMOS sensor, and lenses L2 and L3 adjust the image magnification and focus the image onto the sensor.
b. Right. Optical design schematic of a confocal Fourier domain OCT system. Lens L1 is used to focus the DLP illumination onto the target. Beamsplitter cube BSC directs a portion of light to the reference arm mirror M1 and to the target. Light reflected from M1 is combined with light returning from the target and directed to the CMOS sensor via lenses L2 and L3. The DLP illuminates the target with a series of points. A B-scan of the target is acquired every sensor frame, similar to parallel FD-OCT systems.
In an alternate operating mode of the spectroscopy configuration, the DLP is programmed to repeatedly illuminate only the first section of the target at 60 Hz. In the standard confocal configuration of Figure 2 only the portion of the field of view, corresponding to the first DLP illumination frame, would be visible. With a diffraction grating in the detection pathway, light returning from the target at one narrow wavelength band will be spatially and temporally overlapped with the rolling shutter. When the second DLP illumination frame begins, light returning from the target at a second wavelength will be matched to the rolling shutter as it continues to move across the sensor, creating a single dual-wavelength image.
Fourier-domain optical coherence tomography (FD-OCT) was performed by modifying the system in Figure 4a. A reference arm neutral density filter and mirror (M1) were added, and a beamsplitter cube (BSC) was used in the place of the pellicle, as shown in Figure 4b. FD-OCT is an imaging technique that measures the interference between light returning from the target and light that has undergone a known optical path delay. The interferogram is measured using a spectrometer and post-processed to yield a scattering depth profile at each transverse position on a target15. The ruled diffractive grating was switched to 1,200 grooves/mm, 500 nm blaze wavelength to more fully spread the green LED spectrum across the 1280 pixels of the sensor. Unlike the previous configurations described, the DLP is programmed to illuminate the target with a series of points rather than lines. The grating is set to disperse the spectral interferogram along the length of the rolling shutter. By matching the sequence of illumination points to the rolling shutter, a B-scan is acquired during each sensor frame. This approach is similar to parallel FD-OCT systems that use a 2D sensor array to acquire a B-scan every frame, but differs in that the rolling shutter is used to restrict mixing from adjacent illumination locations on the target16, 17. With a sensor frame rate of 20 Hz, and 55 A-scans per frame, the A-scan rate is 1.1 kHz. The green illumination channel was used for OCT imaging. As shown in Figure 1, its broad spectrum of approximately 39 nm FWHM centered at 525 nm permits a relatively high theoretical axial resolution of 3.1 μm. To acquire 3D image sets, B-scans were shifted perpendicularly from one frame to the next by applying a DLP pixel offset. The sensitivity and dynamic range were measured according to established OCT methods18.
3. RESULTS
3.1 Standard Confocal Imaging with the DLP Source
The DLP projection of a sequence of non-overlapping rectangular strips successfully followed the rolling shutter of the CMOS sensor and created a confocal image. Using the confocal imaging configuration of Figure 2, 60-frame test images of a stationary white card target were acquired at 0.5 msec and 1.5 msec pixel integration times. As expected, when adjusting the starting position of the strip sequence, or the width of the strips, the illumination was no longer overlapped with the rolling shutter aperture, resulting in lost image intensity across the field of view. A cross-sectional plot of the average intensity of a 10 pixel region of the card recorded by the CMOS sensor is shown in Figure 5 for integration times of 0.5 msec and 1.5 msec.
Figure 5.
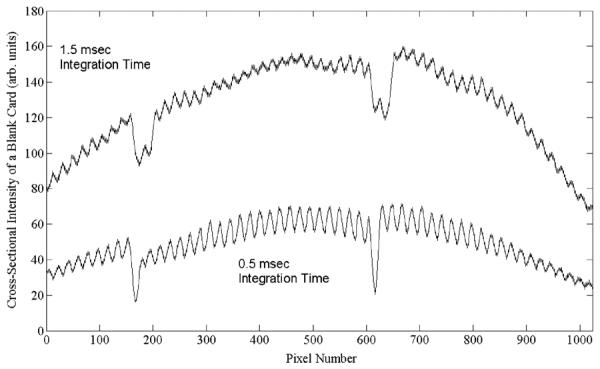
Cross-sectional intensity recorded by the CMOS sensor of a blank card target imaged with 0.5 msec (bottom) and 1.5 msec (top) integration times. Each sinusoidal peak corresponds to a DLP illumination strip on the target. The two dips in the data near pixels 170 and 615 correspond to the DLP off-time between frames. The 1.5 msec data have lower amplitude cross-sectional variation due to a wider shutter width, which performs less spatial filtering of the light return from the target.
The cross-sectional intensity plot illustrates the effect of using a spatial light modulator to simulate scanning by rapidly projecting a sequence of rectangular strips in discrete time slots. Each peak indicates a maximum spatio-temporal overlap between a strip projected onto the target and the rolling shutter at a conjugate image plane. The two dips in the data near pixels 170 and 615 correspond to the DLP off-time between frames. As expected, there are 24 maxima shown for one DLP frame, representing the 24 timeslots produced from the 3 8-bit input channels in the DLP's structured light illumination mode. There are a total of 55 peaks shown across the sensor, which agrees well with the 55.3 strips predicted from the DLP time slot specification.
As the spatio-temporal overlap between the strip and shutter is lessened, the charge accumulated for the pixel row decreases until the shutter begins to approach the next illumination strip in the sequence. The decreased intensity variation at longer integration times is due to a wider shutter width that is convolved with the DLP strip pattern. Although a wider shutter width will smooth out the cross-sectional intensity variations, including the dark zone caused by the DLP vertical blanking, it will also decrease the confocalilty of the imaging system. A more optimal solution is to decrease the strip width until it is less than the desired shutter width. Since the spatio-temporal position of the strips is constant with respect to the rolling shutter, the intensity variations shown in Figure 5 can be removed in post-processing by multiplying each pixel row by the inverse of the normalized intensity measured for a uniform scattering target.
An example of this gain correction was done on an image of a 1951 USAF resolution test chart target, shown in Figure 6, acquired with a 1.5 msec integration time. Horizontal and vertical line pairs are both clearly visible in Group 5, Element 2, indicating an optical image resolution of 27.8 μm.
Figure 6.
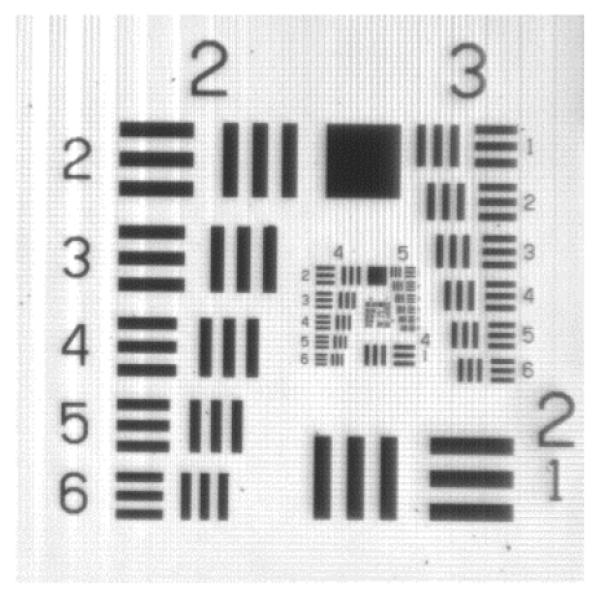
Image of a 1951 USAF resolution test chart target. Horizontal and Vertical line pairs are both clearly visible in Group 5, Element 1, indicating an imaging resolution of 27.8 μm.
The field of view was measured to be 13.5 mm wide by 16 mm high using millimeter paper as a target, which indicates a sensor pixel size of 13.2 μm at the target. With 55.3 strips across the field of view, each of which are 5 DLP pixels wide, each DLP pixel was calculated to be 48.8 μm wide at the target. Confirmation was obtained by translating a razor blade across the illumination provided by a single DLP pixel focused in the target plane. The full-width half-max of the illumination point was measured to be 50 μm. The time-averaged power of a 5×5 pixel spot that was kept on during all 24 time-slots was measured at the target to be 3.87 μW (green channel), indicating that only 158 nW average power is delivered to the target during each time slot for a 5×5 pixel section of the illumination strip.
3.2 Confocal In Vivo Imaging of the Retina
The confocal imaging system was adapted for imaging the retina as shown in Figure 3. Images were acquired at 20 Hz over 3 seconds with either red or green illumination using an integration time of 1.5 msec. The time-averaged power measured at the cornea for the entire field of view was 47.5 μW and 82.4 μW for the green and red channels, respectively. With a line-illumination geometry, these time-averaged powers are well-within ANSI safe exposure limits, with a safety factor greater than 100. Due to the higher illumination power and greater light return from the retina in the red region of the spectrum, the camera was typically aligned to subjects' pupils using the red channel. The red and green illumination channels were switched through software without loss of pupil alignment. Residual reflections from the ocular lenses (L6 in Figure 3) were removed by subtracting dark frames acquired with no subject eye in place.
Acquired retinal image sets were registered and averaged over 60 frames. Figures 7a and 7b show the optic nerve head of a dilated 28 year old male Caucasian subject using red and green illumination, respectively. The small vessel detail shown in the green images is consistent with that visible in retinal images taken with the GDx Scanning Laser Polarimeter (Carl Zeiss Meditec). Retinal images of the same subject and eye without pupil dilation were acquired with both the green and red channels, but pupil constriction reduced the amount of light return, resulting in a low signal to noise level.
Figure 7.
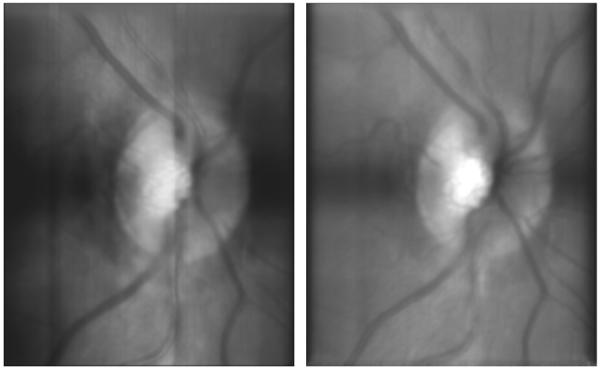
Confocal retinal images taken of a dilated 28 year old male Caucasian using red illumination (left) and green illumination (right). Greater contrast of the small vessels near the optic nerve head in the image obtained with green illumination is due to the absorption spectrum of blood.
3.3 Dual Wavelength Fluorescence Imaging
The alignment of the dual wavelength imaging system was performed by alternately imaging a card target with the blue and green illumination channels. The diffraction grating was set to obtain a partial image near 460 nm during the first DLP frame, and near 515 nm during the second. A card with small text was partially coated with a fluorescein sodium solution. Fluorescein is a fluorescent dye commonly used in ophthalmic practices, and can be excited using blue light. The emission spectrum is in the green and yellow visible wavelength bands.
Figure 8 shows 60 frame averages of an image of the card using blue (left) and green (right) illumination. The right-most section of the image shows the ~460 nm light return from the target, while the middle section shows the ~515 nm light return from the same section of the target. In the case of the blue illumination image (8a), the region coated with fluorescein dye has a fluorescent emission near 515 nm, which is picked up in the middle section of the image. The left-most section of the image, corresponding to light return near 570 nm, remains dark.
Figure 8.
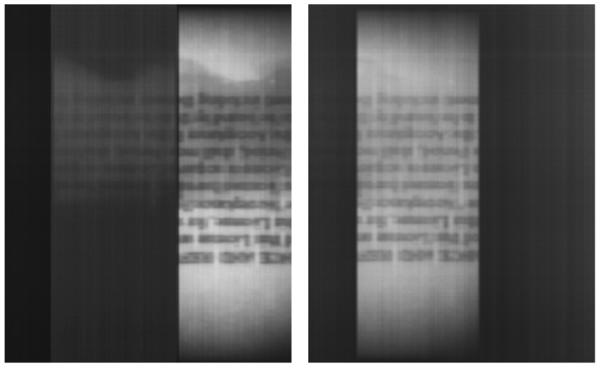
Left: Dual wavelength image of a card partially coated with fluorescein dye using blue illumination. The central rectangular section of the image is light return at ~515 nm. A dim fluorescent emission is visible in the central section. The right-most rectangular section of the image is light at ~460 nm, with darker sections showing the location of the dye.
Right: Dual wavelength image of a card partially coated with fluorescein dye using green illumination. The central rectangular section of the image is light return at ~515 nm. There is no blue light return from the card, resulting in a dark right-most rectangular section of the image.
The dual-wavelength imaging approach requires a very narrow shutter width to limit the bandwidth of light detected. Since each wavelength is spatially offset on the sensor, the contribution from additional wavelengths in a continuous spectral return from the target will increasingly degrade the image in a manner similar to the effect of motion blur. The above images were taken with a 0.5 msec integration time, and a slight blurring of the text is apparent. Since the image degradation is known to occur due to the overlap of spatially offset images, commonly used image deconvolution techniques should be effective in restoring image quality.
3.4 Fourier Domain Optical Coherence Tomography (FD-OCT) Imaging
To perform FD-OCT, a reference arm and 1,200 grooves/mm diffractive grating were added to the optical system, as shown in Figure 4b. The sensor was oriented so that the spectral interferogram is focused along the length of the rolling shutter and is measured for each point on the target. To calibrate the sensor pixels to optical frequency, a mirror was mounted to a translation stage and used as a target. The reference and sample arm mirrors were aligned to maximize the interferometric fringe contrast, and the sinusoidal fringe frequency was observed to change when altering the path delay between the interferometer arms, as expected. The interference fringes were recorded for a physical path delay of 68 μm, shown in Figure 9a. With a physical path delay of 68 μm, the interference fringe period is 1.103 THz. With 33 fringe periods in Figure 9a, ~67 nm is shown on the sensor with a center wavelength of ~525 nm. The pixel number of the peak and troughs of the interferogram were mapped to the theoretical fringe frequency and fitted with a polynomial to convert between pixels and optical frequency. A Fourier transform of the interferogram produced the axial point-spread function, which was fitted with a Gaussian, yielding a full-width half maximum axial resolution of 4.0 μm, shown in Figure 9b. The resolution was slightly higher than predicted by theory, which is likely the result of uncertainty in the physical path delay used for calibration.
Figure 9.
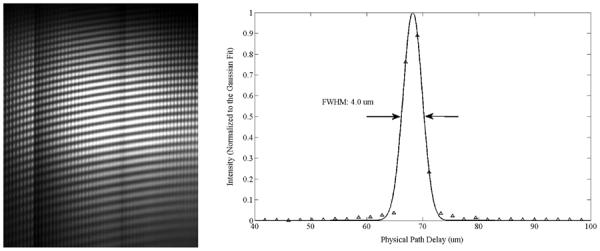
Left. Spectral interferogram using mirrors in the reference and sample arms of the interferometer with a physical path delay of 68 μm. The optical wavelength and lateral position on the target proceed along the y-axis and x-axis, respectively. The DLP strips are shown as circular spots proceeding left-to-right with the rolling shutter.
Right. The axial point spread function of the OCT system using a DLP source, with 4.0 μm depth resolution.
With 67 nm spread across 1280 sensor pixels, the average frequency resolution is 0.052 nm. At a center wavelength of 525 nm, the system will experience aliasing at path delays greater than 1.33 mm. The sensitivity was measured by adding a reflective neutral density filter into the sample arm, which introduced a dual-pass attenuation of 20 dB. The sensitivity of a single frame was found to be 51.1 dB, which was increased to 59.0 dB after averaging 20 frames to lower the noise floor. A 43.3 dB dynamic range was calculated from the maximum signal to noise ratio attainable with mirrors in the sample and reference arms. By incrementing the position of the lateral scan after each sensor frame, a 3D data set of a 1951 USAF resolution test chart target was recorded.
4. CONCLUSIONS
A Pico DLP Development Kit has been integrated into a novel confocal imaging system. By rapidly projecting a series of rectangular strips onto a target, the DLP simulates line-scanning. The strips are temporally and spatially overlapped with the rolling shutter of a 2D CMOS sensor, which spatially filters the light returning from the target. Three imaging configurations were investigated with this approach: confocal retinal imaging, dual-wavelength fluorescence imaging, and Fourier-domain optical coherence tomography imaging.
The use of the 3 channel LEDs and micromirror array integrated in the DLP provided several advantages over existing laser scanning confocal technology. Pico DLPs are compact, robust, and cost-effective, making them strong candidates for use in portable devices outside of controlled clinical and research environments. They are controlled by software, which permits real-time adjustments to the output pattern in response to image feedback, or depending on the imaging modality desired. For OCT imaging, their LEDs provide wide bandwidths, enabling high axial resolutions. Finally, their implementation with the rolling shutter of CMOS sensors avoids descanning and any associated hardware modifications, permitting simple integration into an imaging system.
The primary drawback encountered with the DLP was its low light intensity per pixel when operating in structured light mode. This limited the amount of light return from the retina and fluorescent targets, resulting in the use of a wider than optimal confocal aperture width. The low light intensity per pixel was also the cause of the relatively poor FD-OCT sensitivity, which is insufficient for several in vivo biomedical applications. Fortunately, a major driver in the commercial development of compact DLPs is increasing their output brightness to enable their use in ambient light conditions.
A secondary limitation of the DLP was its speed relative to the rolling shutter. To maintain spatial and temporal overlap, only 55 rectangular strips could illuminate the target during each frame exposure of the sensor, resulting in a relatively wide illumination line. Fortunately, this limitation may be resolved as the resolution of commercial DLPs is increased to enable high definition video playback. With growing micromirror array sizes that continue to operate at a video frequency of 60 Hz, the DLPs will be driven at higher speeds. Also, with registry-level access to the camera board, the horizontal blanking could be used to slow down the speed of the rolling shutter and accumulate more light, while maintaining a constant shutter width.
The use of a spatial light modulator to simulate line scanning in confocal imaging with rolling shutter detection permits large reductions in imaging system size, cost, and complexity for a range of imaging applications, while the key limitations have solutions that are well-aligned with the goals of DLP commercial development for consumer presentation devices.
REFERENCES
- [1].Key differences between rolling shutter and frame (global) shutter. [Accessed 12/17/11];Point Grey Research, Inc. Knowledge Base. . http://www.ptgrey.com/support/kb/index.asp?a=4&q=115.
- [2].CCD vs. CMOS. [Accessed 12/17/11];Teledyne DALSA. . http://www.teledynedalsa.com/corp/markets/CCD_vs_CMOS.aspx.
- [3].Eastman Kodak Company Application Note Revision 3.0 MTD/PS-0259. 2011. Kodak Image Sensors: Shutter Operations for CCD and CMOS Image Sensors. [Google Scholar]
- [4].Ait-Aider O, Andreff N, Lavest JM, Martinet P. ECCV 2006, Part II, LNCS 3952. 2006. Simultaneous Object Pose and Velocity Computation Using a Single View from a Rolling Shutter Camera; pp. 56–68. [Google Scholar]
- [5].Zhao Y, Elsner AE, Haggerty BP, VanNasdale DA, Petrig BL. Confocal Laser Scanning Digital Camera for Retinal Imaging. Invest. Ophthal. Vis. Sci. 2007;48:4265. [Google Scholar]
- [6].Elsner AE, Petrig BL. Laser Scanning Digital Camera with Simplified Optics and Potential for Multiply Scattered Light Imaging. US Patent #7,831,106. 2007
- [7].Muller MS, Elsner AE, VanNasdale DA, Haggerty BP, Peabody TD, Gustus RC, Petrig BL. Low Cost Retinal Imaging for Diabetic Retinopathy Screening. Invest. Ophthal. Vis. Sci. 2009;50:3305. [Google Scholar]
- [8].Ozawa GY, Litvin T, Cuadros JA, Muller MS, Elsner AE, Gast TJ, Petrig BL, Bresnick GH. Comparison of Flood Illumination to Line Scanning Laser Opthalmoscope Images for Low Cost Diabetic Retinopathy Screening. Invest. Ophthal. Vis. Sci. 2011;52:1041. [Google Scholar]
- [9].Petrig BL, Muller MS, Papay JA, Elsner AE. Fixation Stability Measurements Using the Laser Scanning Digital Camera. Invest. Ophthal. Vis. Sci. 2010;51:2275. [Google Scholar]
- [10].Muller MS, Elsner AE, VanNasdale DA, Petrig BL. Multiply Scattered Light Imaging for Low Cost and Flexible Detection of Subretinal Pathology. OSA Tech. Digest, FiO FME5. 2009 [Google Scholar]
- [11].Muller MS, Elsner AE, Petrig BL. Inexpensive and Flexible Slit-Scanning Confocal Imaging Using a Rolling Electronic Aperture. OSA Tech. Digest, FiO FWW2. 2008 [Google Scholar]
- [12].Muller MS. Confocal Imaging Device Using Spatially Modulated Illumination with Electronic Rolling Shutter Detection. US Patent Pending, Application Serial #13/302,814. 2011
- [13].Texas Instruments, Inc. Literature Number DLPU002A. 2010. DLP Pico Chipset v2 Programmer's Guide. [Google Scholar]
- [14].Texas Instruments, Inc. Application Report DLPA021. 2010. Using the DLP Pico 2.0 Kit for Structured Light Applications. [Google Scholar]
- [15].De Boer JF. Spectral/Fourier Domain Optical Coherence Tomography. In: Drexler W, Fujimoto JG, editors. Optical Coherence Tomography: Principles and Applications. Springer; 2008. pp. 147–173. [Google Scholar]
- [16].Grajciar B, Pircher M, Fercher AF, Leitgeb RA. Parallel Fourier domain optical coherence tomography for in vivo measurement of the human eye. Opt. Exp. 2005;13(4):1131–1137. doi: 10.1364/opex.13.001131. [DOI] [PubMed] [Google Scholar]
- [17].Grajciar B, Lehareinger Y, Fercher AF, Leitgeb RA. High sensitivity phase mapping with parallel Fourier domain optical coherence tomography at 512 000 A-scan/s. Opt. Exp. 2010;18(21):21841–21850. doi: 10.1364/OE.18.021841. [DOI] [PubMed] [Google Scholar]
- [18].Leitgeb R, Hitzenberger CK, Fercher AF. Performance of fourier domain vs. time domain optical coherence tomography. Opt. Exp. 2003;11(8):889–894. doi: 10.1364/oe.11.000889. [DOI] [PubMed] [Google Scholar]


