

Abstract
The rate of exchange of urea across the membranes of human erythrocytes (red blood cells) was quantified on the 1-s to 2-min timescale. 13C-urea was hyperpolarized and subjected to rapid dissolution and the previously reported (partial) resolution of 13C NMR resonances from the molecules inside and outside red blood cells in suspensions was observed. This enabled a stopped-flow type of experiment to measure the (initially) zero-trans transport of urea with sequential single-pulse 13C NMR spectra, every second for up to ∼2 min. Data were analyzed using Bayesian reasoning and a Markov chain Monte Carlo method with a set of simultaneous nonlinear differential equations that described nuclear magnetic relaxation combined with transmembrane exchange. Our results contribute to quantitative understanding of urea-exchange kinetics in the whole body; and the methodological approach is likely to be applicable to other cellular systems and tissues in vivo.
Introduction
Our aim was to quantify the kinetics of the transmembrane exchange of urea in human erythrocytes using recently available high-sensitivity 13C nuclear magnetic resonance (NMR) spectroscopy, and a contemporary multiparameter estimation method.
The 13C NMR spectrum of urea shows partial resolution of the resonances from the molecules inside and outside human erythrocytes (red blood cells; RBCs) in suspension (1). This feature was previously used with 13C NMR band-shape analysis to study the kinetics of membrane transport of 13C-urea as it occurs under conditions of equilibrium exchange. Thus, tracer exchange was measured against a background of equal concentrations of urea on either side of the cell membrane. The analysis of this situation does not allow estimation of the initial rate of influx (or efflux), which can only be measured when there is no solute on the opposite (trans) side of the membrane (2). The latter measurement is technically demanding, because a type of stopped flow analysis is required with a recording time faster than the kinetic process. This has not been possible before with 13C-labeled compounds as the sensitivity for detecting 13C is very low, requiring signal averaging over many seconds or minutes to obtain reasonable signal/noise in the spectrum. However, with the advent of a method for delivering dynamically nuclear-polarized 13C-labeled molecules in aqueous media (rapid dissolution dynamic nuclear polarization, RD-DNP) whereby the sensitivity for detection is enhanced ∼10,000-fold (3), 13C NMR spectra are obtainable from a single free induction decay. This makes possible the estimation of enzymatic reaction rates on the 1-s timescale (4–7); and we show here that this can also apply to the membrane transport of 13C-urea.
Others have carried out phenomenological kinetic analyses of membrane transport using 13C-RD-DNP, but to our knowledge the kinetic characterization of a membrane transport protein has not been done before. Specifically, by combining 13C and 31P NMR data with a relaxation-kinetic model, Harris et al. (8) concluded that the conversion of hyperpolarized pyruvate to lactate in breast cancer cells (T47D) is determined by the rate at which the pyruvate crosses the cell membrane. This outcome was discussed further by Witney et al. (9); and a recent study compared the data fitting using different kinetic models based on first-order rate constants with either two- or three-pool, uni- or bidirectional chemical reactions (10).
The normal adult human (mass ∼70 kg) in nitrogen balance produces ∼30 g of urea d−1. This is synthesized primarily in the liver, and being highly water-soluble, it is rapidly excreted into the urine. It has long been known that RBCs are freely permeable to urea and that urea does not serve as an osmotic-support solute in suspensions of these cells. In other words, the membrane is permeable to urea with a rate of exchange comparable to that of water (11,12), making its zero-trans transport measurement challenging due to the rapidity of the process. Whether this situation pertains to other cell types, including neoplastic cells, has not been fully explored; and if a quantitative 13C membrane-flux-measuring method for urea and other solutes that may show a split-peak effect could be developed, it/they might serve as indicators of cell pathology, in vivo.
It can be estimated that, at rest, 20–25% of blood flow (∼1.1 L min−1) in the normal adult human is to the kidneys, and that at any given time 10% of that flow is via the vasa recta into the renal medulla, where the glomerular filtrate is concentrated (13,14). The latter is achieved by a countercurrent exchange mechanism that involves a centripetal concentration gradient of urea, with the interstitial urea concentration possibly reaching ∼1.2 M at the tip of the loops of Henle. Thus RBCs flowing through capillaries in this tissue-zone are exposed to a massive transmembrane urea concentration gradient over a time course of ∼20 s. If the RBC plasma membranes were not freely permeable to urea, given the small molecular size and electrical neutrality of urea, it would leak into the cells and upon return to the normal circulation, a urea-loaded RBC would rupture due to the osmotic gradient across its plasma membrane. Because the mean circulation time back to the left ventricle of the heart is ∼1 min, each RBC is exposed to the renal medulla, on average, every 40 min or ∼36 times a day. The evolved solution to this problem has been the selection of a transport system that renders the RBC plasma membrane transparent to urea via at least one selective transport protein (15).
In our quest to characterize the function of the urea transporter, we developed experimental methods and data analysis that led to estimates of the Michaelis-Menten steady-state kinetic constants (counterparts of conventional enzyme kinetics) of the transporter, namely the maximal velocities and Michaelis constants (substrate concentrations at half-maximal velocity). These findings have significance in estimating tracer (labeled urea) dilution kinetics throughout the blood and then the whole body.
Materials and Methods
RBCs
These experiments were approved under regulation No. NUS-IRB 12-199 by the local Institutional Review Board from the National University of Singapore. Erythrocytes were obtained from healthy donors and washed in isotonic saline (154 mM NaCl), with osmolality measured to be 290 mOsmol kg−1 with a Vapro5600 vapor pressure osmometer (Wescor, Logan, UT) with 10 mM glucose. The cells were then centrifuged (10 min, 4°C, 3000 g) and the supernatant and buffy coat were aspirated. This operation was repeated twice, followed by bubbling with CO (to render the hemoglobin into a stable diamagnetic state) for 15 min. The cells were then washed twice with a hypertonic solution (300 mM NaCl and 10 mM glucose; the osmolality was measured to be 583 mOsmol kg−1 exclusive of the glucose) to shrink the cells and hence raise the intracellular protein concentration to increase the transmembrane peak splitting (see below) (1). After the final wash, the hematocrit (Ht) was adjusted to ∼90%.
RD-DNP
13C urea was dissolved in glycerol at a concentration of 8 M with 15 mM Ox063Me (Oxford Instruments, Oxford, UK) trityl radical, which is used to transfer magnetic polarization from the electrons to the nuclei. To shorten the relaxation time, 2.0 mM DOTAREM [Gd3+2-(4,7,10-tris(carboxymethyl)-1,4,7,10-tetrazacyclododec-1-yl)acetate] was added (Guerbet Asia Pacific, Tsuen Wan, N.T., Hong Kong) and 35 μL of this mixture was introduced to the hyperpolarizer and rapidly cooled to ∼1.2 K.
The HyperSense (Oxford Instruments) instrument has a 3.35 T superconducting magnet and a 100 mW microwave source. The frequency used for exciting the electron-spin transitions was 94.113 GHz. After ∼1 h of radio-frequency (RF) irradiation, the sample was rapidly dissolved under automatic control with 4 mL of hypertonic phosphate-buffered saline (PBS) (pH 7.4, 583 mOsmol kg−1) that matched the osmolality of the RBC washing medium.
NMR spectroscopy
13C NMR spectra were recorded at 100.3 MHz, on an UltraShield 400 MHz spectrometer fitted with an Avance III console (Bruker, Karlsruhe, Germany). A 10-mm broadband-observe probe was used to record the spectra. The temperatures were calibrated using ethylene glycol and methanol samples and set to 310 K or 293 K inside the NMR tube. A 10-mm O.D. NMR tube was introduced to the spectrometer magnet with a Teflon (E. I. du Pont de Nemours, Wilmington, DE) line connected to a syringe to add or remove solutions while the tube was seated inside the magnet. This Teflon line was thermostated within a double-envelope Perspex tube placed inside the bore of the magnet with water flow from a thermostated bath to give the required temperature at the end of the outlet tube (see Section S1 in the Supporting Material). The magnetic field homogeneity was adjusted on a sample of PBS. A 2-mL suspension of RBCs was added to a 10-mm NMR tube and thermally equilibrated before hyperpolarized 13C urea was injected into the sample via the thermostated Teflon tube. The total sample volume was always 4 mL so 1 mL of buffer was added to 2 mL of cells when using 1 mL of hyperpolarized urea solution. The buffer was added with or without 40 mM unlabeled urea. Immediately after the injection, recording of the spectral time course was begun. The RF pulse sequence used a 1-μs nonselective (hard) pulse of 66 W from the 13C channel, invoking a nutation angle (flip angle) of ∼4°. A spoiling magnetic-field gradient pulse was applied during the relaxation delay to remove any residual transverse magnetization between transients. The recycle time for each transient was set to 1 s; and 128 spectra were recorded in a pseudo two-dimensional experiment. All experiments were performed at least in duplicate.
Data analysis
NMR data were processed using the software TOPSPIN Ver. 3.0 (Bruker), and spectra were extracted as a text file that was read into a MATLAB software program (The MathWorks, Natick, MA). The data sets obtained at 20 and 37°C were preprocessed to align spectra (systematic drift or variation was evident in sequences of RD-DNP 13C NMR spectra). Then each data set was analyzed independently using the band-target entropy minimization method (17,18). Preliminary analysis identified a third smaller band in each data set, and therefore, for this data, two-peak and three-peak curve fitting models were constructed for the data sets at 20 and 37°C. The general and adaptable Pearson band-shape model (18) was used for each band and it was assumed that the band shapes and position of each maximum amplitude remained constant for the duration of each time course of spectra. Therefore, only a small number of parameters were needed to be optimized; specifically, two or three sets of band-shape parameters and two or three positions of each maximum were constrained not to vary from spectrum to spectrum, and finally the set of intensity values for each band was fitted. These were obtained by minimizing the sum of the squares of the residuals between simulated data and the experimental data. The signal intensities obtained from this postprocessing of the data were then used as input for fitting the transport model to the data using a program written in Mathematica (19), based on those described in Kuchel et al. (20) and Puckeridge et al. (21,22).
Theory of Methods—Model
Implications of the excited state of the nuclei
In constructing a kinetic model to simulate and fit the 13C-urea transport data, three important considerations were:
-
1.
To a very good approximation, the signals arise from the hyperpolarized 13C-atoms only;
-
2.
They relax according to an intrinsic relaxation time constant T1; and
-
3.
All solute fluxes depended on the total concentration of the solute and not only on the detected species (in this case the hyperpolarized 13C atoms).
The unidirectional conversion rate constant, 1/T1, is potentially able to be estimated in separate experiments (23); it characterizes the conversion of the labeled to the unlabeled species and accordingly rate equations must be written for each label-state of the various species.
In the NMR experiment, the signal-sampling RF pulse nutates a small fraction of the longitudinal magnetization into the transverse plane for detection (24), and it is lost thereafter. The removal of this magnetization (the amount depends on the cosine of the pulse angle) in discrete steps during the time course of spectral acquisition must also be expressed in the model function. See Pagès and Kuchel (25) for a detailed description of the different parameters that are considered when constructing such a kinetic model.
Overall reaction scheme
Fig. 1 shows the basic reaction scheme that describes the exchange of hyperpolarized urea, denoted by U∗, and its nonhyperpolarized counterpart, U, between the extra- and intracellular compartments in an RBC suspension. The differential equations that describe the kinetics of this reaction scheme were written using the conventional principle of mass action (26,27).
Figure 1.

Schematic representation of the exchange of hyperpolarized and nonhyperpolarized 13C-urea across the plasma membrane of an RBC. The velocities (reaction rates) are denoted by ve and vi for the extra-to-intracellular direction and vice versa, respectively; and the longitudinal relaxation rate constants for 13C-urea in the extra- and intracellular compartments are denoted by 1/T1e, and 1/T1,i, respectively.
If the system were in homogeneous free solution, its time dependence could be described as follows, where the square brackets denote concentration (mol L−1) and the subscripts e and i denote extra- and intracellular, respectively:
| (1) |
The rate constant that characterizes the transport in the forward direction is denoted by v†e (an abbreviation for ve→i; units mol L−1 s−1) and in the reverse direction by v†i, while the longitudinal relaxation time constants in the respective compartments are denoted by T1,e and T1,i.
Account must be taken of the partitioning of the urea into the two compartments, extra- and intracellular (if there were more compartments, more equations would be required; see Discussion); therefore, it is expedient to write the differential equations in terms of mole amounts and not concentrations. Once the amounts are known at any time, by numerical integration of the differential equations, the concentration in each compartment can be calculated by knowing the volume of the compartment. This approach caters for changes in compartment volume (cell volume changes) that can occur in these types of experiments (22,28).
Four-state transmembrane carrier
Fig. 2 shows the reaction scheme for a simple four-state carrier in which both the loaded and unloaded carriers exchange binding sites (this corresponds to a conformational change, or isomerization, of the protein) between the interior and the exterior faces (and vice versa) of the plasma membrane (29).
Figure 2.

Representation of a four-state transmembrane-exchange carrier. The carrier protein is denoted by C, and the subscripts e and i refer to the extra- and intracellular compartments, respectively; similarly for urea (U) in each compartment.
The reaction scheme has corresponding steady-state rate equations for influx and efflux of the solute. Such steady-state equations can be derived by using symbolic algebraic programs such as Rateequationderiver written in the software Mathematica, and described in Mulquiney and Kuchel (28). Thus we obtained the expression for the velocity, or rate, of influx, ve,
| (2) |
where [Ctot,e] is the total concentration of the carrier in the membrane, averaged over the volume of the external compartment; this assumes rapid solute mixing on a timescale much smaller than for the NMR measurement, i.e., subsecond. The values [Ue] and [Ui] are the urea concentrations in the extra- and intracellular compartments, respectively, and k±i, i = 1,…,4 are the unitary rate constants that define the reactant flux via the various reactions. The efflux velocity, vi, is related to the influx velocity via the ratio of the two urea concentrations and the overall equilibrium constant, as follows:
| (3) |
thus,
| (4) |
By deriving expressions for the relationships between the unitary rate constants and the steady-state parameters, Eq. 2 can be written as
| (5) |
where Km,e and Km,i are the respective Michaelis constants for extra- and intracellular urea, K2,e is a cross term that characterizes and distinguishes a pore from a carrier (29), and kcat,e is the turnover number for the outward facing carrier. The expressions for the steady-state parameters given in terms of the unitary rate constants are
| (6) |
| (7) |
and
| (8) |
Similarly, the expression for steady-state efflux and the details of the steady-state parameters in terms of the unitary rate constants are
| (9) |
| (10) |
| (11) |
and
| (12) |
The rate constants (with superscript daggers) v†e and v†i in Fig. 1 and Eq. 1 are given by the expressions for ve and vi without the [Ue] or [Ui] in the respective numerator.
Simplification—elimination of the cross term
The cross term in the rate expressions (Eqs. 5 and 9), i.e., those containing [Ue][Ui], describes a nonlinear (degree 2) response to substrate concentration that is over and above the usual rectangular hyperbolic response of a conventional Michaelis-Menten-type enzyme. However, if the rates of interchange between the extra- and intracellular carriers are much greater than the on- and off-rates of urea from the carrier, i.e., {k4, k−4, k2, k−2} >> {k1, k−1, k3, k−3}, then it is readily seen that Eqs. 5 and 9 reduce to the classical product-inhibited Michaelis-Menten equation. (This can be seen by supposing that the values of the rate constants in each set are the same, so K2,e, and K2,i take on values of the same order of magnitude as k−3/k4 and k1/k−4, and the larger the value of k4 or k−4, the smaller are the values of K2,e, and K2,i.) In other words, if the exchange rate of the carrier (both loaded and unloaded) is high, the rate equation becomes that of a product-inhibited Michaelis-Menten type,
| (13) |
where Km,i and [Ui] are the counterparts of the product inhibition constant and product concentration, respectively; and by symmetry the velocity of the reverse overall reaction is described by
| (14) |
These carrier equation forms were used to analyze [2,19F] 2-deoxy-d-glucose exchange in human RBCs using 19F NMR spectroscopy (30).
Carrier concentration
We interpret the meaning of the total concentration of the membrane carrier as follows: η is the number of carrier molecules per RBC (∼14,000 [RBC]−1) (31); n is the number of RBCs in the sample namely Vsample Ht/MCV; MCV is the mean cell volume (86 fL) (32); and N is Avogadro’s number.
In the extracellular volume, therefore, the effective total concentration of the carrier is
| (15) |
where Ve is the extracellular volume. The corresponding expression for [Ctot,i] has Vi instead of Ve in Eq. 15. Furthermore, if the equilibrium constant of the exchange reaction is Keq = 1, then a mathematically useful pair of relationships is
| (16) |
| (17) |
Thus, the flux in either direction across the membrane is characterized by only four independent steady-state kinetic parameters, kcat,e, Km,e, K2,e, and ρ = Km,e/Km,i = K2,e/ K2,i. (To check the analysis, we multiply Eq. 14 by Ve and Eq. 17 by Vi and obtain the flux in mol s−1 in either direction across the membrane; at equilibrium [Ue] = [Ui], making ve = vi, as required.)
Overall, this section enables the interpretation of the estimates of the maximal velocities in terms of the number of transporters per cell, and their turnover number.
Markov chain Monte Carlo algorithm
The fitting of the model to the experimental data used a Bayesian type of analysis (33,34). In this approach each model Hi (H stands for hypothesis) is assumed to have a vector of parameter values w. A model is defined by its functional form and two probability distributions:
-
1.
A prior distribution P(w|Hi) that states which values the parameters can plausibly take; and
-
2.
The predictions P(D|w, Hi) that the model makes about the data when w is a particular set of values (35).
Prior information in this work was that the T1 of 13C-urea outside the RBCs in the suspension was not larger than that of 13C-urea in PBS alone, 44 s (23); and the T1 of the intracellular 13C-urea was smaller than that of extracellular 13C-urea. If any of these conditions were violated in the process of sampling parameter space by using the Markov Chain Monte Carlo (MCMC) method then the probability of this parameter set was assigned the value zero. The Metropolis-Hastings MCMC algorithm (36,37) yielded estimates of mean values and standard deviations of the parameters (38–40). The program was implemented in the software Mathematica (19) and has been described in detail (20–22).
Duplicate experiments were analyzed simultaneously with initial estimates of the fitted parameters entered into the program, and sampling of parameter space was performed with 25,000 iterations with maximum incremental steps of the various values of 1.0%. Tables 1 and 2 summarize the floated parameters and their estimates, respectively.
Table 1.
Parameters used to fit the experimental data with the Bayesian-MCMC approach
| Description | Remark |
|---|---|
| Maximum parameter increment | 1.0% |
| Number of iterations | 25,000 |
| Prior constraints | All parameters >0, T1,e < 44 s,a and T1,i < T1,e |
| RF pulse angle | 4° |
| Delay between urea addition and start of the experiment | As measured for each experiment (between 2 and 5 s) |
| Cutoff from burn-in period | 30% |
T1 value of 13C urea in PBS at 400 MHz (23).
Table 2.
Average values of the floated parameters after the Bayesian-MCMC analysis and estimates of Kapp,eq
| Temperature |
20°C |
37°C |
||||
|---|---|---|---|---|---|---|
| Volume of added hyperpolarized urea | 2 mL | 1 mL | 1 mL + cold urea | 2 mL | 1 mL | 1 mL + cold urea |
| T1,e (s) | 14.4 ± 0.3 | 32 ± 4 | 19 ± 3 | 32 ± 4 | 41 ± 2 | 39 ± 3 |
| T1,i (s) | 13.0 ± 0.6 | 3.1 ± 0.1 | 4.5 ± 0.5 | 10 ± 1 | 9.1 ± 0.3 | 9.2 ± 0.5 |
| Km,e (mmol L−1) | 42 ± 5 | 48 ± 10 | 27 ± 4 | 38 ± 10 | 33 ± 8 | 35 ± 10 |
| Km,i (mmol L−1) | 11 ± 2 | 12 ± 3 | 15 ± 5 | 14 ± 4 | 18 ± 5 | 30 ± 10 |
| Kapp,eq (mmol L−1) | 141 | 146 | 106 | 130 | 80 | 76 |
| Vmax,e (mmol L−1 s−1) | 5.8 ± 0.7 | 33 ± 2 | 18.2 ± 0.9 | 22 ± 3 | 16 ± 1 | 18 ± 2 |
Results
Hyperpolarized 13C-urea injected into RBC suspensions
Fig. 3 shows a typical NMR spectrum of hyperpolarized 13C-urea in the presence of shrunken RBCs. The two partially resolved resonances are from the extra- (larger chemical shift) and intracellular (smaller chemical shift) urea (1). The resolution between both signals was incomplete, so the spectra were numerically deconvoluted as described in Materials and Methods (18,41). All NMR experiments performed at the same temperature were deconvoluted initially without prior knowledge or assumptions about the number of resonances.
Figure 3.

(a) Experimental and deconvoluted 13C NMR spectrum after addition of 2 mL of hyperpolarized 13C-urea (70 mM) into 2 mL of RBCs (Ht = 95%) at 37°C. The signal deconvolution was performed by using a three-peak model. (b) Individual components of the deconvoluted experimental spectrum. To see this figure in color, go online.
Spectral deconvolution
The best fits, across a complete data set recorded at a given temperature (i.e., five and six experiments at 37 and 20°C, respectively) were obtained by using a three-peak model for which two of the peaks perfectly overlapped the extra- and intracellular resonances. The deconvoluted spectra overlapped the experimental data (Fig. 3 a) almost perfectly, and only a minor frequency shift was observed between the fitted and experimental signals. The line-width of the third deconvoluted resonance was significantly greater than the other two and had a chemical shift between them at 37°C, and it was overlapped by the extracellular peak in the spectra recorded at 20°C. The area of the residual after fitting was small, as illustrated in Fig. 3 b. The peak areas obtained from the deconvolutions represented the evolution of the amounts of urea in each compartment during the time course. Because the unknown signal had the same chemical shift as the extracellular urea in experiments done at 20°C, we deemed it to be part of the extracellular pool (see Discussion).
Fig. 4 shows the quantity (obtained from the relative-area estimates) of the intra- and extracellular hyperpolarized urea after injecting different initial amounts of hyperpolarized 13C-urea. Whereas the extracellular amounts varied from one experiments to the next, the maximum 13C-urea signal from inside the cells became almost the same in all experiments.
Figure 4.
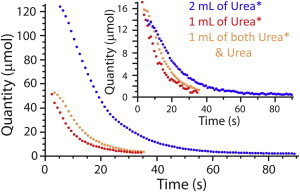
Evolution of the amount of hyperpolarized 13C-urea in 2 mL of RBCs at 20°C as a function of the quantity of added hyperpolarized (denoted Urea∗) or unlabeled (denoted Urea) 13C-urea. The main plot shows the evolution of the amount of extracellular hyperpolarized 13C-urea; (inset) amount of intracellular hyperpolarized 13C-urea. To see this figure in color, go online.
Model fitting
The complete four-state model was fitted to the signal areas obtained from the deconvolutions. Although the fittings of the experimental data were statistically satisfactory (fitted well visually), we did not obtain consistent estimates of the steady-state kinetic parameters. In other words, even the robust MCMC method could not handle the low sensitivity of the fitting to values of the cross-constant, K2,e. Low sensitivities of simulated time courses to changes in the value of this parameter are shown in the Section S4 in the Supporting Material. Almost no change in signal evolution trajectory was seen when K2,e was varied by five orders of magnitude. Therefore we mathematically reduced the initial model and fitted the data by concluding that protein isomerization is very fast relative to the binding and dissociation steps of the reaction (see above), thus leading to a rate equation that is identical to the product-inhibited Michaelis-Menten equation (Eqs. 13 and 14). Fig. 5 shows representative data fitting for each of 25 and 37°C, and Table 2 summarizes the parameter estimates. All fitted data sets are shown in Section S3 in the Supporting Material.
Figure 5.
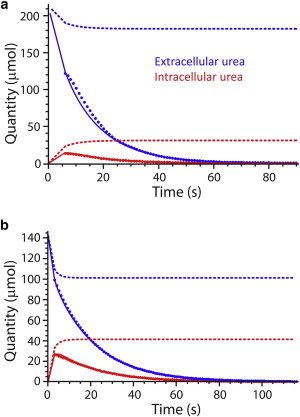
Addition of 2 mL of hyperpolarized urea to 2 mL of RBCs at (a) 20°C; and (b) 37°C. Data points were obtained from the deconvolution of the experimental NMR spectra. (Solid and dashed lines) Evolution of the hyperpolarized and total species (both hyperpolarized and nonhyperpolarized) obtained after the MCMC fitting, using the fast-isomerization carrier model. To see this figure in color, go online.
Discussion
Spectral deconvolution
Previous estimates of the rate of urea transport into RBCs (either by 13C NMR or by 14C radioactivity measurements) were carried out under conditions of equilibrium exchange (1,11,42). By using hyperpolarized urea, we were able to study the system when it was initially under nonequilibrium conditions, on the 1-s timescale. In other words, it was initially under zero-trans conditions (2). To enhance the resolution of the two 13C NMR resonances the RBCs were osmotically shrunk using buffer conditions that we had used previously (1). However, the NMR spectral resolution is still incomplete, so we used the band-target entropy minimization method deconvolution algorithm that has no preconceptions about the number of peaks and their relative areas; our conclusion after studying systematic deviations of fitting the model to various data sets was that three peaks best described the data. Two of the fitted peaks overlapped with those of extra- and intracellular urea whereas the third, broader one, lay between both signals for the data recorded at 37°C; but it was overlapped by the extracellular peak for those recorded at 20°C. The signal deconvolution was excellent with only a slight frequency shift of the fitted function. This small shift was responsible for the oscillating residual signal of low net area (Fig. 3 b). Specifically, the left- and right-hand sides of the two peaks in the NMR spectra had steep slopes, so even minor frequency shifts in the fitted function led to relatively large excursions in the residuals. However, the relative differences between deconvoluted and experimental peak areas were typically <0.1%.
Mechanisms for the fitted third peak
Seven plausible mechanisms for generating the third peak on fitting the data from hyperpolarized 13C-urea in RBC suspensions were:
-
1.
Heterogeneity in the extent of shrinkage of the cells;
-
2.
A pool in the extra- or intracellular compartments that remained unmixed with the others up to 2 min after injection;
-
3.
A pool in the membranes of the cells that only slowly exchanged with the other two pools over the subsequent 2 min;
-
4.
Adsorption of urea onto hemoglobin (and other less abundant proteins) inside the cell;
-
5.
Rapid exchange line-broadening brought about by association of urea with the extracellular surface of the RBCs;
-
6.
Gd3+ in the DNP solution that could associate with extracellular components and give rise to two (or more) rates of relaxation and line broadening; and
-
7.
RBC reorientation in the magnetic field, B0, of the NMR spectrometer that takes place on a timescale similar to that of the DNP experiment (alignment with B0 is the basis of a higher resolution than might otherwise be expected for 1H-spin-echo spectra of static samples of RBCs (43)).
A consequence of all the above factors is that there is not a single physical explanation for the third peak, and that it probably only has empirical meaning at this stage; thus, the combination of the third peak with that of the extracellular one described the overall line-shape better (in a statistical sense) than a single Lorentzian function.
Arguments for particular mechanisms
Mechanism 1
This mechanism is unlikely to be a major contributor to the nonideal spectral line shape in this case, because previous studies carried out under equilibrium-exchange conditions did not reveal a third peak (1). In addition, dimethyl methylphosphonate added to RBCs in a range of cell volumes encompassing those used in this work shows only two well-resolved peaks in 31P NMR spectra of the solute. Because dimethyl methylphosphonate is known to have a chemical shift that is a strictly-decreasing function of cell volume (44–47), a distribution of cell volumes would produce a broadened intracellular peak; under these buffer conditions, it did not occur.
Mechanism 2
If the third peak resulted from incomplete mixing of the hyperpolarized 13C-urea, this might occur in either compartment. Flow-induced distortion of the RBCs can take place, like that in blood flowing in blood vessels. Hence, the third peak could arise if there were a distribution of cytoplasmic mixing efficiencies. Because the third peak arose immediately after injecting the hyperpolarized 13C-urea, and did not grow like the intracellular peak, this suggests that it had an extracellular origin.
Mechanism 3
Because the third peak had a relative area of up to 10% of the total area of the signal this was unlikely to be ascribed to a pool in the membranes, because the total volume of the phospholipid membrane relative to the cytoplasmic volume of an RBC is very small. This can be estimated as follows: the surface area of a human RBC is ∼143 μm2 (44); the volume in isotonic conditions is ∼86 fL (32); and the thickness of a phospholipid bilayer is ∼5 nm (27). Thus, the volume of the bilayer is ∼0.8% of the cell volume. The RBCs in this work had a mean volume of ∼64 fL, therefore the phospholipid bilayer volume was 1.1% of each cell, and yet in a sample with Ht ∼ 30%, the membrane compartment volume would have been <1% of the total sample volume. The partition coefficient of urea in lipids is also very low (48), so it is unlikely that the urea had become concentrated in the phospholipid bilayer. And, given the physical-chemical properties of membrane transport proteins, they do not partition their transported solutes into a significant pool.
Mechanisms 4 and 5
Chemical exchange that is intermediate on the NMR timescale will give rise to line broadening. This could result from association of urea with the extracellular glycocalyx of the RBCs, and it is an aspect that is amenable to further study by using RBC ghosts (i.e., RBCs depleted of hemoglobin but with an intact plasma membrane). Although line-broadening could be studied with ghosts, the separation of the two peaks requires a high protein concentration inside the cells. Hence, ghosts cannot be used in studies of membrane transport (exploiting the split-peak phenomenon) unless a high concentration of protein is added outside them.
Mechanism 6
The omission of Gd3+ from the DNP solution still enabled hyperpolarization of the 13C-urea but its exclusion made no difference to the optimal fitting function of the emergent 13C NMR spectra, which remained at three peaks (data not shown).
One-dimensional 1H imaging profile experiments were performed (see additional discussion in Section S2 in the Supporting Material) to investigate the possible origin of two extracellular pools. From these experiments, it appeared that convection (resulting from thermal gradients) could account for the differences in one-dimensional 1H NMR imaging profiles of water.
Furthermore, the area of the third peak decayed in a manner similar to the intra- and extracellular signals. This should not have been the case if it was due to sample heterogeneity, which would give rise to a distribution of populations, hence multiple peaks. Thus, the third peak was deemed to result from alterations of the extracellular peak shape from the ideal Lorentzian (or even Gaussian) shape, brought about largely by convection in the sample.
Mechanism 7
Overall, we concluded that the third peak in the analysis of the spectra was from the extracellular population of 13C-urea arising from flow-convection, heterogeneity in the distribution of the solute (i.e., incomplete mixing of the hyperpolarized solution when it was injected into the densely packed RBCs), thermal gradients, cell reorientation, and most probably all such mechanisms together. The thermostated delivery system (described in detail in Section S1 in the Supporting Material) was designed to achieve thermal homogeneity in the sample, but the fact that the 20°C data had the third peak residing under the extracellular one, and the fact that it was shifted to lower frequency in the 37°C data, suggested a significant thermal contribution to the origin of the third unresolved peak.
Comparison with other biochemical systems
At t = 0, there was no hyperpolarized intracellular 13C-urea, so the signal should have increased from the beginning of the time course. It is evident from Fig. 3 that despite care given to the rapid injection (in <3 s) of the hyperpolarized 13C-urea, we were unable to catch the buildup of the intracellular signal; this highlights the very fast transport of urea across the RBC membrane. This contrasts with the slower buildup of other hyperpolarized 13C-solutes in cells and tissues (4,5,7,9). Under hyperpolarized conditions, the observed signal is the result of a competition between the natural spin relaxation and the chemical conversion of molecules. Although the intracellular signal buildup was not observed, the kinetic equilibrium was not reached for the first several seconds after the start of the acquisition. This is highlighted by the sum of the observable (hyperpolarized) and nonobservable signal for each pool (Fig. 5, dashed lines) seen in the simulations of the reaction scheme, using the parameter values obtained from the MCMC fitting.
Data fitting—general
The fitting of the complete four-state carrier model did not give robust and reliable estimates of the values of the kinetic constants. After several experiments we were led to conclude that urea transport was inhibited by the trans population of urea, so a product-inhibition-like Michaelis-Menten equation was justified. Despite the injection of various amounts of hyperpolarized urea with or without unlabeled urea, already at equilibrium between the two pools, the maximum quantity of intracellular urea was similar for all experiments (Fig. 4). Simulating signal evolution with a set of values for one specific parameter (see Section S4 in the Supporting Material) showed the low influence of the isomerization rate of the carrier on the signal time course. On the other hand, parameter estimates obtained by using the simpler model gave reproducible values with small standard deviations, with similar estimates from a range of initial experimental conditions.
Data fitting—actual values
To compare our estimates of the maximum velocities of urea exchange, Vmax,e and Vmax,i, with previously published values (1,42), we expressed the parameters as a function of the total surface area of RBCs in the sample, considering a cell surface area of 143 μm2 (41). In the forward direction, the maximum velocity of the reaction, Vmax,e, lay between 6.1 and 8.4 × 10⁻⁷ and 2.3 and 13.2 × 10⁻⁷ mol s−1 cm−2 at 37 and 20°C, respectively. Thus, there was insignificant difference in the values for both temperatures. The fitted values were of the same order of magnitude as given in Karan and Macey (42) (1.14 × 10⁻⁷ and 4.51 × 10⁻⁷ at 21 and 43°C, respectively) and in other studies (11,12,49). However, these values are an order-of-magnitude larger than those reported previously for the system under equilibrium-exchange using 13C NMR band-shape analysis (1). The explanation for this discrepancy is that the value of the apparent Michaelis constant, Kapp,e, is dependent on the urea concentration on the opposite side of the membrane:
| (18) |
At equilibrium, the Kapp,e values were ∼140 and ∼80 mmol L−1 at 20 and 37°C, respectively (Table 2). The estimates at 20°C are ∼5 and ∼2 times lower than the values reported by Karan and Macey (42), Yousef and Macey (49), and Brahm (11), but of the same order of magnitude as the measurement of Mayrand and Levitt (12); and ∼3 times lower than our previous estimate (1). As the temperature increased, the estimates of Kapp,e decreased, an opposite trend to what was reported in Brahm (11) and Karan and Macey (42).
Permeability and turnover number estimates
Despite the discrepancies in the estimates on Vmax and Km among the published articles (1,11,12,42,49), the limiting permeability P0 (Vmax/Km) was of the same order of magnitude (∼2 × 10⁻⁴ cm s−1 at 25°C) due to a similar difference in the estimates of both parameters, but with the same ratio. This similarity of P0 values suggests that shrinking the cells for the NMR experiments did not affect the exchange kinetics. We calculated P0 from the equilibrium-exchange apparent Michaelis constants and estimated it to be higher than the previous values, i.e., between 6.5 and 9.0 × 10⁻³ cm s−1.
In addition, the turnover number of each transport protein can be calculated from Eqs. 13–15 using the numerical values of the various cytological parameters for the RBCs used in the experiment. Thus the turnover per active site was estimated to be ∼10,000 s−1 for the ∼14,000 (15) transporters per RBC. This is a useful value for modeling urea exchange in other cell types, provided an estimate of the number of urea transporters per cell is available because the turnover numbers of various transporter isoforms are likely be similar.
Conclusions
We used the high polarization level achievable with the RD-DNP technique to study the permeability of erythrocytes to 13C-urea, on the 1-s to 2-min timescale. By taking into account the different physical and chemical parameters involved in the 13C NMR signal evolution, we were able to fit the 13C NMR spectral data and interpret the kinetic parameters in terms of a mechanistic model of the transport protein. We demonstrated that the addition of a high concentration of urea inhibits its own transport. The estimates of the kinetic parameters in some cases agreed with those already in the literature, obtained with other methods and under different experimental conditions. New estimates of values of the kinetic constants and the mechanistic model can now be used to investigate the distribution of 13C-urea in blood in vivo and, potentially, when other tissues are studied in a similar way, the whole body.
Acknowledgments
We thank Ms. Hu Qiaolan of the Clinical Imaging Research Centre for some of the venipuncture, Dr. Philip Lee for preliminary work on the HyperSense, and Professor Michael Field for information and discussion on renal blood flow.
The work was funded by an intramural grant from the Singapore Bioimaging Consortium, an Australian Research Council Discovery Project grant (No. DP0986316 to P.W.K.), and an Australian Postgraduate Award (to M.P.).
Supporting Material
References
- 1.Potts J.R., Bulliman B.T., Kuchel P.W. Urea exchange across the human erythrocyte membrane measured using 13C NMR lineshape analysis. Eur. Biophys. J. 1992;21:207–216. doi: 10.1007/BF00196765. [DOI] [PubMed] [Google Scholar]
- 2.Leib W.R. A kinetic approach to transport studies. In: Ellory J.C., Young J.D., editors. Red Cell Membranes, A Methodological Approach. Vol. 8, Biological Techniques Series. Academic Press; London, United Kingdom: 1982. pp. 135–164. [Google Scholar]
- 3.Ardenkjaer-Larsen J.H., Fridlund B., Golman K. Increase in signal-to-noise ratio of > 10,000 times in liquid-state NMR. Proc. Natl. Acad. Sci. USA. 2003;100:10158–10163. doi: 10.1073/pnas.1733835100. [DOI] [PMC free article] [PubMed] [Google Scholar]
- 4.Day S.E., Kettunen M.I., Brindle K.M. Detecting tumor response to treatment using hyperpolarized 13C magnetic resonance imaging and spectroscopy. Nat. Med. 2007;13:1382–1387. doi: 10.1038/nm1650. [DOI] [PubMed] [Google Scholar]
- 5.Gallagher F.A., Kettunen M.I., Brindle K.M. Magnetic resonance imaging of pH in vivo using hyperpolarized 13C-labeled bicarbonate. Nature. 2008;453:940–943. doi: 10.1038/nature07017. [DOI] [PubMed] [Google Scholar]
- 6.Marjańska M., Iltis I., Henry P.-G. In vivo 13C spectroscopy in the rat brain using hyperpolarized [1-13C]pyruvate and [2-13C]pyruvate. J. Magn. Reson. 2010;206:210–218. doi: 10.1016/j.jmr.2010.07.006. [DOI] [PMC free article] [PubMed] [Google Scholar]
- 7.Bohndiek S.E., Kettunen M.I., Brindle K.M. Hyperpolarized [1-13C]-ascorbic and dehydroascorbic acid: vitamin C as a probe for imaging redox status in vivo. J. Am. Chem. Soc. 2011;133:11795–11801. doi: 10.1021/ja2045925. [DOI] [PMC free article] [PubMed] [Google Scholar]
- 8.Harris T., Eliyahu G., Degani H. Kinetics of hyperpolarized 13C(1)-pyruvate transport and metabolism in living human breast cancer cells. Proc. Natl. Acad. Sci. USA. 2009;106:18131–18136. doi: 10.1073/pnas.0909049106. [DOI] [PMC free article] [PubMed] [Google Scholar]
- 9.Witney T.H., Kettunen M.I., Brindle K.M. Kinetic modeling of hyperpolarized 13C label exchange between pyruvate and lactate in tumor cells. J. Biol. Chem. 2011;286:24572–24580. doi: 10.1074/jbc.M111.237727. [DOI] [PMC free article] [PubMed] [Google Scholar]
- 10.Harrison C., Yang C., Malloy C.R. Comparison of kinetic models for analysis of pyruvate-to-lactate exchange by hyperpolarized 13C NMR. NMR Biomed. 2012;25:1286–1294. doi: 10.1002/nbm.2801. [DOI] [PMC free article] [PubMed] [Google Scholar]
- 11.Brahm J. Urea permeability of human red cells. J. Gen. Physiol. 1983;82:1–23. doi: 10.1085/jgp.82.1.1. [DOI] [PMC free article] [PubMed] [Google Scholar]
- 12.Mayrand R.R., Levitt D.G. Urea and ethylene glycol-facilitated transport systems in the human red cell membrane. Saturation, competition, and asymmetry. J. Gen. Physiol. 1983;81:221–237. doi: 10.1085/jgp.81.2.221. [DOI] [PMC free article] [PubMed] [Google Scholar]
- 13.Wolgast M. Studies on the regional blood flow with phosphorus-32 labeled red cells and small β-sensitive semiconductor detectors. Acta Physiol. Scand. 1968;313(Suppl.):1–109. [PubMed] [Google Scholar]
- 14.Wolgast M. Renal medullary red cell and plasma flow as studied with labeled indicators and internal detection. Acta Physiol. Scand. 1973;88:215–225. doi: 10.1111/j.1748-1716.1973.tb05448.x. [DOI] [PubMed] [Google Scholar]
- 15.Ojcius D.M., Solomon A.K. Sites of p-chloromercuribenzenesulfonate inhibition of red cell urea and water transport. Biochim. Biophys. Acta Biomembr. 1988;942:73–82. doi: 10.1016/0005-2736(88)90276-3. [DOI] [PubMed] [Google Scholar]
- 16.Reference deleted in proof.
- 17.Chew W., Widjaja E., Garland M. Band-target entropy minimization (BTEM): an advanced method for recovering unknown pure component spectra. Application to the FTIR spectra of unstable organometallic mixtures. Organometallics. 2002;21:1982–1990. [Google Scholar]
- 18.Widjaja E., Li C., Garland M. Band-target entropy minimization. A robust algorithm for pure component spectral recovery. Application to complex randomized mixtures of six components. Anal. Chem. 2003;75:4499–4507. doi: 10.1021/ac0263622. [DOI] [PubMed] [Google Scholar]
- 19.Wolfram S. Wolfram Media; Champaign, IL: 2011. The Mathematica Book, Ver. 8.0.1.0. [Google Scholar]
- 20.Kuchel P.W., Naumann C., Szekely D. Relaxation times of spin states of all ranks and orders of quadrupolar nuclei estimated from NMR z-spectra: Markov chain Monte Carlo analysis applied to 7Li+ and 23Na+ in stretched hydrogels. J. Magn. Reson. 2011;212:40–46. doi: 10.1016/j.jmr.2011.06.006. [DOI] [PubMed] [Google Scholar]
- 21.Puckeridge M., Chapman B.E., Kuchel P.W. Stoichiometric relationship between Na+ ions transported and glucose consumed in human erythrocytes: Bayesian analysis of 23Na and 13C NMR time course data. Biophys. J. 2013;104:1676–1684. doi: 10.1016/j.bpj.2013.03.019. [DOI] [PMC free article] [PubMed] [Google Scholar]
- 22.Puckeridge M., Chapman B.E., Kuchel P.W. Quantitative model of NMR chemical shifts of 23Na+ induced by TmDOTP: applications in studies of Na+ transport in human erythrocytes. J. Inorg. Biochem. 2012;115:211–219. doi: 10.1016/j.jinorgbio.2012.03.009. [DOI] [PubMed] [Google Scholar]
- 23.Puckeridge M., Pagès G., Kuchel P.W. Simultaneous estimation of T1 and the flip angle in hyperpolarized NMR experiments using acquisition at non-regular time intervals. J. Magn. Reson. 2012;222:68–73. doi: 10.1016/j.jmr.2012.06.006. [DOI] [PubMed] [Google Scholar]
- 24.Gao J.-H., Lemen L., Fox P.T. Magnetization and diffusion effects in NMR imaging of hyperpolarized substances. Magn. Reson. Med. 1997;37:153–158. doi: 10.1002/mrm.1910370123. [DOI] [PubMed] [Google Scholar]
- 25.Pagès G., Kuchel P.W. Mathematical modeling and data analysis of NMR experiments using hyperpolarized 13C metabolites. Magn. Reson. Insights. 2013;6:13–21. doi: 10.4137/MRI.S11084. [DOI] [PMC free article] [PubMed] [Google Scholar]
- 26.Kuchel P.W., Chapman B.E. NMR spin exchange kinetics at equilibrium in membrane transport and enzyme systems. J. Theor. Biol. 1983;105:569–589. doi: 10.1016/0022-5193(83)90220-5. [DOI] [PubMed] [Google Scholar]
- 27.Kuchel P.W. McGraw-Hill; New York: 2009. Schaum’s Outline of Theory and Problems of Biochemistry. [Google Scholar]
- 28.Mulquiney P.J., Kuchel P.W. CRC Press; Boca Raton, FL: 2003. Modeling Metabolism with Mathematica. [Google Scholar]
- 29.Lieb W.R. Red Cell Membranes: A Methodological Approach. Academic Press; London, United Kingdom: 1982. A kinetic approach to transport studied; p. 390. [Google Scholar]
- 30.Potts J.R., Kuchel P.W. Anomeric preference of fluoroglucose exchange across human red-cell membranes. 19F-NMR. studies. Biochem. J. 1992;281:753–759. doi: 10.1042/bj2810753. [DOI] [PMC free article] [PubMed] [Google Scholar]
- 31.Mannuzzu L.M., Moronne M.M., Macey R.I. Estimate of the number of urea transport sites in erythrocyte ghosts using a hydrophobic mercurial. J. Membr. Biol. 1993;133:85–97. doi: 10.1007/BF00231880. [DOI] [PubMed] [Google Scholar]
- 32.Dacie J.V., Lewis S.M. Churchill Livingstone; Edinburgh, United Kingdom: 1975. Practical Haematology. [Google Scholar]
- 33.Jaynes E.T. Cambridge University Press; Cambridge, United Kingdom: 2003. Probability Theory: The Logic of Science. [Google Scholar]
- 34.Sivia D.S., Skilling J. Oxford Science Publications; Oxford, United Kingdom: 2006. Data Analysis: A Bayesian Tutorial. [Google Scholar]
- 35.MacKay D.J.C. Bayesian interpolation. Neural Comput. 1992;4:415–447. [Google Scholar]
- 36.Metropolis N., Rosenbluth A.W., Teller E. Equations of state calculations by fast computing machines. J. Chem. Phys. 1953;21:1087–1092. [Google Scholar]
- 37.Hastings W.K. Monte Carlo sampling methods using Markov chains and their applications. Biometrika. 1970;57:97–109. [Google Scholar]
- 38.Bretthorst G.L., Hutton W.C., Ackerman J.J.H. Exponential parameter estimation (in NMR) using Bayesian probability theory. Concepts Magn. Reson. 2005;27A:55–63. [Google Scholar]
- 39.Bretthorst G.L., Hutton W.C., Ackerman J.J.H. Exponential model selection (in NMR) using Bayesian probability theory. Concepts Magn. Reson. 2005;27A:64–72. [Google Scholar]
- 40.Bretthorst G.L. How accurately can parameters from exponential models be estimated? A Bayesian view. Concepts Magn. Reson. 2005;27A:73–83. [Google Scholar]
- 41.Kirk K., Kuchel P.W. Equilibrium exchange of dimethyl methylphosphonate across the human red cell membrane measured using NMR spin transfer. J. Magn. Reson. 1986;68:311–318. [Google Scholar]
- 42.Karan D.M., Macey R.I. Temperature- and concentration-dependence of urea permeability of human erythrocytes determined by NMR. Biochim. Biophys. Acta Biomembr. 1990;1024:271–277. doi: 10.1016/0005-2736(90)90354-q. [DOI] [PubMed] [Google Scholar]
- 43.Kuchel P.W., Coy A., Stilbs P. NMR “diffusion-diffraction” of water revealing alignment of erythrocytes in a magnetic field and their dimensions and membrane transport characteristics. Magn. Reson. Med. 1997;37:637–643. doi: 10.1002/mrm.1910370502. [DOI] [PubMed] [Google Scholar]
- 44.Kirk K., Kuchel P.W. Red cell volume changes monitored using a new 31P NMR procedure. J. Magn. Reson. 1985;62:568–572. [Google Scholar]
- 45.Kirk K., Kuchel P.W. Physical basis of the effect of hemoglobin on the 31P NMR chemical shifts of various phosphoryl compounds. Biochemistry. 1988;27:8803–8810. doi: 10.1021/bi00424a017. [DOI] [PubMed] [Google Scholar]
- 46.Kirk K., Kuchel P.W. The contribution of magnetic susceptibility effects to transmembrane chemical shift differences in the 31P NMR spectra of oxygenated erythrocyte suspensions. J. Biol. Chem. 1988;263:130–134. [PubMed] [Google Scholar]
- 47.Kuchel P.W., Bubb W.A., Hook J. 31P MAS-NMR of human erythrocytes: independence of cell volume from angular velocity. Magn. Reson. Med. 2004;52:663–668. doi: 10.1002/mrm.20139. [DOI] [PubMed] [Google Scholar]
- 48.Finkelstein A. Water and nonelectrolyte permeability of lipid bilayer membranes. J. Gen. Physiol. 1976;68:127–135. doi: 10.1085/jgp.68.2.127. [DOI] [PMC free article] [PubMed] [Google Scholar]
- 49.Yousef L.W., Macey R.I. A method to distinguish between pore and carrier kinetics applied to urea transport across the erythrocyte membrane. Biochim. Biophys. Acta Biomembr. 1989;984:281–288. doi: 10.1016/0005-2736(89)90294-0. [DOI] [PubMed] [Google Scholar]
Associated Data
This section collects any data citations, data availability statements, or supplementary materials included in this article.