

Abstract
The light-induced processes of the biological photoreceptor phytochrome (recombinant phyA of oat and recombinant CphA from the cyanobacterium Tolypothrix PCC7601) have been investigated in a time-resolved manner in the temperature range from 0 to 30°C. Both proteins were heterologously expressed and assembled in vitro with phycocyanobilin. The Pr state of plant phytochrome phyA is converted to the Pfr state after formation of four intermediates with an overall quantum yield of ∼18%. The reversal reaction (Pfr-to-Pr) shows several intermediates, all of which, even the first detectable one, exhibit already all spectral features of the Pr state. The canonical phytochrome CphA from Tolypothrix showed a similar intermediate sequence as its plant ortholog. Whereas the kinetics for the forward reaction (Pr-to-Pfr) was nearly identical for both proteins, the reverse process (Pr formation) in the cyanobacterial phytochrome was slower by a factor of three. As found for the Pfr-to-Pr intermediates in the plant protein, also in CphA all detectable intermediates showed the spectral features of the Pr form. For both phytochromes, activation parameters for both the forward and the backward reaction pathways were determined.
Introduction
Phytochromes are biological photoreceptors present in all higher and lower plants investigated so far, and they were also identified in fungi and a number of photosynthetic and nonphotosynthetic prokaryotic bacteria (1,2). Ongoing research has revealed, however, that besides the orthodox (plant-like) phytochromes the spectroscopic and functional variation in this photoreceptor family is much wider than assumed for a long time, including changes in the chromophore type, in the protein architecture, and in the photochemical reactivity (3). The phytochromes of plants and the classical phytochromes from cyanobacteria (e.g., Cph1 from Synechocystis PCC6803 (4)) exhibit a high degree of similarity to each other with respect to their primary and secondary structure. Furthermore, homology studies based on the three- dimensional (3D) structure of the canonical phytochrome Cph1 (5) allow suggesting that also the 3D structures of these two phytochrome families are similar (6).
Phytochromes gain their function through the photochemical properties of their covalently bound chromophore, in the case of plants and most cyanobacteria the tetrapyrrole compounds phytochromobilin (in plants) and phycocyanobilin (PCB in cyanobacteria, Fig. 1).
Figure 1.
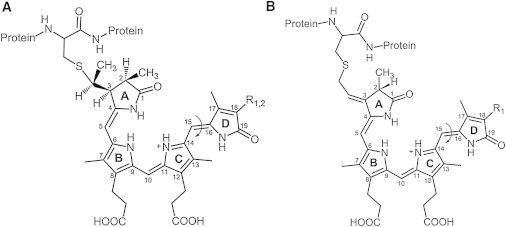
Chromophore structure in plant, cyanobacterial, and noncyanobacterial phytochromes in their protein-bound form. Left, structure of R1 = vinyl, phytochromobilin, R2 = ethyl, PCB. Right, structure of BV Ixα, R1 = vinyl. The position of double bond photoisomerization (between rings C and D) is indicated by an arrow.
Most of the noncyanobacterial phytochromes use biliverdin (BV) as chromophore, which is also covalently bound to the protein. Irrespective of the different chromophores, the photochemical reaction is identical in these three groups of phytochromes: light causes a photoisomerization of only one selected double bond of the bilin chromophore (that one between the pyrrole rings C and D, Fig. 1). This primary reaction is then followed by a series of conformational changes of chromophore and protein, yielding a spectroscopically (batho- or hypsochromically) shifted, thermally moderately stable state. For the plant phytochromes, the biochemically formed (dark) state, Pr (λmax = 665 nm) is photoconverted into Pfr (λmax = 730 nm, r, fr, red-, far red absorbing form, respectively; these absorption maxima are given for the phytochromobilin chromophore, λmax for PCB-phytochromes = 650 and 710 nm for Pr and Pfr, respectively; phytochromes carrying BV absorb at 700 nm (Pr) and 750 nm (Pfr)). Most physiological studies have been performed in plants, where many photomorphogenic processes are regulated by phytochromes. For this function, the Pfr state is considered the physiologically active form (7–9). Much less biological functions could be ascribed to the prokaryotic phytochromes, which, otherwise, are more readily prepared as recombinant proteins.
The full conversion from the Pr- into the Pfr state (and vice versa) covers at least 10 orders of magnitude, initiated on the ps timescale with the double bond photoisomerization of the chromophore, and expanding into the long ms time range. Although both states are interconvertible by light of selective wavelengths, nearly all investigations on the photoconversion, performed so far, have addressed the forward photochemistry (Pr-to-Pfr) (10–15), (for an overview on time-resolved measurements of phytochrome photoconversion see (16)), and for many applications, e.g., Fourier-transform infrared, resonance Raman, and NMR-spectroscopy, low temperature intermediate-trapping techniques have been chosen (17–25).
Here, we present a full kinetic analysis of both forward and backward photochemistry of oat phyA65 (this recombinant protein covers the entire photosensory part of phyA, i.e., positions 1–595), and extend the temperature range to 0°C (former studies were performed at ambient or slightly lower temperatures). Also for this plant phytochrome, detailed investigations have mostly been performed for the forward photoprocess (15,26,27). In addition, we compare the photochemical behavior of plant phytochrome to that of a cyanobacterial ortholog, CphA from Tolypothrix PCC7120. CphA is very closely related to the first identified orthodox cyanobacterial phytochrome, Cph1 from Synechocystis PCC6803.
Materials and Methods
Sample preparation
Phytochromes were expressed as recombinant apo-proteins and were assembled with PCB after lysis of the expression host cells (Hansenula polymorpha for oat-phyA, and Escherichia coli for CphA). The plant-derived phytochrome (oat-phyA) was a C-terminally truncated construct, spanning amino acids 1–595 that covers the entire chromophore-binding domain (28). This protein will be named phyA65 according to its molecular weight. CphA from Tolypothrix PCC7120 was expressed as a full-length protein (29). The recombinant proteins were His-tagged at their C-terminal end and purified by affinity chromatography following standard protocols. Purity of the samples was confirmed by matrix-assisted laser-desorption/ionization time-of-flight mass spectrometry, steady-state absorption spectroscopy, and SDS-PAGE electrophoresis. Samples were adjusted in phosphate buffer (50 mM potassium phosphate, 300 mM, NaCl, 5% v/v glycerol, pH 8.0) to an optical density of 0.5–1.0 (at λmax) for the time-resolved measurements.
Time-resolved absorption spectroscopy
The laser flash photolysis setup was similar to that described by Chizhov and co-workers (30–32). Samples were preirradiated in the following manner: for the forward reaction, the samples were irradiated before the beginning of the measurements with far-red light (cutoff filter λ > 710 nm), ensuring a 100% population of Pr. For measurements of the reverse reactions, a maximal accumulation of the Pfr state (∼60%) was accomplished by irradiation with an interference filter (λ = 625 ± 7 nm) before starting the flash photolysis. Again, the generated Pr molecules were back-irradiated to the Pfr state using an interference filter (λ= 625 ± 7 nm) during the experiment. The excitation/detection sstems were composed as such: a Surelite II-10 Nd:YAG laser (Continuum, USA) was used providing pulses of 5 ns duration at 532 nm wavelength and energy up to 200 mJ/pulse with maximum repetition rate of 10 Hz, however, according to the time domain of full conversions, the repetition rate was set to 0.3 Hz for Pr-to-Pfr and to 0.1 Hz for the reverse process. These pulses were further converted either to 640 nm (DCM laser dye) or 722 nm (Pyridin 2 dye; both from Radiant Dyes Laser & Accessories GmbH, Germany) using a custom built dye cell with conversion efficiency of ∼20% for both dyes and spectral bandwidth of ∼10 nm. For both photoconversions Pr-to-Pfr (640 nm) and Pfr-to-Pr (722 nm) the excitation energy densities were around 10–20 mJ/cm2. Samples (300 μl volume, ODmax = 0.5–1.0, 5 × 5 mm spectroscopic quartz cuvette (Hellma GmbH & Co, Germany)) were placed in a thermostated house between two collimated and mechanically coupled monochromators (1/8 m model 77250, Oriel, USA). The probing light (Xe-arc lamp, 75W, Osram, Germany) passed the first monochromator sample and arrived after a second monochromator at a PMT detector (R3896, Hamamatzu, Japan). The current-to-voltage converter of the PMT determines the time resolution of the measurement system of ∼50 ns (measured as an apparent pulse width of the 5 ns laser pulse). Two digital oscilloscopes (LeCroy 9361 and 9400A, 25 and 32 kb of buffer memory per channel, respectively) were used to record the traces of transient transmission changes in two overlapping time windows. The maximal digitizing rate was 10 ns per data point. Transient absorption changes were recorded from 10 ns after the laser pulses until full completion of the phototransformation. At each wavelength, 10 laser pulses were averaged to improve the signal/noise ratio. The quasilogarithmic data compression reduced the initial number of data points per trace (∼50,000) to ∼600 points evenly distributed in a log timescale giving ∼100 points per time decade. The wavelengths were varied from 540 to 770 nm in steps of 10 nm (altogether, 24 spectral points) using a computer-controlled step-motor. Absorption spectra of the samples were measured before and after each experiment on standard spectrophotometer (Beckman DU-800). During the measurements, a background irradiation was applied to the samples before each laser pulse to reconvert the laser-generated photoproduct molecules back to the investigated state (Pr or Pfr, respectively). This was achieved by installation of an additional halogen lamp (Xenophot HLX 24 V, 120 W, Osram, Germany) perpendicular to the probing light axis. The lamp was equipped with a computer-controlled mechanical shutter and appropriate filters: either RG710 (Schott, Germany) for the Pfr-to-Pr conversion or IF625 (Carl Zeiss, Germany) for the opposite process. The time of illumination was determined experimentally (see Fig. S1 in the Supporting Material). Special attention has been paid to the intensity of the probing light. This intensity was attenuated to the lowest level, which does not produce back or forward photoconversion with the rate constant comparable to the slowest rate constant of the laser-induced reactions (see Fig. S1 and Fig. S2). Here, we report results of the analysis of 14 data sets: seven sets of the Pr-to-Pfr spectral kinetics measured from 0 to 30°C (steps of 5 degrees) from 540 nm to 770 nm (steps of 10 nm) and in time window from 5 μs to 160 ms, and seven sets of the reverse Pfr-to-Pr photo-conversion in the same spectral range but at slightly higher temporal resolution (from 500 ns to 160 ms).
Data treatment and global fit analysis
Each data set was independently analyzed using the global multiexponential nonlinear least-squares fitting program MEXFIT (33,34). The number of exponential components was incremented until the standard deviation of weighted residuals did not further improve. Additionally, the randomness of the 3D surface of weighted residuals and the smoothness of the temperature dependence of the derived rate constants and their amplitude spectra were used to determine the number of exponents. After establishing the apparent rate constants and their assignment to the internal irreversible transitions of a single chain of relaxation processes, the amplitude spectra of exponents were transformed to the difference spectra of the corresponding intermediates in respect to the spectrum of final state. Subsequently, the absolute absorption spectra of states were determined by adding the difference spectra divided by the fraction of converted molecules to the spectra of the final states. Criteria for the determination of the fraction value were the absence of negative absorbencies and contributions from the initial state to the calculated spectra of final state. For further details of the methods see (30–32).
Results
Samples of oat phyA65 and of CphA were studied for their light induced Pr-to-Pfr and Pfr-to-Pr conversions in a temperature range from 0 to 30°C at 24 selected wavelengths ranging from 540 nm up to 770 nm. Data were treated through global fit analysis, yielding lifetime-associated difference spectra (LADS) of the intermediates and allowing extraction of the pure intermediate spectra. Temperature control over a wide range allowed extracting activation parameters for both forward and backward processes. For the forward reaction, the samples were irradiated before the beginning of the measurements with far red light (cutoff filter λ > 710 nm), ensuring a 100% population of Pr. For measurements of the reverse reactions, a maximal accumulation of the Pfr state (∼60%) was accomplished by irradiation with an interference filter (λ = 625 ± 7 nm) before starting the flash photolysis. Again, the generated Pr molecules were back-irradiated to the Pfr state using an interference filter (λ= 625 ± 7 nm) during the experiment.
The Pr-to-Pfr conversion
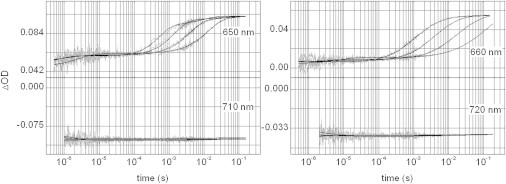
Following the absorption changes after 10 ns-laser flashes (averaged traces from 10 laser pulses at each wavelength), phytochromes reveal complex kinetics (Fig. 2) that were followed at selected wavelengths (see Materials and Methods section). The photoconversion was performed for several temperatures ranging from 0 to 30°C with temperature intervals of 5°C, exemplified in Fig. 2 for wavelengths 640, 680, and 720 nm (lowest temperature, 0°C, refers to the uppermost kinetic trace at 640/650 nm, and for the lowest trace at 720 nm; shown are measurements at 0, 10, 20, and 30°C). Note that due to the time resolution in these experiments (∼100 ns), detection of absorption changes starts with the decay of the photoproduct I700, also coined lumiR; formation of this primary photoproduct is in the ps time range (12,35), and is not resolved here.
Figure 2.
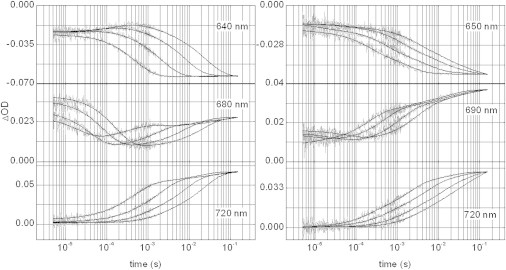
Pr-to-Pfr conversion of phyA65 (left panels) and CphA (right) shown for selected wavelengths and temperatures (0, 10, 20, and 30°C). Transient absorbance changes are plotted with respect to the absorption of the initial Pr state (zero levels of ΔOD scales). Note the immediate jumps of ΔOD at first experimental time points indicative for not resolved preceding transition(s). Experimental data (noisy gray traces) were treated by a global fit procedure in the time range from 5 μs to 160 ms (note the logarithmic scale of time). Global minimum of weighted residuals indicate five exponentials for phyA65 and four for CphA (fit results are shown as black lines).
Time-resolved detection of the photoprocesses of phyA65 reveals the bleaching of the Pr state around 640 nm (Fig. 2, left, shown for wavelengths 640, 680, and 720 nm, respectively; panels on the right refer to the corresponding measurements for CphA). Bleaching is complete already at ∼10 ms at 30°C, whereas at lower temperatures (down to 0°C) the kinetics extend to ∼100 ms. Following the Pfr formation at a longer wavelength (720 nm), however, reveals slow, ongoing processes with very low amplitudes that extend into the seconds time range. Whereas the kinetic traces at 640 nm and at 720 nm follow monotonously the temperature change, detection at 680 nm identifies a very early intermediate (ΔAinitial (unequal) zero), and a second intermediate (more apparent in the 30°C temperature trace) with on- and off-kinetics around 1 ms. Overall, global fit analysis yielded five transition processes with lifetimes of 30 μs, 230 μs, 1.5 ms, 4.5 ms, and 34 ms, all parameters given for 20°C (Fig. 2, left panels and Fig. 4). These results are in full accordance with formerly performed investigations (15,27,36,37) and gave confidence for an extended investigation of CphA, and also of the Pfr-to-Pr conversions of both proteins (vide infra). This comparison to formerly performed experiments was required, because in this study the amount of glycerol had to be increased to allow for measurements at low temperatures; yet, no principal changes in the kinetic behavior as an effect of glycerol addition were determined.
Figure 4.
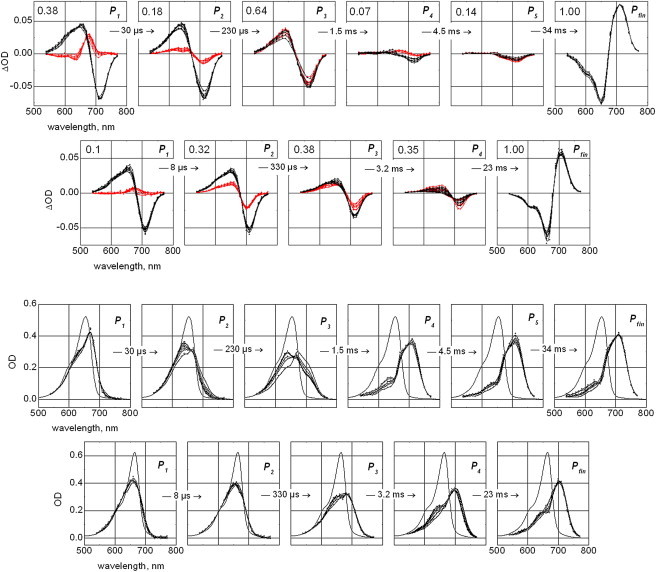
The Pr-to-Pfr conversion (first panel: phyA65, second panel, CphA): LADS (i.e., amplitude spectra of exponential components; red points and B-spline connecting lines) and corresponding difference spectra of the P1–P4,5 intermediates (with respect to the final spectrum Pfr) plus difference between Pfr and Pr states Pfin (black points and B-spline connecting lines), calculated from fitting the data on the basis of a suggested sequential, irreversible model of the reaction. Depicted lifetimes correspond to 20°C. Spectra are shown for all seven temperature points from 0 to 30°C. The relative amplitude of maximal absorption changes of the correspondent exponential components are depicted, taking the maximal amplitude of Pfin state as reference (upper left corner of each panel). Panel three and four: derived absorption spectra of intermediates P1–P4,5 and final Pfr (Pfin) states of phyA65 (panel three) and CphA (panel four). Each graph contains seven spectra obtained at temperatures from 0 to 30°C (in steps of 5°C, black data points and B-spline connecting lines) and the initial Pr spectrum (solid lines; measured at a standard spectrophotometer before experiments). In the beginning, the difference spectra of Pfin divided by the fraction of converted molecules f were added to the spectrum of Pr. The fraction value was varied from 0 to 1 until the spectra Pfin did not contain any contribution of either the Pr spectrum (upper limit) or of negative absorption bands (lower limit). This procedure yielded values f = 0.18 ± 0.02 (phyA65) and 0.16 ± 0.02 (CphA) that were further used for calculating absorption spectra of intermediate states P1 to P4,5 by adding to the spectrum Pfin of difference spectra P1..P4,5, divided by f. Note that the determined fraction of molecules converted from Pr to Pfr does not depend on the temperature and corresponds to the saturating laser energy density at 650 nm of ca 20 mJ/cm2 used in experiment.
Investigation of CphA (Fig. 2, right panels, for 650, 690, and 720 nm, and Fig. 4) yields kinetics as for phyA65 with very similar lifetimes of 8 μs, 330 μs, 3.2 ms, and 23 ms. As seen previously for phyA65, the bleaching of the Pr form already starts with a negative increment, indicative for the instantaneous formation of a bathochromic intermediate. The recording of absorbance changes extends into the hundreds of ms and implies that the formation of the Pfr state is probably slightly slower in the cyanobacterial phytochrome than in its plant counterpart.
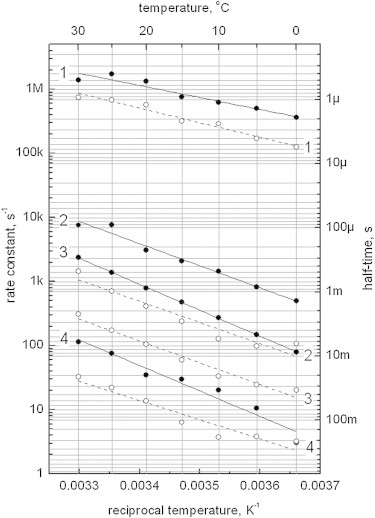
The temperature-dependent kinetics allowed determination of activation parameters for both proteins (Fig. 3, phyA65: solid lines, CphA: dashed lines, and Table 1). Inspection of the Arrhenius-plots (Fig. 3) shows that the initial processes for both proteins follow a similar temperature dependence (solid and dashed lines #1 and #2, respectively), whereas phyA65 follows a slightly steeper dependence in the slower conversion processes (solid lines 3–5) than CphA for which the change of the rate constants upon temperature is less pronounced (dashed lines 3, 4).
Figure 3.
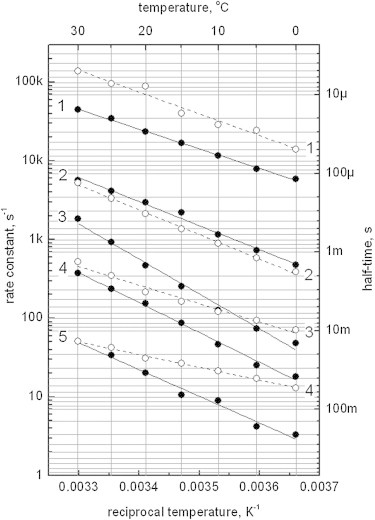
Temperature dependence of the phyA65 (filled circles) and CphA (open circles) conversion from Pr to Pfr state: rate constants of the reaction in Arrhenius coordinates (left axis; right axis: corresponding half-times). Experimental data and nonlinear fit (phyA65, solid lines; CphA dashed lines) are shown. Apparent activation enthalpies and entropies of reactions obtained from the fit are summarized in Table 1.
Table 1.
Activation barriers of five (phyA65) and four (CphA) apparent rate constants for the Pr-to-Pfr conversion
| , kJ/mol | PhyA | 45 ± 1 | 56 ± 2.5 | 82 ± 4 | 70 ± 2 | 62 ± 4 |
| CphA | 50 ± 4 | 58 ± 1.3 | 43 ± 3 | 29 ± 1 | ||
| , J/mol K | PhyA | −6 ± 3 | 12 ± 9 | 88 ± 13 | 36 ± 8 | −6 ± 12 |
| CphA | 20 ± 14 | 16 ± 5 | −54 ± 10 | −118 ± 3 |
Enthalpies and entropies of activation were derived according to the Transition State Theory from nonlinear fitting of data (Fig. 3) using equation , where are experimental rate constants, and are Boltzmann, Planck, Gas constants, and Kelvin temperature, respectively.
LADS were extracted from the kinetic traces (Fig. 4, top panel: phyA, second panel: CphA) that identify the spectral features of the intermediate species. In this figure we show the LADS (in red) and the difference spectra (in black) of these species taking the Pfr spectrum as reference. In each panel the traces per color are represented for all seven measured temperatures. From this presentation, the conversion from Pr into Pfr can be readily followed (according to the convention, LADS spectra with positive amplitude refer to a decaying species, whereas negative amplitudes indicate an absorbance rise). For phyA65, an initial intermediate with absorbance maximum around 680 nm is found that decays with a lifetime of 30 μs into the following form (630–650 nm, transition P1 to P2, evident as a shallow negative amplitude). This intermediate then converts into a 710 nm species (already close in absorbance to the final Pfr product). In P3, this formation of Pfr-like species shows the strongest absorbance change, whereas P4 and P5 (both showing negligibly small amplitudes) show absorbance changes only in the long wavelength range of Pfr, indicating that here preferentially final rearrangements of a Pfr-like species take place.
Similar processes were identified for CphA (Fig. 4, second panel from top). Again, P1 displays the decay of the initially formed intermediate around 680 nm, here with apparently smaller amplitude and a shorter lifetime of ∼8 μs. The following processes follow those observed for phyA65, albeit with slightly modified lifetimes. The comparison reveals that one of the late intermediates is either not present or could not be resolved due to low transient accumulation.
Interesting details of the Pr-to-Pfr conversion can be extracted from the pure spectra of the intermediates when compared for the selected measurement temperatures (Fig. 4, third panel: phyA, fourth panel: CphA). The conversions between the various intermediates of plant phytochrome are strongly temperature dependent, most evident for the formation of the 630 nm-intermediate, P2, and its conversion with 230 μs into P3, and even into P4 with 1.5 ms (Fig. 4, third panel). Whereas CphA forms similar intermediates (Fig. 4, fourth panel), the temperature dependence is less pronounced and is strongest in the formation and decay of P3. Interestingly, CphA shows an 8 μs-conversion between two early intermediates (P1, P2) with nearly the same absorbance maximum, which also coincides to a large extent with the initial Pr state. The shorter wavelength maximum of P1 of CphA explains the low transient concentration of this intermediate in the difference spectra (cf. Fig. 4, second panel, P1).
The Pfr-to-Pr conversion
The good agreement for the forward reaction between the data presented here and to formerly performed studies (14–16) justified the investigation of the backward reaction, which had been studied so far mostly at cryogenic temperatures by vibrational and NMR spectroscopy (19,23,25,38,39), and only one comprehensive study at ambient temperature has been reported so far for oat phyA (40). Again, this photoprocess was performed between 0 and 30°C (exemplified in Fig. 5 for two wavelengths, left panel: phyA65, right panel: CphA).
Figure 5.
Pfr-to-Pr conversion of phyA65 (left panels) and CphA (right panels) at selected wavelengths and temperatures (0, 10, 20, and 30°C). The global minimum of weighted residuals indicates four exponentials for phyA65 and CphA (measured traces are given in gray, fit results are shown as black solid lines).
Compared to the forward reaction, both phytochromes behave entirely different in their respective reversal conversion process. For both proteins, four instead of five lifetimes were found for the Pr formation: 0.6 μs, 200 μs, 0.9 ms, and 15 ms for phyA65, and 1.5 μs, 1.5 ms, 6 ms, and 50 ms (Fig. 7) for CphA, as becomes also evident from the Arrhenius plot (Fig. 6). Overall, this back-conversion is significantly faster than the forward process, with phyA65 being even faster than CphA, and the identifiable intermediates exhibit unexpected absorption properties: already the first detectable intermediate of phyA65 (P1 in Fig. 7) is shifted to shorter wavelengths than the Pfr parent state and is very much akin the final product, Pr, with an absorbance maximum around 660–670 nm (an experimental laser artifact generated a sharp negative peak around 720 nm that matches the excitation wavelength). In addition, the derived pure intermediate spectra (Fig. 7, panels three and four) make visible another feature of CphA, which is different to phyA: the first detectable intermediate (P1) does not exhibit the red-shifted absorption found for plant phytochromes, instead its absorption is nearly coincident with that of the parent Pr state (cf. panel one and three in Fig. 7). Furthermore, for the conversion of phyA65 and CphA activation parameters could be determined for the temperature range from 0°C up to 30°C (Fig. 6, Table 2).
Figure 7.
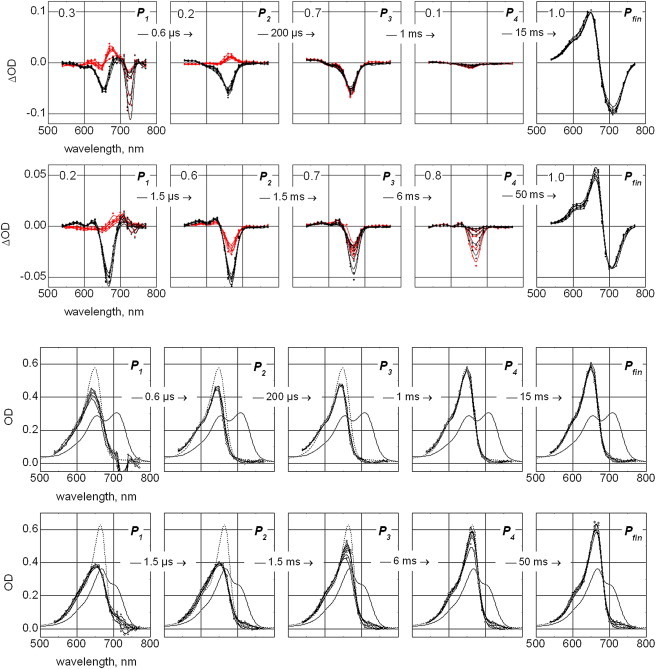
The Pfr-to-Pr conversion (phyA65, top panel; CphA, second panel from top): lifetime-associated difference spectra (i.e., amplitude spectra of exponential components; gray points and B-spline connecting lines) and corresponding difference spectra of the P1–P4 intermediates (in respect to the final spectrum Pr) plus difference between Pfr and Pr states Pfin (black points and B-spline connecting lines), calculated from a fit of the data on the base of a suggested sequential, irreversible model of reaction. Depicted life-times correspond to 20°C. Spectra are shown for all seven temperature points from 0 to 30°C. The relative amplitude of maximal absorption changes of the correspondent exponential components are depicted, taking the maximal amplitude of Pfin state as reference (upper left corner of each panel). Derived absorption spectra of intermediates P1–P4 and final Pr (Pfin) states of phyA65 (third panel) and CphA (fourth panel) for the conversion from Pfr to Pr. Each graph contains seven spectra obtained at temperatures from 0 to 30°C (in steps of 5°C, black points and B-spline connecting lines), the initial Pfr spectrum (solid lines) and the final Pr spectrum (dashed lines), measured at a standard spectrophotometer before and after experiments. Initially, the difference spectra of Pfin, divided by the fraction of converted molecules f were added to the spectrum of Pr. This yielded fraction values f = 0.34 ± 0.02 (phyA65) and 0.18 ± 0.02 (CphA) that were used further for calculating the absorption spectra of intermediate states P1 to P4 by adding to spectrum Pfin of difference spectra P1..P4 divided by f. Note that the calculated fraction of molecules converted from Pfr to Pr does not depend on the temperature and corresponds to the saturating laser energy density at 710 nm of ∼20 mJ/cm2 used in the experiment.
Figure 6.
Temperature dependence of the phyA65 (filled circles) and CphA (open circles) conversion from Pfr to Pr state. Experimental data and nonlinear fit are shown (phyA65, solid lines; CphA, dashed lines). Apparent activation enthalpies and entropies of reactions obtained from the fit are summarized in Table 2.
Table 2.
Activation barriers of phyA65 and CphA apparent rate constants for Pfr-to-Pr conversion
| , kJ/mol | PhyA | 34 ± 5 | 64 ± 4 | 75 ± 1 | 74 ± 7 |
| CphA | 41 ± 3 | 61 ± 8 | 63 ± 5 | 55 ± 7 | |
| , J/mol K | PhyA | −15 ± 16 | 40 ± 15 | 67 ± 2 | 38 ± 26 |
| CphA | 4 ± 12 | 13 ± 28 | 8 ± 17 | −36 ± 26 |
For further details see caption to Table 1.
In general, CphA behaves similar to phyA65, however, the final processes in forming Pr are slightly slower than for the plant phytochrome, and especially P4 (forming with 6 ms and decaying with 50 ms) reveals a strong temperature dependence (Fig. 6). Overall, the plant phytochrome appears to be much more directed to the final Pr species, whereas CphA exhibits greater flexibility, as becomes evident from the stronger temperature effects of the intermediate spectra.
Discussion
Two recombinant phytochromes, phyA 65 of oat and CphA of Tolypothrix PCC7601 were studied for their photochemical reactivity (Pr-to-Pfr and Pfr-to-Pr photoconversion) in the wavelength range between 540 and 770 nm. Addition of glycerol allowed expanding the temperature range from 30°C down to 0°C and revealing Arrhenius parameters of these conversions. The larger temperature span allows determination of these activation parameters with higher precision than reported in former studies, where a temperature range maximally down to 12°C was accomplished. CphA and preferentially phyA65 from oat have been studied in great detail for their light-induced conformational changes, however, in most investigations ambient temperature measurements have been performed for the Pr-to-Pfr conversion of both proteins (16,41,42). A detailed study had also been reported for the ortholog protein to CphA, Cph1 from Synechocystis PCC6803 (14). Investigations on structural properties of the conversion intermediates by, e.g., vibrational or NMR spectroscopy had been performed, however, due to the time required for data acquisition, these experiments were performed only under cryogenic conditions that allow trapping intermediates (19,23,24,43,44).
Canonical cyanobacterial phytochromes, e.g., Cph1 or (here studied) its ortholog CphA exhibit a very similar architecture of the light sensing part of the protein, consisting of a Per-Arnt-Sim-cGMP-specific phosphodiesterases, adenylylcyclases and FhlA-phytochrome-specific (commonly named PAS-GAF-PHY) protein domain arrangement in their N-terminal half. This domain composition is found identically also in the plant-derived phytochromes. The signaling domain in most canonical cyanobacterial phytochromes is a histidine kinase activity—in contrast to plant phytochromes that carry a Thr-/Ser-kinase function in their C-terminal region. These features allow comparing data from plant-derived phyA and from the cyanobacterial Cph1 and CphA proteins with each other.
Investigation of the forward reaction of oat phyA, here performed on a wider temperature range, confirmed, but also extended former results (15,27,36). Whereas the formation of the first intermediate in the ps time range had been studied in recent work (12,35), its decay could be followed here. Comparing both proteins in their Pr-to-Pfr conversion, the process with greatest amplitude and also with the strongest features of Pfr is the P3 decay for phyA65 (τ = 1.5 ms) and for CphA the conversions of P2 and P3 (τ = 330 μs and 3.2 ms, respectively). Also comparable for both proteins is the finding that the late processes reflect mostly conformational changes of the already preformed Pfr state.
Experiments reported by Zhang et al. (15) on native oat phyA identified five consecutively formed intermediates (including a very late conformational change of 266 ms that is evident also in this study (Fig. 3; here, the longest lifetime is ∼115 ms for 10°C, resp. ∼360 ms for 5°C. Whereas the absolute numbers vary slightly, the principal conversion process is reflected by both studies in a similar way. The former investigations (15) were all performed at 10°C, and detection was accomplished by a pulsed diode array, revealing the intermediate difference spectra instead of (this study) following time traces at selected wavelengths, still yielding overall very comparable results. As an additional aspect to keep in mind, native plant phytochromes carry phytochromobilin as their genuine chromophore, whereas for the experiments reported here phycocyanobilin has been employed. Interestingly, already Zhang et al. indicated the possibility of parallel conversion pathways or temperature-controlled equilibria between various intermediate states. Furthermore, the ortholog protein to CphA, Cph1, had been studied by laser flash photolysis yielding five intermediates with lifetimes of 5 and 300 μs, and 3, 30, and 300 ms (14,21), these parameters being in a similar time domain as those reported here for CphA.
Another feature that becomes evident from comparing the pure intermediate spectra (Fig. 4) is the position of the first detectable intermediate (for phyA coined I700 for its absorbance maximum). This intermediate, being red-shifted with respect to Pr in phyA65, coincides in CphA with the parent Pr state. Accordingly, a very small difference absorbance is found (Fig. 4, second panel). This finding is congruent with former studies at the ps timescale where the formation of this intermediate could be followed (12,35). Also in the ps time regime, the resulting difference spectrum showed very weak absorbance intensity. It might be argued that the low transient absorbance of this I700 intermediate in CphA might be due to more similar on- and off-rates, however, an inspection of the rate constants from this study and from Müller et al. (12) excludes this possibility and ascribes the observed low oscillator strength to the close, partly overlapping absorbance maxima of Pr and I700 states. Another intermediate with absorbance maximum close to that of Pr, but with lower oscillator strength, had been detected formerly (and is also found here) in the Pfr formation pathway for both proteins. This form, formerly coined meta-Ra or meta-Rc, or Ibl (bl, bleached), occurs during transient de- and reprotonation of the bilin-chromophore (14,45,46). It is conceivable that such deprotonation of the chromophore may shuffle the alternating single-/double-bond arrangement and allow thermally driven rearrangement of a single bond during the conformational accommodation of the photoisomerized chromophore in the binding pocket (note that protonation of conjugated double bond systems adds binding character to single bonds and reduces that of double bonds). Remarkably, such transient protonation change of the chromophore is not seen in the reverse (Pfr-to-Pr) process (this study).
The Pfr-to-Pr conversion has been studied here for the first time, to our knowledge, in a temperature range from 0 to 30°C and reveals most interesting kinetic and spectral features of the transiently formed intermediates. In their study, Chen et al. (40) identified only three intermediates, but similarly as here, these authors also note a much faster overall process than the forward conversion, and also indicate that the backward process does not share any intermediates with the forward pathway. For both proteins, all intermediates that could be detected, already exhibit the spectral features of the final Pr state, whereas, to compare with the forward reaction, the first intermediate in the Pr-to-Pfr conversion exhibits a lifetime of 30 μs (20°C, former studies report a lifetime of ∼90 μs at 10°C) (37). If investigations in the sub-ps-ns timescale are combined to the data presented here, the conversion process from Pfr to Pr is also initiated with a very bathochromically shifted intermediate (Ifr-750 in (12)), which then converts with a lifetime around 1 ps into a 670 nm form. It can be assumed that the very red-shifted Ifr-750 intermediate represents a vibrationally excited species (35). The ps photoisomerization of the protonated chromophore disrupts the positive charge compensation of the parent state and adds upon chromophore movement a more positive charge to the bilin moiety. This red-shifted species then immediately falls into a blue-shifted form, already very much akin the final Pr state. Overall, the Pfr-to-Pr conversion is significantly faster than the forward reaction. Because these conversion processes reflect the mutual interaction of chromophore and protein, it can be proposed that the protein, in its forward process, has to be forced into the Pfr state, allowing a thermally stable chromophore conformation with relatively high energy content, whereas the protein on its way back is already prone to adopt the 15E → 15Z isomerized chromophore.
As previously outlined, kinetic studies have predominantly been performed on the Pfr formation process. If the Pfr-to-Pr pathway had been investigated, this had been performed nearly exclusively at cryogenic temperatures. Yet, when results from these studies are included here, relevant structural information can be extracted. The ready formation of the Pr form in the reverse process had also been reported from low temperature Fourier-transform infrared studies (38,39,47) that showed no thermal activation process to exists for the Pr formation, in contrast to the Pfr formation where a remarkable temperature control had been identified. A comparison of the kinetic results reported here with recently reported low-temperature NMR-experiments reveals interesting structural details of the intermediates in the Pfr-to-Pr conversion. Although under the experimental conditions for cryogenic NMR measurements fewer intermediates could be trapped, the investigation confirms the mechanistic difference between forward- and backward conversion. During Pfr-to-Pr formation the hydrogen bonds (HBs) around the chromophore are maintained after the photoisomerization and are rearranged only in a later intermediate in such a way that loss of HBs is immediately compensated by formation of a new HB-network (25,44). This is in contrast to the forward reactions where transient de- and reprotonations have been identified (14,46). Interestingly, the measurements reported here concur with results from low temperature NMR- and vibrational spectroscopy work and highlight the remarkable differences in the protein reactivity for the forward and backward conversion processes of phytochrome.
The derived activation parameters (ΔH‡, ΔS‡) reflect the intermediate conversions: in the forward reaction of both proteins, ΔH‡ values vary maximally by a factor of two (phyA: between 45 and 82 kJ/mol, CphA: between 29 and 58 kJ/mol). In molecular terms, in all these transitions no large-scale structural changes are expected to occur, and even secondary structure elements are assumed to remain intact. Energy values around 50 kJ/mol were determined for several light-induced proteins (30). Apparently, such energy barriers are required to allow for rearrangements of hydrogen bonding networks or small lateral movements of protein domains or secondary structure elements, but are not sufficient for large unfolding/refolding of protein domains. Still, these energy values are found in a relatively small range, irrespective of the fact that the lifetimes of these conversions span a range from μs to ms, indicating that mostly entropy changes determine the reaction rates. Interestingly, when inspecting the reverse reaction, ΔH‡ is smallest for the first conversion (phyA, Δ: 34 kJ/mol, CphA: 41 kJ/mol), and remains relatively stable at higher energy values for the following conversions (phyA, Δ–Δ: 64, 75, 74 kJ/mol, CphA, Δ–Δ: 61, 63, 55 kJ/mol). This finding, though not very pronounced, concurs with the spectral changes: already the first detectable intermediate (and also all following ones) exhibits the spectral features of the Pr state, i.e., the protein in its Pfr state very readily adopts the Pr state when the reverse reaction is initiated.
The entropic parameters for the first conversion between intermediates 1 and 2 are negative for phyA (Δ: −6 J/mol K) and small for CphA (Δ: 20 J/mol K), probably reflecting the situation after the photoisomerization of the chromophore. This reaction determines the principal conformational changes of the chromophore, to which the protein has to follow to rearrange the hydrogen bonds and to compensate the positive charge of the chromophore. The following conversions of the medial intermediates yield the largest positive entropy values for both proteins and for both the forward and backward process, and indicate the largest degree of conformational freedom, quite in agreement with the observed temperature-controlled equilibria between the medial intermediates (Fig. 4).
An entropy comparison of the final conversions exhibits for CphA in both processes negative values (Δ, Δ for Pr-to-Pfr: −54, −118 J/mol K, respectively, and Δ for Pfr-to-Pr: −36 J/mol K), whereas the corresponding process of phyA has practically no entropy component: Δ: −6 ± 12 J/mol K. One should keep in mind that in the case of CphA the full-length protein was investigated (including the C-terminal histidine kinase domain), whereas in the case of phyA a truncated protein, i.e., only the photosensory domain (65 kDa, the N-terminal half) was measured. The strong negative entropy values found for full-length CphA indicate a formation of a highly ordered state. This might reflect the contribution of the histidine kinase domain that is known to adopt a homodimeric arrangement and thus might have an impact on the conformational changes also of the photosensory N-terminal part of this protein.
Overall, this study documents that the backward reaction of canonical phytochromes is not simply a reversion of the forward process, but reveals that both conversions follow individual, separate pathways. The reversion of Pfr into Pr identifies a special property of phytochromes such that the reformation of the Pr state is much more facilitated, as if the protein is more ready to adopt the Pr state after chromophore isomerization. This finding concurs with recent NMR measurements performed at cryogenic temperature (25,44). Furthermore, these experiments documented that the chromophore undergoes the largest conformational changes from Pfr to the first thermally stable intermediate and already adopts at this early step in the reversion process a Pr-like conformation.
Supporting Material
References
- 1.Davis S.J., Vener A.V., Vierstra R.D. Bacteriophytochromes: phytochrome-like photoreceptors from nonphotosynthetic eubacteria. Science. 1999;286:2517–2520. doi: 10.1126/science.286.5449.2517. [DOI] [PubMed] [Google Scholar]
- 2.Montgomery B.L., Lagarias J.C. Phytochrome ancestry: sensors of bilins and light. Trends Plant Sci. 2002;7:357–366. doi: 10.1016/s1360-1385(02)02304-x. [DOI] [PubMed] [Google Scholar]
- 3.Rockwell N.C., Su Y.S., Lagarias J.C. Phytochrome structure and signaling mechanisms. Annu. Rev. Plant Biol. 2006;57:837–858. doi: 10.1146/annurev.arplant.56.032604.144208. [DOI] [PMC free article] [PubMed] [Google Scholar]
- 4.Hughes J., Lamparter T., Börner T. A prokaryotic phytochrome. Nature. 1997;386:663. doi: 10.1038/386663a0. [DOI] [PubMed] [Google Scholar]
- 5.Essen L.O., Mailliet J., Hughes J. The structure of a complete phytochrome sensory module in the Pr ground state. Proc. Natl. Acad. Sci. USA. 2008;105:14709–14714. doi: 10.1073/pnas.0806477105. [DOI] [PMC free article] [PubMed] [Google Scholar]
- 6.Mroginski M.A., Kaminski S., Hildebrandt P. Structure of the chromophore binding pocket in the Pr state of plant phytochrome phyA. J. Phys. Chem. B. 2011;115:1220–1231. doi: 10.1021/jp108265h. [DOI] [PubMed] [Google Scholar]
- 7.Franklin K.A., Quail P.H. Phytochrome functions in Arabidopsis development. J. Exp. Bot. 2010;61:11–24. doi: 10.1093/jxb/erp304. [DOI] [PMC free article] [PubMed] [Google Scholar]
- 8.Quail P.H. Phytochrome photosensory signalling networks. Nat. Rev. Mol. Cell Biol. 2002;3:85–93. doi: 10.1038/nrm728. [DOI] [PubMed] [Google Scholar]
- 9.Su Y.S., Lagarias J.C. Light-independent phytochrome signaling mediated by dominant GAF domain tyrosine mutants of Arabidopsis phytochromes in transgenic plants. Plant Cell. 2007;19:2124–2139. doi: 10.1105/tpc.107.051516. [DOI] [PMC free article] [PubMed] [Google Scholar]
- 10.Andel F., 3rd, Murphy J.T., Mathies R.A. Probing the photoreaction mechanism of phytochrome through analysis of resonance Raman vibrational spectra of recombinant analogues. Biochemistry. 2000;39:2667–2676. doi: 10.1021/bi991688z. [DOI] [PubMed] [Google Scholar]
- 11.Linschitz H., Kasche V. Kinetics of phytochrome conversion: multiple pathways in the P(r) to P(fr) reaction, as studied by double-flash technique. Proc. Natl. Acad. Sci. USA. 1967;58:1059–1064. doi: 10.1073/pnas.58.3.1059. [DOI] [PMC free article] [PubMed] [Google Scholar]
- 12.Müller M.G., Lindner I., Holzwarth A.R. Femtosecond kinetics of photoconversion of the higher plant photoreceptor phytochrome carrying native and modified chromophores. Biophys. J. 2008;94:4370–4382. doi: 10.1529/biophysj.106.091652. [DOI] [PMC free article] [PubMed] [Google Scholar]
- 13.Rentsch S., Bischoff M., Strehlow D. Fs spectroscopic studies of the plant photoreceptor phytochrome. Appl. Phys. B. 1998;66:259–261. [Google Scholar]
- 14.van Thor J.J., Borucki B., Heyn M.P. Light-induced proton release and proton uptake reactions in the cyanobacterial phytochrome Cph1. Biochemistry. 2001;40:11460–11471. doi: 10.1021/bi002651d. [DOI] [PubMed] [Google Scholar]
- 15.Zhang C.-F., Farrens D.L., Kliger D.S. Time-resolved absorption studies of native etiolated oat phytochrome. J. Am. Chem. Soc. 1992;114:4569–4580. [Google Scholar]
- 16.Braslavsky S.E., Gärtner W., Schaffner K. Phytochrome photoconversion. Plant Cell Environ. 1997;20:700–706. [Google Scholar]
- 17.Foerstendorf H., Benda C., Siebert F. FTIR studies of phytochrome photoreactions reveal the C=O bands of the chromophore: consequences for its protonation states, conformation, and protein interaction. Biochemistry. 2001;40:14952–14959. doi: 10.1021/bi0156916. [DOI] [PubMed] [Google Scholar]
- 18.Matysik J., Hildebrandt P., Schaffner K. Fourier-transform resonance Raman spectroscopy of intermediates of the phytochrome photocycle. Biochemistry. 1995;34:10497–10507. doi: 10.1021/bi00033a023. [DOI] [PubMed] [Google Scholar]
- 19.Mroginski M.A., Murgida D.H., Hildebrandt P. The chromophore structural changes during the photocycle of phytochrome: a combined resonance Raman and quantum chemical approach. Acc. Chem. Res. 2007;40:258–266. doi: 10.1021/ar6000523. [DOI] [PubMed] [Google Scholar]
- 20.Mroginski M.A., von Stetten D., Hildebrandt P. Chromophore structure of cyanobacterial phytochrome Cph1 in the Pr state: reconciling structural and spectroscopic data by QM/MM calculations. Biophys. J. 2009;96:4153–4163. doi: 10.1016/j.bpj.2009.02.029. [DOI] [PMC free article] [PubMed] [Google Scholar]
- 21.Remberg A., Lindner I., Schaffner K. Raman spectroscopic and light-induced kinetic characterization of a recombinant phytochrome of the cyanobacterium Synechocystis. Biochemistry. 1997;36:13389–13395. doi: 10.1021/bi971563z. [DOI] [PubMed] [Google Scholar]
- 22.Rohmer T., Lang C., Matysik J. Light-induced chromophore activity and signal transduction in phytochromes observed by 13C and 15N magic-angle spinning NMR. Proc. Natl. Acad. Sci. USA. 2008;105:15229–15234. doi: 10.1073/pnas.0805696105. [DOI] [PMC free article] [PubMed] [Google Scholar]
- 23.Rohmer T., Strauss H., Matysik J. 15N MAS NMR studies of cph1 phytochrome: chromophore dynamics and intramolecular signal transduction. J. Phys. Chem. B. 2006;110:20580–20585. doi: 10.1021/jp062454+. [DOI] [PubMed] [Google Scholar]
- 24.Schwinte P., Foerstendorf H., Siebert F. FTIR study of the photoinduced processes of plant phytochrome phyA using isotope-labeled bilins and density functional theory calculations. Biophys. J. 2008;95:1256–1267. doi: 10.1529/biophysj.108.131441. [DOI] [PMC free article] [PubMed] [Google Scholar]
- 25.Song C., Psakis G., Matysik J. Two ground state isoforms and a chromophore D-ring photoflip triggering extensive intramolecular changes in a canonical phytochrome. Proc. Natl. Acad. Sci. USA. 2011;108:3842–3847. doi: 10.1073/pnas.1013377108. [DOI] [PMC free article] [PubMed] [Google Scholar]
- 26.Inoue Y., Rüdiger W., Furuya M. The phototransformation pathway of dimeric oat phytochrome from the red-light-absorbing form to the far-red-light-absorbing form at physiological temperature is composed of four intermediates. Photochem. Photobiol. 1990;52:1077–1083. [Google Scholar]
- 27.Scurlock R.D., Braslavsky S.E., Schaffner K. A phytochrome study using two-laser/two color flash photolysis: I700 is a mandatory intermediate in the Pr -> Pfr phototransformation. Photochem. Photobiol. 1993;57:690–695. [Google Scholar]
- 28.Mozley D., Remberg A., Gärtner W. Large-scale generation of affinity-purified recombinant phytochrome chromopeptide. Photochem. Photobiol. 1997;66:710–715. doi: 10.1111/j.1751-1097.1997.tb03211.x. [DOI] [PubMed] [Google Scholar]
- 29.Quest B., Gärtner W. Chromophore selectivity in bacterial phytochromes: dissecting the process of chromophore attachment. Eur. J. Biochem. 2004;271:1117–1126. doi: 10.1111/j.1432-1033.2004.04015.x. [DOI] [PubMed] [Google Scholar]
- 30.Chizhov I.V., Chernavskii D.S., Hess B. Spectrally silent transitions in the bacteriorhodopsin photocycle. Biophys. J. 1996;71:2329–2345. doi: 10.1016/S0006-3495(96)79475-4. [DOI] [PMC free article] [PubMed] [Google Scholar]
- 31.Chizhov I.V., Engelhard M. Temperature and halide dependence of the photocycle of halorhodopsin from Natronobacterium pharaonis. Biophys. J. 2001;81:1600–1612. doi: 10.1016/S0006-3495(01)75814-6. [DOI] [PMC free article] [PubMed] [Google Scholar]
- 32.Chizhov I.V., Schmies G., Engelhard M. The photophobic receptor from Natronobacterium pharaonis: temperature and pH dependencies of the photocycle of sensory rhodopsin II. Biophys. J. 1998;75:999–1009. doi: 10.1016/S0006-3495(98)77588-5. [DOI] [PMC free article] [PubMed] [Google Scholar]
- 33.Müller K.H., Butt H.J., Engelhard M. The reaction cycle of bacteriorhodopsin: an analysis using visible absorption, photocurrent and infrared techniques. Eur. Biophys. J. 1991;19:241–251. [Google Scholar]
- 34.Müller K.-H., Plesser T. Variance reduction by simultaneous multiexponential analysis of data sets from different experiments. Eur. Biophys. J. 1991;19:231–240. [Google Scholar]
- 35.Dasgupta J., Frontiera R.R., Mathies R.A. Ultrafast excited-state isomerization in phytochrome revealed by femtosecond stimulated Raman spectroscopy. Proc. Natl. Acad. Sci. USA. 2009;106:1784–1789. doi: 10.1073/pnas.0812056106. [DOI] [PMC free article] [PubMed] [Google Scholar]
- 36.Schmidt P., Gensch T., Schaffner K. The complexity of the Pr -> Pfr phototransformation kinetics is an intrinsic property of homogeneous native phytochrome. Photochem. Photobiol. 1998;68:754–761. [Google Scholar]
- 37.Schmidt P., Westphal U.H., Schaffner K. Chromophore-protein interaction controls the complexity of the phytochrome photocycle. J. Photochem. Photobiol. B. 1996;34:73–77. doi: 10.1016/1011-1344(95)07269-1. [DOI] [PubMed] [Google Scholar]
- 38.Foerstendorf H., Lamparter T., Siebert F. The photoreactions of recombinant phytochrome from the cyanobacterium Synechocystis: a low-temperature UV-Vis and FT-IR spectroscopic study. Photochem. Photobiol. 2000;71:655–661. doi: 10.1562/0031-8655(2000)071<0655:tporpf>2.0.co;2. [DOI] [PubMed] [Google Scholar]
- 39.Foerstendorf H., Mummert E., Siebert F. Fourier-transform infrared spectroscopy of phytochrome: difference spectra of the intermediates of the photoreactions. Biochemistry. 1996;35:10793–10799. doi: 10.1021/bi960960r. [DOI] [PubMed] [Google Scholar]
- 40.Chen E.F., Lapko V.N., Kliger D.S. Mechanism of native oat phytochrome photoreversion: a time-resolved absorption investigation. Biochemistry. 1996;35:843–850. doi: 10.1021/bi952115z. [DOI] [PubMed] [Google Scholar]
- 41.Remberg A., Schmidt P., Schaffner K. Differential effects of mutations in the chromophore pocket of recombinant phytochrome on chromoprotein assembly and Pr-to-Pfr photoconversion. Eur.J. Biochemistry. 1999;266:201–208. doi: 10.1046/j.1432-1327.1999.00844.x. [DOI] [PubMed] [Google Scholar]
- 42.Remberg A., Ruddat A., Schaffner K. Chromophore incorporation, Pr to Pfr kinetics, and Pfr thermal reversion of recombinant N-terminal fragments of phytochrome A and B chromoproteins. Biochemistry. 1998;37:9983–9990. doi: 10.1021/bi980575x. [DOI] [PubMed] [Google Scholar]
- 43.Kneip C., Hildebrandt P., Schaffner K. Protonation state and structural changes of the tetrapyrrole chromophore during the Pr —> Pfr phototransformation of phytochrome: a resonance Raman spectroscopic study. Biochemistry. 1999;38:15185–15192. doi: 10.1021/bi990688w. [DOI] [PubMed] [Google Scholar]
- 44.Rohmer T., Lang C., Matysik J. Phytochrome as molecular machine: revealing chromophore action during the Pfr —> Pr photoconversion by magic-angle spinning NMR spectroscopy. J. Am. Chem. Soc. 2010;132:4431–4437. doi: 10.1021/ja9108616. [DOI] [PubMed] [Google Scholar]
- 45.Borucki B. Proton transfer in the photoreceptors phytochrome and photoactive yellow protein. Photochem. Photobiol. Sci. 2006;5:553–566. doi: 10.1039/b603846h. [DOI] [PubMed] [Google Scholar]
- 46.von Stetten D., Seibeck S., Lamparter T. Highly conserved residues Asp-197 and His-250 in Agp1 phytochrome control the proton affinity of the chromophore and Pfr formation. J. Biol. Chem. 2007;282:2116–2123. doi: 10.1074/jbc.M608878200. [DOI] [PubMed] [Google Scholar]
- 47.Schwinté P., Gärtner W., Siebert F. The photoreactions of recombinant phytochrome CphA from the cyanobacterium Calothrix PCC7601: a low-temperature UV-Vis and FTIR study. Photochem. Photobiol. 2009;85:239–249. doi: 10.1111/j.1751-1097.2008.00426.x. [DOI] [PubMed] [Google Scholar]
Associated Data
This section collects any data citations, data availability statements, or supplementary materials included in this article.