

Abstract
The ability of biomolecules to fold and to bind to other molecules is fundamental to virtually every living process. Advanced experimental techniques can now reveal how single biomolecules fold or bind against mechanical force, with the force serving as both the regulator and the probe of folding and binding transitions. Here, we present analytical expressions suitable for fitting the major experimental outputs from such experiments to enable their analysis and interpretation. The fit yields the key determinants of the folding and binding processes: the intrinsic on-rate and the location and height of the activation barrier.
Dynamic processes in living cells are regulated through conformational changes in biomolecules—their folding into a particular shape or binding to selected partners. The ability of biomolecules to fold and to bind enables them to act as switches, assembly factors, pumps, or force- and displacement-generating motors (1). Folding and binding transitions are often hindered by a free energy barrier. Overcoming the barrier requires energy-demanding rearrangements such as displacing water from the sites of native contacts and breaking nonnative electrostatic contacts, as well as loss of configurational entropy. Once the barrier is crossed, the folded and bound states are stabilized by short-range interactions: hydrogen bonds, favorable hydrophobic effects, and electrostatic and van der Waals attractions (2).
Mechanistic information about folding and binding processes is detailed in the folding and binding trajectories of individual molecules: observing an ensemble of molecules may obscure the inherent heterogeneity of these processes. Single-molecule trajectories can be induced, and monitored, by applying force to unfold/unbind a molecule and then relaxing the force until folding or binding is observed (3–5) (Fig. 1). Varying the force relaxation rate shifts the range of forces at which folding or binding occurs, thus broadening the explorable spectrum of molecular responses to force and revealing conformational changes that are otherwise too fast to detect. The measured force-dependent kinetics elucidates the role of force in physiological processes (6) and provides ways to control the timescales, and even the fate, of these processes. The force-dependent data also provides a route to understanding folding and binding in the absence of force—by extrapolating the data to zero force via a fit to a theory.
Figure 1.
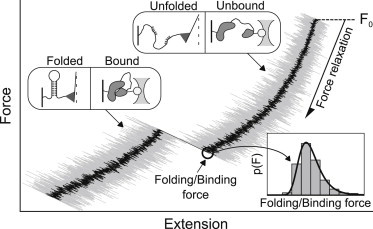
Schematic of the output from a force-relaxation experiment. The applied force is continuously relaxed from the initial value F0 until the biomolecule folds or binds, as signified by a sharp increase in the measured force. From multiple repeats of this experiment, distributions of the folding or binding forces are collected (inset). Fitting the force distributions with the derived analytical expression yields the key parameters that determine the kinetics and energetics of folding or binding.
In this letter, we derive an analytical expression for the distribution of transition forces, the major output of force-relaxation experiments that probe folding and binding processes. The expression extracts the key determinants of these processes: the on-rate and activation barrier in the absence of force. The theory is first developed in the context of biomolecular folding, and is then extended to cover the binding of a ligand tethered to a receptor. In contrast to unfolding and unbinding, the reverse processes of folding and binding require a theory that accounts for the compliance of the unfolded state, as well as the effect of the tether, to recover the true kinetic parameters of the biomolecule of interest.
In a force-relaxation experiment, an unfolded biomolecule or unbound ligand-receptor complex is subject to a stretching force, which is decreased from the initial value F0 as the pulling device approaches the sample at speed V until a folding or binding transition is observed (Fig. 1) (3–5). Define S(t) as the probability that the molecule has not yet escaped from the unfolded (implied: or unbound) state at time t. When escape is limited by one dominant barrier, S(t) follows the first-order rate equation
where k←(F(t)) is the on-rate at force F at time t. Because, prior to the transition, the applied force decreases monotonically with time, the distribution of transition forces, p(F), is related to S(t) through , yielding
| (1) |
Here is the force relaxation rate. The proper normalization of p(F) is readily confirmed by integrating Eq. 1 from the initial force F0 to negative infinity, the latter accounting for transitions that do not occur by the end of the experiment. Note that the expression for the distribution of folding/binding forces in Eq. 1 differs from its analog for the unfolding process (7) by the limits of integration and a negative sign, reflecting the property of a relaxation experiment to decrease the survival probability S(t) by decreasing the force. Converting the formal expression in Eq. 1 into a form suitable for fitting experimental data requires establishing functional forms for k←(F) and and analytically solving the integral. These steps are accomplished below.
The on-rate k←(F) is computed by treating the conformational dynamics of the molecule as a random walk on the combined free energy profile G(x,t) = G0(x) + Gpull(x,t) along the molecular extension x. Here G0(x) is the intrinsic molecular potential and Gpull(x,t) is the potential of the pulling device. When G(x,t) features a high barrier on the scale of kBT (kB is the Boltzmann constant and T the temperature), the dynamics can be treated as diffusive. The unfolded region of the intrinsic potential for a folding process, unlike that for a barrierless process (8), can be captured by the function
which has a sharp (if ν = 1/2, Fig. 2, inset) or smooth (if ν = 2/3) barrier of height ΔG‡ and location x‡. The potential of a pulling device of stiffness κS is Gpull(x,t) = κS/2(X0 – Vt – x)2 with an initial minimum at X0 (corresponding to F0). Applying Kramers formalism (9) to the combined potential G(x,t), we establish the analytical form of the on-rate at force F(t),
where k0 is the intrinsic on-rate, β ≡ (kBT)−1, and
is the stiffness of the unfolded biomolecule under force F (see the Supporting Material for details on all derivations). The full nonlinear form of Gpull(x,t) was necessary in the derivation because, in contrast to the typically stiff folded state, the unfolded state may be soft (to be exact, 1/2κS x‡2(F) << kBT may not be satisfied) and thus easily deformed by the pulling device. Because of this deformation, the folding transition faces an extra contribution (regulated by the ratio κS/κU(F)) to the barrier height, typically negligible for unfolding, that decreases the on-rate in addition to the applied force F.
Figure 2.

Contributions to the free energy profile for folding (inset) and binding (main figure). The derived expression (Eq. 2) extracts the on-rate and the location and height of the activation barrier to folding. When applied to binding data, the expression extracts the parameters of the ligand-tether-receptor (LTR) potential (x); the proposed algorithm (Eqs. 3 and 4) removes the contribution of the tether potential Gteth(x) to recover the parameters of the intrinsic ligand-receptor (LR) potential G0(x).
The last piece required for Eq. 1, the loading rate , is computed as the time derivative of the force F(t) on the unfolded molecule at its most probable extension at time t:
Finally, we realize that the integral in Eq. 1 can be solved analytically exactly, both for ν = 1/2 and ν = 2/3, resulting in the analytical expression for the distribution of folding forces:
| (2) |
Equation 2 can be readily applied to (normalized) histograms from force-relaxation experiments to extract the parameters of the intrinsic kinetics and energetics of folding. Being exact for ν = 1/2 and ν = 2/3, Eq. 2 is also an accurate approximation for any ν in the interval 1/2 < ν < 2/3 as long as κS ≲ κU (F) (see Fig. S1 in the Supporting Material). For simplicity, in Eq. 2 we have omitted the term containing F0 as negligible if F0 is large enough to prevent folding events.
The solution in Eq. 2 reveals properties of the distribution of folding forces that distinguish it from its unfolding counterpart (7):
-
1.
The distribution has a positive skew (Fig. 3), as intuitively expected: the rare folding events occur at high forces when the barrier is still high.
-
2.
Increasing the relaxation speed shifts the distribution to lower forces (Fig. 3): faster force relaxation leaves less time for thermal fluctuations to push the system over a high barrier, causing transitions to occur later (i.e., at lower forces), when the barrier is lower.
-
3.
The stiffness κS and speed V enter Eq. 2 separately, providing independent routes to control the range of folding forces and thus enhance the robustness of a fit.
Figure 3.

Force histograms from folding (left) and binding (right) simulations at several values of the force-relaxation speed (in nanometers per second, indicated at each histogram). Fitting the histograms with the analytical expression in Eq. 2 (lines) recovers the on-rate and activation barrier for folding or binding (Table 1).
The application of the above framework to binding experiments on a ligand and receptor connected by a tether (3) involves an additional step—decoupling the effect of the tether—to reconstruct the parameters of ligand-receptor binding. Indeed, the parameters extracted from a fit of experimental histograms to Eq. 2 characterize the ligand-tether-receptor (LTR) potential (, , , ν) (Fig. 2). The parameters of the natural ligand-receptor (LR) potential (k0, x‡, ΔG‡) can be recovered using three characteristics of the tether: contour length L; persistence length p; and extension Δℓ of the tether along the direction of the force in the LTR transition state. The values of L and p can be determined from the force-extension curve of the tether (10); these define the tether potential Gteth(x) (Fig. 2). The value of Δℓ can be found from an unbinding experiment (7) on LTR and the geometry of the tether attachment points (see Fig. S3). Approximating the region of the LR potential between the transition and unbound states as harmonic, with no assumptions about the shape of the potential beyond x‡, the ligand-receptor barrier parameters are then
| (3) |
and the intrinsic unimolecular association rate is
| (4) |
Here, the force value is extracted from the force-extension curve of the tether at extension and
where Gteth(x) is the wormlike-chain potential (see Eq. S13 in the Supporting Material). Equations 3–4 confirm that a tether decreases the height and width of the barrier (see Fig. 2), thus increasing the on-rate.
In Fig. 3, the developed analytical framework is applied to folding and binding force histograms from Brownian dynamics simulations at parameters similar to those in the analogous experimental and computational studies (3,5,11) (for details on simulations and fitting procedure, see the Supporting Material). For the stringency of the test, the simulations account for the wormlike-chain nature of the molecular unfolded and LTR unbound states that is not explicitly accounted for in the theory. With optimized binning (12) of the histograms and a least-squares fit, Eqs. 2–4 recover the on-rate, the location and the height of the activation barrier, and the value of ν that best captures how the kinetics scale with force (Table 1). The accuracy of the extracted parameters can be enhanced by ensuring that the data sets possess:
-
1.
Multiple relaxation speeds,
-
2.
Folding/binding events at low forces, and
-
3.
A large number of events at each speed.
Table 1.
On-rate and the location and height of the activation barrier from the fit of simulated data to the theory in Eq. 2
| Folding | k0 (s−1) | x‡ (nm) | ΔG‡ (kBT) | ν |
| True | 9.5 × 10³ | 2.2 | 2.0 | — |
| Fit | 8 ± 2 × 10³ | 2.2 ± 0.2 | 1.8 ± 0.5 | 0.54a |
| Binding (LTR) | (s−1) | (nm) | (kBT) | ν |
| True | 28 | 1.56 | 1.7 | — |
| Fit | 24 ± 3 | 1.57 ± 0.09 | 1.8 ± 0.4 | 0.53a |
| Binding (LR) | k0 (s−1) | x‡ (nm) | ΔG‡ (kBT) | — |
| True | 2.8 | 3.0 | 4.0 | — |
| Fit | 2.7 ± 0.2 | 2.9 ± 0.1 | 4.1 ± 0.1 | — |
Fixed at value that minimized least-squares error.
Acknowledgments
We thank Robert Best, Brian Camley, Nathan Hudson, Jongseong Kim, Timothy Springer, Debarati Chatterjee, Ashok Garai, and Yaojun Zhang for valuable discussions.
This research was supported by National Science Foundation CAREER grant No. MCB-0845099.
Supporting Material
References
- 1.Alberts B., Johnson A., Walter P. Garland Science; New York: 2007. Molecular Biology of the Cell. [Google Scholar]
- 2.Fersht A.R. W.H. Freeman; New York: 1999. Structure and Mechanism in Protein Science. [Google Scholar]
- 3.Kim J., Zhang C.Z., Springer T.A. A mechanically stabilized receptor-ligand flex-bond important in the vasculature. Nature. 2010;466:992–995. doi: 10.1038/nature09295. [DOI] [PMC free article] [PubMed] [Google Scholar]
- 4.Gebhardt J.C.M., Bornschlögl T., Rief M. Full distance-resolved folding energy landscape of one single protein molecule. Proc. Natl. Acad. Sci. USA. 2010;107:2013–2018. doi: 10.1073/pnas.0909854107. [DOI] [PMC free article] [PubMed] [Google Scholar]
- 5.Yu H., Gupta A.N., Woodside M.T. Energy landscape analysis of native folding of the prion protein yields the diffusion constant, transition path time, and rates. Proc. Natl. Acad. Sci. USA. 2012;109:14452–14457. doi: 10.1073/pnas.1206190109. [DOI] [PMC free article] [PubMed] [Google Scholar]
- 6.Bustamante C., Chemla Y.R., Izhaky D. Mechanical processes in biochemistry. Annu. Rev. Biochem. 2004;73:705–748. doi: 10.1146/annurev.biochem.72.121801.161542. [DOI] [PubMed] [Google Scholar]
- 7.Dudko O.K., Hummer G., Szabo A. Intrinsic rates and activation free energies from single-molecule pulling experiments. Phys. Rev. Lett. 2006;96:108101. doi: 10.1103/PhysRevLett.96.108101. [DOI] [PubMed] [Google Scholar]
- 8.Tshiprut Z., Urbakh M. Exploring hysteresis and energy dissipation in single-molecule force spectroscopy. J. Chem. Phys. 2009;130:084703. doi: 10.1063/1.3077867. [DOI] [PubMed] [Google Scholar]
- 9.Kramers H.A. Brownian motion in a field of force and the diffusion model of chemical reactions. Physica. 1940;7:284–304. [Google Scholar]
- 10.Marko J.F., Siggia E.D. Stretching DNA. Macromolecules. 1995;28:8759–8770. [Google Scholar]
- 11.Best R.B., Hummer G. Protein folding kinetics under force from molecular simulation. J. Am. Chem. Soc. 2008;130:3706–3707. doi: 10.1021/ja0762691. [DOI] [PubMed] [Google Scholar]
- 12.Doane D.P. Aesthetic frequency classification. Am. Stat. 1976;30:181–183. [Google Scholar]
Associated Data
This section collects any data citations, data availability statements, or supplementary materials included in this article.