

Abstract
Background/Objective
Vitamin D has anti-inflammatory and immune-regulating properties. We aimed to determine if high-dose cholecalciferol supplementation for 1 yr in subjects with early CKD improved circulating markers of inflammation and immunity.
Subjects/Methods
In this double-blind, randomized, placebo-controlled trial, 46 subjects with early CKD (Stage 2–3) were supplemented with oral cholecalciferol (50 000 IU weekly for 12 weeks followed by 50 000 IU every other wk for 40 wks) or a matching placebo for 1 yr. Serum tumor necrosis factor-α, interleukin-6, monocyte chemoattractant protein-1 (MCP-1), interferon gamma-induced protein-10, and neutrophil gelatinase-associated lipocalin were measured at baseline, 12 wks, and 1 yr. Serum cathelicidin (LL-37) was measured at baseline and 12 wks. An in vitro experiment was performed to investigate the effect of 1,25-dihydroxyvitamin D3 (1,25(OH)2D3) treatment on MCP-1 secretion in THP-1 monocytes activated with lipopolysaccharide (LPS) and Pseudomonas aeruginosa.
Results
By 12 wks, serum MCP-1 decreased in the cholecalciferol group (66.2 ± 2.5 to 60.8 ± 2.6 pg/mL, group-by-time interaction P = 0.02) but was not different from baseline at 1 yr. Other markers of inflammation and immunity did not change. In vitro, LPS- and Pseudomonas-activated monocytes treated with1,25(OH)2D3 had significantly less MCP-1 secretion compared to untreated cells.
Conclusions
High-dose cholecalciferol decreased serum MCP-1 concentrations by 12 wks in patients with early CKD, although the decrease was not maintained for the remainder of the year. In vitro results confirm an MCP-1-lowering effect of vitamin D. Future studies should determine if vitamin D-mediated reductions in MCP-1 concentrations reflect improved clinical outcomes.
Keywords: vitamin D, chronic renal insufficiency, cytokines, immune markers, cathelicidin, monocyte chemoattractant protein-1, chronic kidney disease, inflammation
INTRODUCTION
Patients with chronic kidney disease (CKD) experience progressive impairment of vitamin D metabolism, thus increasing the risk for metabolic bone disease1 and possibly cardiovascular disease2. A chronically activated and dysregulated immune system with accompanying elevated inflammatory mediators and biomarkers is also characteristic of CKD3,4. This sustained state of immune dysregulation and inflammation provides a pathological connection to the increased risk for both cardiovascular morbidity/mortality5 and infection-associated morbidity/mortality6 that occur with CKD. In vitro, 1,25-dihydroxyvitamin D [1,25(OH)2D3], the hormonally active form of vitamin D, has both anti-inflammatory and immune-regulating properties by decreasing the production of inflammatory cytokines7,8 and by upregulating the production of the antimicrobial peptide, LL-37 or cathelicidin9,10, in a variety of cell types. Furthermore, vitamin D has been implicated in all-cause and cardiovascular mortality risk11, as well as infectious mortality risk12,13, in CKD. Thus, achievement and maintenance of adequate vitamin D status may play a role in managing inflammation and immunity, and ultimately, reducing morbidity and mortality in patients with CKD. Few studies have investigated systemic effects of long-term vitamin D supplementation on markers of inflammation and innate immunity in patients with CKD. The purpose of this clinical study was to investigate whether high-dose cholecalciferol (vitamin D3) supplementation for 1 yr improved circulating markers of inflammation and immunity in patients with early stage CKD.
MATERIALS AND METHODS
Subjects and Protocol
The protocol for this double-blind, randomized, placebo-controlled study has been previously described14. Briefly, inclusion for the study were ages 18–90 yr and an estimated glomerular filtration rate (eGFR) < 90 ml/min/1.73m2. Participants were excluded for use of active vitamin D analogs, calcimemetics, or any other medication that may influence vitamin D metabolism; intake of >1000 IU vitamin D through supplements; history of liver failure, intestinal malabsorption, or chronic diarrhea; and/or an elevated serum calcium (> 10.5 mg/dL, corrected for albumin). Forty-six patients with stage 2 and 3 CKD [based on eGFR of 60–89 mL/min/1.73 m2 for CKD Stage 2 and eGFR 30–59 mL/min/1.73 m2 for Stage 3, calculated using the Modification of Diet in Renal Disease Study equation15] were randomized to 50 000 IU cholecalciferol (vitamin D3, Tischon, Salisbury, MD) weekly for 12 weeks followed by 50 000 IU cholecalciferol every other week for 40 weeks (vitamin D group) or matching placebo (Tischon, Salisbury, MD). Participants were seen at baseline, 12 weeks, and 52 weeks. Whole blood was collected, processed for serum and stored at −80°C at each visit. This study was approved by the Emory Institutional Review Board and the VA Research and Development Committee, and all participants provided informed consent upon enrollment. This trial is registered at Clinical Trials.gov # NCT00781417.
Analytic Methods
Serum 25(OH)D was assayed using a chemiluminescent technique with an automated machine (Immunodiagnostic Systems iSYS automated machine; Fountain Hills, AZ)14. Serum tumor necrosis factor-α (TNF-α), interleukin-6 (IL-6), monocyte chemoattractant protein-1 (MCP-1; also known as chemokine (C-C motif) ligand 2, CCL2, or small inducible cytokine A2), interferon gamma-induced protein-10 (IP-10; also known as C-X-C motif chemokine 10, CXCL10, or small-inducible cytokine B10), and neutrophil gelatinase-associated lipocalin (NGAL; also known as lipocalin-2 or oncogene 24p3) were assayed simultaneously under the same experimental ELISA conditions (DuoSet ELISA, R&D Systems, Minneapolis, MN) following the manufacturer instructions. Serum LL-37 was assayed with ELISA (Hycult Biotech, Uden, The Netherlands). All samples were de-identified and assayed blindly in duplicate; values with a CV >20% were excluded from analyses.
In vitro experiment: MCP-1 release from activated monocytes upon vitamin D treatment
The human monocytic cell line THP-1 was grown in RPMI 1640 medium (Cellgro Mediatech; Herdon, VA) supplemented with 10% fetal bovine serum and 50 IU/mL of Penicillin and 50 μg/ml of Streptomycin as described16. Confluent THP-1 cells were counted and adjusted to 1 × 10⁶ cell/mL then transferred into a 6-well tissue culture plate and treated with 40nM 1,25 (OH)2D3 (Sigma; St. Louis, MO) for 48 hours. Control cells were treated with equal volume of PBS with 5% (v/v) ethanol. After 48 hr of incubation at 37°C with 5% CO2, treated and untreated THP-1 cells were stimulated with 10 pmol/mL (20 ng/ml) of purified lipopolysaccharide (LPS) derived from Pseudomonas aeruginosa (P. aeruginosa)17 or infected with P. aeruginosa at 10 multiplicity of infection (MOI) then incubated overnight at 37°C. For the infection assay, 1 ml of THP-1 monocyte culture was transferred into a 1.5 ml Eppendorf tube and infected with live P. aeruginosa strain PAO1 at 10 multiplicity of infection (MOI) for 60 min. Infected monocytes were then spun down to remove bacteria followed by washing with PBS. Infected monocytes were then resuspended in 1 ml RPMI 1640 medium supplemented with 10% FBS, 50 IU/ml of penicillin, 50 μg/ml of streptomycin, and 10 μg/ml of gentamycin, transferred into 24-well tissue culture plates, and incubated overnight at 37°C with humidity and 5% CO2. Supernatants were collected for MCP-1 determination using ELISA (DuoSet ELISA, R&D Systems; Minneapolis, MN) method as described17.
Statistical analyses
Descriptive statistics are reported as mean ± SD or median (IQR). T-tests, chi-squared tests, and ANCOVA were used to determine differences between groups. Pearson correlations or Spearman correlations were used to investigate baseline relationships of serum 25(OH)D with serum markers of inflammation and immunity as well as relationships between percent change in serum 25(OH)D from baseline and percent change in serum markers of inflammation and immunity. Multiple linear regression analysis (MLR) was used to investigate relationships independent of age, sex, BMI, and race. Paired t-tests or Wilcoxon signed rank tests were used to determine changes in outcomes from baseline to 12 weeks and from baseline to 52 weeks for each treatment group. Mixed-model repeated measures ANOVA and ANCOVA were also used to investigate group-by-time interaction effects. A post-hoc forward stepwise linear regression analysis was performed with MCP-1 as the dependent variable. Variables explored were age, sex, BMI, race, HTN, DM, 25(OH)D, PTH, and fibroblast growth factor-23 (FGF23). A P-value of 0.15 was set for variables to enter and exit the model. All analyses were based on intention-to-treat. Statistical analyses were performed with JMP (version 9.0.0; SAS Institute Inc.; Cary, NC); all tests were two-sided and assumed a 5% significance level.
RESULTS
Clinical Study
Participant characteristics of the cohort are described in Table 1. The majority of the participants was male, had hypertension, and had type 1 or type 2 diabetes mellitus. Baseline serum 25(OH)D and markers of inflammation and immunity within each treatment group are presented in Table 2. As previously reported, serum 25(OH)D was higher in the placebo group compared to the cholecalciferol group (32 ± 9 vs 27 ± 7 ng/ml, P = 0.03), and the prevalence of type 2 diabetes was higher in the cholecalciferol group (86% vs 54%, P = 0.02)14. All other characteristics were similar between the groups. Baseline serum concentrations of the measured markers of inflammation and immunity did not differ between groups.
Table 1.
Participant characteristics at baseline (N = 46)1
| Age (y) | 62.5 ± 9.6 |
| BMI (kg/m2) | 32.1 ± 6.4 |
| Male [n (%)] | 42 (91.3%) |
| African American [n (%)] | 22 (47.8%) |
| eGFR (mL/min/1.73m2) | 61.5 ± 15.5 |
| CKD Stage II/III2 [n (%)] | 21 (45.7%) / 25 (54.3%) |
| Hypertension [n (%)] | 41 (89.1%) |
| Total diabetes mellitus [n (%)] | 38 (82.6%) |
| Type 2 diabetes mellitus [n (%)] | 32 (69.6%) |
Reported as mean ± SD or n (%). Abbreviations: BMI, body mass index; eGFR, estimated glomerular filtration rate (calculated using the Modification of Diet in Renal Disease Study equation); CKD, chronic kidney disease
One subject with stage I CKD was grouped with stage II subjects and 1 subject with stage IV CKD was grouped with stage III subjects.
Table 2.
Baseline serum 25(OH)D and markers of inflammation and immunity by treatment1
| Placebo (n = 24) | Vitamin D (n = 22) | |
|---|---|---|
| 25(OH)D (ng/ml) | 32 ± 92 | 27 ± 7 |
| TNF-α (pg/ml) | 54.0 (50.1, 59.8) | 54.5 (50.5, 68.6) |
| IL-6 (pg/ml) | 39.0 (37.5, 43.5)3 | 40.8 (38.6, 44.8)5 |
| NGAL (ng/ml) | 27.0 ± 5.8 | 24.83 ± 5.5 |
| MCP-1 (pg/ml) | 61.5 ± 8.74 | 68.1 ± 16.7 |
| IP-10 (pg/ml) | 97.2 (78.4, 118.8) | 102.3 (78.7, 135.3) |
| LL-37 (ng/ml) | 45.5 (41.1, 54.1) | 44.3 (37.4, 55.4)5 |
Values reported as median (IQR) or mean (±SD). Abbreviations: 25(OH)D, 25-hydroxyvitamin D; TNF-α, tumor necrosis factor-α; IL-6, interleukin-6; NGAL, neutrophil gelatinase-associated lipocalin; MCP-1, monocyte chemoattractant protein-1; IP-10, interferon gamma-induced protein-10; LL-37, cathelicidin.
P for group difference = 0.03
n = 23,
n = 21,
n = 20
Pearson correlation analysis indicated that baseline serum 25(OH)D from all study participants was significantly inversely associated with baseline serum MCP-1 (Figure 1). This relationship was independent of age, sex, BMI, and race, as determined by MLR (Std Beta = −0.46, P = 0.003). There was no significant relationship between baseline serum 25(OH)D and other serum markers of inflammation and immunity. In a post-hoc forward stepwise linear regression analysis with MCP-1 as the dependent variable, both 25(OH)D (Std Beta = −0.52, P < 0.001) and FGF23 (Std Beta = 0.33, P = 0.01) emerged as significant, independent predictors of MCP-1.
Figure 1. Relationship between baseline monocyte chemoattractant protein-1 (MCP-1) and baseline 25-hydroxyvitamin D [25(OH)D].
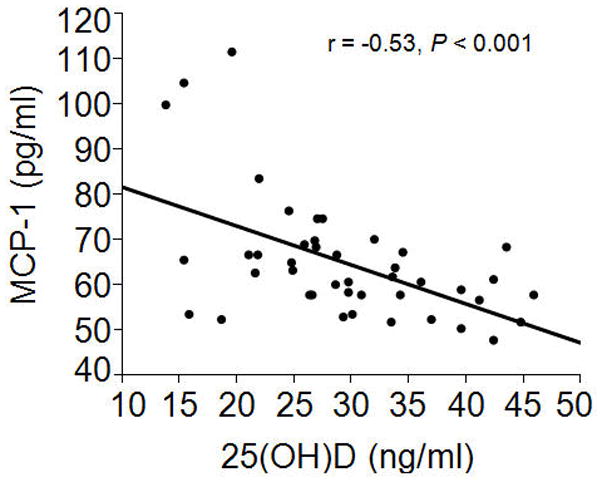
Baseline concentrations of serum MCP-1 were significantly, inversely associated with baseline serum 25(OH)D in patients with early stage chronic kidney disease (n = 43).
The percent changes in 25(OH)D and markers of inflammation and immunity from baseline to 12 wks and 52 wks, respectively, are presented in Table 3. By 12 wks, there was a 6.5% increase in MCP-1 in the placebo group vs a 6.2% decrease in the cholecalciferol group (2 group t-test, P = 0.009). The percent change in serum 25(OH)D at 12 weeks was significantly associated with the percent change in MCP-1 at 12 wks (r = −0.43, P = 0.005, Figure 2). The group-by-time interaction for MCP-1 was statistically significant (P = 0.02). The group-by-time interaction for MCP-1 remained significant (P = 0.02) after adjusting for baseline 25(OH)D concentrations. There were no changes or group differences in TNF-α, IL-6, NGAL, IP-10, or LL-37 at 12 wks. There were no changes or group differences in any of the measured markers of inflammation and immunity at 1 yr.
Table 3.
Percent changes in serum 25(OH)D and markers of inflammation and immunity from baseline at 12 wks and 1 yr among all subjects1
| Vitamin D | Placebo | |||
|---|---|---|---|---|
| 12 wks | 1 yr | 12 wks | 1 yr | |
| 25(OH)D (%) | 77 ± 1222, 3 | 73 ± 114 | −18 ± 19 | −5 ± 19 |
| TNF (%) | −2.8 (−10.6, 2.1) | 1.1 (−5.6, 16.0)– | −0.9 (−3.2, 3.2) | 0.9 (−6.0, 7.8) |
| IL-6 (%) | 1.2 (−2.6, 13.2) | 2.2 (−10.1, 10.4) | 1.3 (−2.6, 7.4) | 1.3 (−7.0, 3.6) |
| NGAL (%) | −6.7 ± 15.92 | 2.5 ± 36.9 | −0.1 ± 16.8 | −4.3 ± 24.5 |
| MCP-1 (%) | −6.2 ± 13.32, 3 | −3.0 ± 14.5 | 6.5 ± 14.22 | 2.5 ± 13.2 |
| IP-10 (%) | 1.6 (−4.2, 12.3) | −1.3 (−15.9, 28.0) | 1.5 (−5.2, 10.5) | 3.3 (–8.9, 13.3) |
| LL-37 (%) | 1.9 (−3.9, 15.0) | ----- | 2.01 (−3.1, 11.7) | ----- |
Value reported as median (IQR) or mean (±SD). Abbreviations: 25(OH)D, 25-hydroxyvitamin D; TNF-α, tumor necrosis factor-α; IL-6, interleukin-6; NGAL, neutrophil gelatinase-associated lipocalin; MCP-1, monocyte chemoattractant protein-1; IP-10, interferon gamma-induced protein-10; LL-37, cathelicidin.
P < 0.10 for change from baseline (Wilcoxon signed rank test or paired t-test)
P < 0.05 for difference from placebo (Wilcoxon rank sum test or two-group t-test)
Figure 2. Relationship between percent change in 25-hydroxyvitamin D [25(OH)D] and percent change in monocyte chemoattractant protein-1 (MCP-1) at 12 wks.
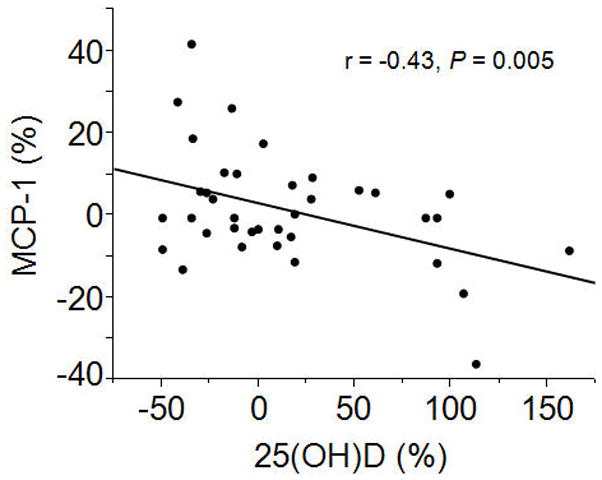
After receiving 50 000 IU cholecalciferol weekly for 12 wks or matching placebo, the percent change in 25(OH)D was significantly, inversely associated with percent change in MCP-1 in patients with early stage chronic kidney disease (n = 37).
In vitro Study
To confirm our in vivo observation that high-dose cholecalciferol reduces MCP-1 concentrations, we employed THP-1 human monocytic cells in an in vitro 1,25(OH)2D3 treatment and activation study. In the THP-1 monocyte cells incubated with 40nM 1,25(OH)2D3, the basal secretion of MCP-1 was 45 ± 2 pg/mL compared to 49 ± 2 pg/mL in untreated cells (P = 0.13). Treatment of THP-1 monocytes with 40nM of 1,25(OH)2D3 resulted in significantly less (P = 0.047) MCP-1 secretion upon activation with LPS, a TLR4 ligand, compared to LPS-activated cells not treated with 1,25(OH)2D3 (Figure 3A). Further, 1,25(OH)2D3-treated THP-1 monocytes exposed to live bacterial infection with Pseudomonas aeruginosa had significantly (P = 0.006) reduced levels of MCP-1 release compared to infected cells not treated with 1,25(OH)2D3 (Figure 3B).
Figure 3. 1,25-dihydroxyvitamin D3 reduces monocyte chemoattractant protein-1 (MCP-1) release from activated monocytes.

Human THP-1 monocyte cells were treated with 40nM of 1,25-dihydroxyvitamin D3 (1,25(OH)2D3) for 48 hr prior to activation with 10 pmol/mL of purified lipopolysaccharide (LPS) (A) or infection with Pseudomonas aeruginosa at 10 MOI (B). MCP-1 release into the supernatants of activated monocytes was measured by ELISA. Error bars represent ± SD of triplicate readings of each sample. P-value was calculated using the Student t-test.
DISCUSSION
In a randomized, placebo-controlled, double-blind study we have shown that high dose cholecalciferol supplementation reduced circulating serum concentrations of MCP-1 after 12 weeks in patients with early stage CKD, although effects were not maintained by 1 yr, and changes were not shown in serum concentrations of TNF-α, IL-6, NGAL, IP-10, or LL-37. We have supplemented these clinical results with an in vitro experiment demonstrating that 1,25(OH)2D3 reduces secretion of MCP-1 by cells exposed to live bacteria and/or LPS. Our data support the hypothesis that vitamin D plays an important role in regulating inflammatory and immune processes, especially with regards to chemokine secretion.
Monocyte chemoattractant protein-1 is a chemokine secreted by various cell types, including cells of the renal system18,19. It is involved in the development and progression of renal injury19; circulating concentrations may predict cardiovascular outcomes20; and it is elevated during infection21. MCP-1 may, therefore, be a potentially useful biomarker for clinical outcomes in CKD. The active form of vitamin D (1,25(OH)2D) has been shown in vitro to downregulate the secretion MCP-1 in various cell types, including preadipocytes22, adipocytes23, human annulus cells24, mesangial cells25, monocyte-derived dendritic cells26, and human primary proximal tubular epithelial cells27. We confirm these findings in yet another cell type. Our results indicate that 1,25(OH)2D3 treatment directly impacts MCP-1 release from THP-1 monocytes and, therefore, exerts a modulatory effect on monocyte response to infection and inflammatory signals. Vitamin D may indirectly modulate MCP-1 secretion through inhibition of NF-κB activation25. To our knowledge, we are the first to demonstrate an in vivo reduction in circulating MCP-1 concentrations in patients with CKD who were supplemented with high-dose cholecalciferol. We did not, however, find a change in the chemokine IP-10. Bischoff-Ferrari et al.28 recently reported a decrease in circulating serum markers of innate immunity, including MCP-1 and IP-10, in generally healthy postmenopausal women treated with cholecalciferol (800 IU) or 25(OH)D3 (20 μg) for 4 months. In contrast, Kim et al.29 did not find a change in urine MCP-1 after 4 months of cholecalciferol treatment (up to 40 000 IU per week) in patients with type 2 diabetic nephropathy, and Jorde et al.30 did not find a change in serum MCP-1 or other markers of inflammation after a 1 yr trial of cholecalciferol (up to 40 000 IU per week) in overweight and obese participants. The varying results may reflect differences in study population. In our study of CKD patients, serum MCP-1 was decreased from baseline at 12 wks but not at 1 yr. This could be due to the fact that the vitamin D dose was reduced by 50% after 12 weeks or that the changes in MCP-1 incurred by vitamin D are acute and may not be sustained over the long-term. Further study is required to determine if a reduction in serum MCP-1 via cholecalciferol treatment corresponds with clinical improvement in patients with early CKD.
We did not find any changes in the inflammatory cytokines, IL-6 or TNF-α after cholecalciferol supplementation. To our knowledge, these cytokines have not been previously investigated in regards to vitamin D supplementation in patients with early CKD. As studies in patients on hemodialysis have shown decreases in circulating IL-6 and TNF-α after cholecalciferol treatment31–33, it is possible that changes in serum inflammatory biomarkers would be detected in populations with more chronically elevated inflammation, such as those on hemodialysis. In vitro studies have consistently shown 1,25(OH)2D3 to downregulate the production of inflammatory cytokines in cells exposed to various conditions7,8,34. It is, therefore, also possible that the anti-inflammatory effects of vitamin D occur at the cellular level and may not be readily observed at the systemic level.
Vitamin D may play a role in the regulation of the immune system. Anti-microbial peptides such as cathelicidin are upregulated in various cell types by 1,25(OH)2D39,10. Activation of toll-like receptors (TLR) and T cells of the innate and acquired immune system by M. tuberculosis results in up-regulation of VDR and 1alpha-hydroxylase and subsequent increased conversion of 25(OH)D to 1,25(OH)2D3 in macrophages, followed by production of LL-3735,36. These anti-microbial pathways are vitamin D–dependent, as knockdown of VDR and/or 1-alpha hydroxylase inhibits induction of cathelicidin35,36. Furthermore, production of LL-37 in sera from vitamin D deficient individuals is blunted, and supplementation with 25(OH)D restores the response, suggesting that adequate circulating 25(OH)D is necessary for local production of calcitriol and subsequent upregulation of antimicrobial defenses by the immune system. Clinical intervention trials of vitamin D supplementation on infection prevention or treatment have provided both positive37–39 and null results38,40,41. In our clinical trial, we did not find a change in serum LL-37 concentrations, nor did we find changes in serum NGAL, a protein with hypothesized antimicrobial properties that may also serve as a biomarker for acute renal injury42. However, it is possible that changes would only be seen in states of acute infection or with concurrent TLR activation31, and our patient population of early CKD was too “healthy” and did not have any active infection to observe any noticeable changes. Monocytic cells exposed to P. aeruginosa in our in vitro experiment decreased MCP-1 secretion after treatment with 1,25(OH)2D3. Jeng et al.43 reported a positive association between plasma LL-37 and 25(OH)D concentrations in critically ill patients with sepsis. In patients on dialysis, the use of active vitamin D therapy was associated with lower risk of peritonitis 44 and lower infectious mortality13. In TLR-activated monocytes of relatively healthy patients, treatment with ergocalciferol significantly increased monocytic LL-37 expression45. Thus, trials of cholecalciferol in CKD patients with a concurrent infection or a longer follow-up period may be warranted to investigate effects of vitamin D on the immune system in this population.
Strengths of the study include the double-blind, randomized, placebo-controlled design and the in vitro confirmation of a vitamin D effect on MCP-1 secretion. We are the first to investigate these serum biomarkers of inflammation and immunity following long-term cholecalciferol supplementation in early stage CKD. A limitation is that the study was not originally powered for these secondary endpoints. We also did not collect specific data on incidence or prevalence of chronic inflammatory conditions or infections. Although we did not find any effects of cholecalciferol supplementation on serum IL-6, TNF-α, IP-10, NGAL, or LL-37 in this population, circulating concentrations may not reflect anti-inflammatory and immune responses to vitamin D at the local cellular level. Other circulating markers of inflammation, such as CRP, which was not measured, may have responded to cholecalciferol supplementation33. Finally, our findings may not be generalizable to a healthy population.
Conclusion
High-dose cholecalciferol supplementation reduced serum MCP-1 concentrations in patients with early CKD. Furthermore, 1,25(OH)2D3 decreased secretion of MCP-1 from LPS-stimulated monocytic cells in vitro. These data indicate a role of vitamin D and the maintenance of adequate vitamin D status in the regulation of immune-mediated processes.
Acknowledgments
Sources of support: National Institutes of Health grants K23AR054334 (VT), T32DK007298-32S1 (JAA), UL1 RR025008 (TRZ, VT) and K24 RR023356 (TRZ), Atlanta Research and Education Foundation (VT), and Emory-Egleston Children’s Research Center (SMZ)
We thank Breanne Wright, Shabnan Seydafkan, Meena Kumari, Lynn Schlanger and Peggy Jenkins for their research coordinating support, and we thank Sarthak Khare for his assistance in sample preparation. Sources of support for this study include grants from the National Institutes of Health (K23AR054334, T32DK007298-32S1, UL1 RR025008, and K24 RR023356), the Atlanta Research and Education Foundation, and the Emory-Egleston Children’s Research Center.
Footnotes
CONFLICT OF INTEREST
The authors have no conflicts of interest to declare.
References
- 1.K/DOQI clinical practice guidelines for bone metabolism and disease in chronic kidney disease. Am J Kidney Dis. 2003;42:S1–201. [PubMed] [Google Scholar]
- 2.Judd SE, Tangpricha V. Vitamin D therapy and cardiovascular health. Curr Hypertens Rep. 2011;13:187–191. doi: 10.1007/s11906-011-0190-2. [DOI] [PubMed] [Google Scholar]
- 3.Stinghen AE, Bucharles S, Riella MC, Pecoits-Filho R. Immune mechanisms involved in cardiovascular complications of chronic kidney disease. Blood Purif. 2010;29:114–120. doi: 10.1159/000245636. [DOI] [PubMed] [Google Scholar]
- 4.Sterling KA, Eftekhari P, Girndt M, Kimmel PL, Raj DS. The immunoregulatory function of vitamin D: implications in chronic kidney disease. Nat Rev Nephrol. 2012;8:403–412. doi: 10.1038/nrneph.2012.93. [DOI] [PubMed] [Google Scholar]
- 5.Sarnak MJ, Levey AS, Schoolwerth AC, Coresh J, Culleton B, Hamm LL, et al. Kidney disease as a risk factor for development of cardiovascular disease: a statement from the American Heart Association Councils on Kidney in Cardiovascular Disease, High Blood Pressure Research, Clinical Cardiology, and Epidemiology and Prevention. Hypertension. 2003;42:1050–1065. doi: 10.1161/01.HYP.0000102971.85504.7c. [DOI] [PubMed] [Google Scholar]
- 6.Wang HE, Gamboa C, Warnock DG, Muntner P. Chronic kidney disease and risk of death from infection. Am J Nephrol. 2011;34:330–336. doi: 10.1159/000330673. [DOI] [PMC free article] [PubMed] [Google Scholar]
- 7.Zhang Y, Leung DY, Richers BN, Liu Y, Remigio LK, Riches DW, et al. Vitamin D inhibits monocyte/macrophage proinflammatory cytokine production by targeting MAPK phosphatase-1. J Immunol. 2012;188:2127–2135. doi: 10.4049/jimmunol.1102412. [DOI] [PMC free article] [PubMed] [Google Scholar]
- 8.Equils O, Naiki Y, Shapiro AM, Michelsen K, Lu D, Adams J, et al. 1,25-Dihydroxyvitamin D inhibits lipopolysaccharide-induced immune activation in human endothelial cells. Clin Exp Immunol. 2006;143:58–64. doi: 10.1111/j.1365-2249.2005.02961.x. [DOI] [PMC free article] [PubMed] [Google Scholar]
- 9.Kamen DL, Tangpricha V. Vitamin D and molecular actions on the immune system: modulation of innate and autoimmunity. J Mol Med (Berl) 2010;88:441–450. doi: 10.1007/s00109-010-0590-9. [DOI] [PMC free article] [PubMed] [Google Scholar]
- 10.Wang TT, Nestel FP, Bourdeau V, Nagai Y, Wang Q, Liao J, et al. Cutting edge: 1,25-dihydroxyvitamin D3 is a direct inducer of antimicrobial peptide gene expression. J Immunol. 2004;173:2909–2912. doi: 10.4049/jimmunol.173.5.2909. [DOI] [PubMed] [Google Scholar]
- 11.Pilz S, Iodice S, Zittermann A, Grant WB, Gandini S. Vitamin D status and mortality risk in CKD: a meta-analysis of prospective studies. Am J Kidney Dis. 2011;58:374–382. doi: 10.1053/j.ajkd.2011.03.020. [DOI] [PubMed] [Google Scholar]
- 12.Drechsler C, Pilz S, Obermayer-Pietsch B, Verduijn M, Tomaschitz A, Krane V, et al. Vitamin D deficiency is associated with sudden cardiac death, combined cardiovascular events, and mortality in haemodialysis patients. Eur Heart J. 2010;31:2253–2261. doi: 10.1093/eurheartj/ehq246. [DOI] [PMC free article] [PubMed] [Google Scholar]
- 13.Naves-Díaz M, Álvarez-Hernández D, Passlick-Deetjen J, Guinsburg A, Marelli C, Rodriguez-Puyol D, et al. Oral active vitamin D is associated with improved survival in hemodialysis patients. Kidney international. 2008;74:1070–1078. doi: 10.1038/ki.2008.343. [DOI] [PubMed] [Google Scholar]
- 14.Alvarez JA, Law J, Coakley KE, Zughaier SM, Hao L, Shahid Salles K, et al. High-dose cholecalciferol reduces parathryroid hormone in patients with early chronic kidney disease: a pilot, randomized, double-blind, placebo-controlled trial. The American journal of clinical nutrition. 2012 doi: 10.3945/ajcn.112.040642. e-pub ahead of print 1 August 2012. [DOI] [PMC free article] [PubMed] [Google Scholar]
- 15.Levey AS, Coresh J, Greene T, Stevens LA, Zhang YL, Hendriksen S, et al. Using standardized serum creatinine values in the modification of diet in renal disease study equation for estimating glomerular filtration rate. Ann Intern Med. 2006;145:247–254. doi: 10.7326/0003-4819-145-4-200608150-00004. [DOI] [PubMed] [Google Scholar]
- 16.Zughaier SM, Tzeng YL, Zimmer SM, Datta A, Carlson RW, Stephens DS. Neisseria meningitidis lipooligosaccharide structure-dependent activation of the macrophage CD14/Toll- like receptor 4 pathway. Infect Immun. 2004;72:371–380. doi: 10.1128/IAI.72.1.371-380.2004. [DOI] [PMC free article] [PubMed] [Google Scholar]
- 17.Zughaier SM, Zimmer SM, Datta A, Carlson RW, Stephens DS. Differential induction of the toll-like receptor 4-MyD88-dependent and -independent signaling pathways by endotoxins. Infect Immun. 2005;73:2940–2950. doi: 10.1128/IAI.73.5.2940-2950.2005. [DOI] [PMC free article] [PubMed] [Google Scholar]
- 18.Kang YS, Cha JJ, Hyun YY, Cha DR. Novel C-C chemokine receptor 2 antagonists in metabolic disease: a review of recent developments. Expert Opin Investig Drugs. 2011;20:745–756. doi: 10.1517/13543784.2011.575359. [DOI] [PubMed] [Google Scholar]
- 19.Tesch GH. MCP-1/CCL2: a new diagnostic marker and therapeutic target for progressive renal injury in diabetic nephropathy. Am J Physiol Renal Physiol. 2008;294:F697–701. doi: 10.1152/ajprenal.00016.2008. [DOI] [PubMed] [Google Scholar]
- 20.de Lemos JA, Morrow DA, Sabatine MS, Murphy SA, Gibson CM, Antman EM, et al. Association between plasma levels of monocyte chemoattractant protein-1 and long-term clinical outcomes in patients with acute coronary syndromes. Circulation. 2003;107:690–695. doi: 10.1161/01.cir.0000049742.68848.99. [DOI] [PubMed] [Google Scholar]
- 21.Yadav A, Saini V, Arora S. MCP-1: chemoattractant with a role beyond immunity: a review. Clin Chim Acta. 2010;411:1570–1579. doi: 10.1016/j.cca.2010.07.006. [DOI] [PubMed] [Google Scholar]
- 22.Gao D, Trayhurn P, Bing C. 1,25-Dihydroxyvitamin D3 inhibits the cytokine-induced secretion of MCP-1 and reduces monocyte recruitment by human preadipocytes. Int J Obes (Lond) 2012 doi: 10.1038/ijo.2012.53. [DOI] [PMC free article] [PubMed] [Google Scholar]
- 23.Lorente-Cebrián S, Eriksson A, Dunlop T, Mejhert N, Dahlman I, Åström G, et al. Differential effects of 1α,25-dihydroxycholecalciferol on MCP-1 and adiponectin production in human white adipocytes. Eur J Nutr. 2012;51:335–342. doi: 10.1007/s00394-011-0218-z. [DOI] [PubMed] [Google Scholar]
- 24.Gruber HE, Hoelscher G, Ingram JA, Chow Y, Loeffler B, Hanley EN., Jr 1,25(OH)2-vitamin D3 inhibits proliferation and decreases production of monocyte chemoattractant protein-1, thrombopoietin, VEGF, and angiogenin by human annulus cells in vitro. Spine (Phila Pa 1976) 2008;33:755–765. doi: 10.1097/BRS.0b013e3181695d59. [DOI] [PubMed] [Google Scholar]
- 25.Zhang Z, Yuan W, Sun L, Szeto FL, Wong KE, Li X, et al. 1,25-Dihydroxyvitamin D3 targeting of NF-κB suppresses high glucose-induced MCP-1 expression in mesangial cells. Kidney international. 2007;72:193–201. doi: 10.1038/sj.ki.5002296. [DOI] [PubMed] [Google Scholar]
- 26.Zhu KJ, Shen QY, Zheng M, Mrowietz U. Effects of calcitriol and its analogues on interaction of MCP-1 and monocyte derived dendritic cells in vitro. Acta Pharmacol Sin. 2001;22:62–65. [PubMed] [Google Scholar]
- 27.Krüger S, Kreft B. 1,25-dihydroxyvitamin D3 differentially regulates IL-1α-stimulated IL-8 and MCP-1 mRNA expression and chemokine secretion by human primary proximal tubular epithelial cells. Exp Nephrol. 2001;9:223–228. doi: 10.1159/000052615. [DOI] [PubMed] [Google Scholar]
- 28.Bischoff-Ferrari HA, Dawson-Hughes B, Stöcklin E, Sidelnikov E, Willett WC, Orav EJ, et al. Oral supplementation with 25(OH)D3 versus vitamin D3 : effects on 25(OH)D levels, lower extremity function, blood pressure and markers of innate immunity. J Bone Miner Res. 2011 doi: 10.1002/jbmr.551. [DOI] [PubMed] [Google Scholar]
- 29.Kim MJ, Frankel AH, Donaldson M, Darch SJ, Pusey CD, Hill PD, et al. Oral cholecalciferol decreases albuminuria and urinary TGF-β1 in patients with type 2 diabetic nephropathy on established renin-angiotensin-aldosterone system inhibition. Kidney international. 2011;80:851–860. doi: 10.1038/ki.2011.224. [DOI] [PubMed] [Google Scholar]
- 30.Jorde R, Sneve M, Torjesen PA, Figenschau Y, Gøransson LG, Omdal R. No effect of supplementation with cholecalciferol on cytokines and markers of inflammation in overweight and obese subjects. Cytokine. 2010;50:175–180. doi: 10.1016/j.cyto.2009.12.006. [DOI] [PubMed] [Google Scholar]
- 31.Stubbs JR, Idiculla A, Slusser J, Menard R, Quarles LD. Cholecalciferol supplementation alters calcitriol-responsive monocyte proteins and decreases inflammatory cytokines in ESRD. J Am Soc Nephrol. 2010;21:353–361. doi: 10.1681/ASN.2009040451. [DOI] [PMC free article] [PubMed] [Google Scholar]
- 32.Bucharles S, Barberato SH, Stinghen AE, Gruber B, Piekala L, Dambiski AC, et al. Impact of cholecalciferol treatment on biomarkers of inflammation and myocardial structure in hemodialysis patients without hyperparathyroidism. J Ren Nutr. 2012;22:284–291. doi: 10.1053/j.jrn.2011.07.001. [DOI] [PubMed] [Google Scholar]
- 33.Matias PJ, Jorge C, Ferreira C, Borges M, Aires I, Amaral T, et al. Cholecalciferol supplementation in hemodialysis patients: effects on mineral metabolism, inflammation, and cardiac dimension parameters. Clin J Am Soc Nephrol. 2010;5:905–911. doi: 10.2215/CJN.06510909. [DOI] [PMC free article] [PubMed] [Google Scholar]
- 34.McNally P, Coughlan C, Bergsson G, Doyle M, Taggart C, Adorini L, et al. Vitamin D receptor agonists inhibit pro-inflammatory cytokine production from the respiratory epithelium in cystic fibrosis. J Cyst Fibros. 2011;10:428–434. doi: 10.1016/j.jcf.2011.06.013. [DOI] [PubMed] [Google Scholar]
- 35.Fabri M, Stenger S, Shin DM, Yuk JM, Liu PT, Realegeno S, et al. Vitamin D is required for IFN-γ-mediated antimicrobial activity of human macrophages. Sci Transl Med. 2011;3:104ra102. doi: 10.1126/scitranslmed.3003045. [DOI] [PMC free article] [PubMed] [Google Scholar]
- 36.Liu PT, Stenger S, Li H, Wenzel L, Tan BH, Krutzik SR, et al. Toll-like receptor triggering of a vitamin D-mediated human antimicrobial response. Science. 2006;311:1770–1773. doi: 10.1126/science.1123933. [DOI] [PubMed] [Google Scholar]
- 37.Coussens AK, Wilkinson RJ, Hanifa Y, Nikolayevskyy V, Elkington PT, Islam K, et al. Vitamin D accelerates resolution of inflammatory responses during tuberculosis treatment. Proc Natl Acad Sci U S A. 2012;109:15449–15454. doi: 10.1073/pnas.1200072109. [DOI] [PMC free article] [PubMed] [Google Scholar]
- 38.Martineau AR, Timms PM, Bothamley GH, Hanifa Y, Islam K, Claxton AP, et al. High-dose vitamin D3 during intensive-phase antimicrobial treatment of pulmonary tuberculosis: a double-blind randomised controlled trial. Lancet. 2011;377:242–250. doi: 10.1016/S0140-6736(10)61889-2. [DOI] [PMC free article] [PubMed] [Google Scholar]
- 39.Urashima M, Segawa T, Okazaki M, Kurihara M, Wada Y, Ida H. Randomized trial of vitamin D supplementation to prevent seasonal influenza A in schoolchildren. Am J Clin Nutr. 2010;91 :1255–1260. doi: 10.3945/ajcn.2009.29094. [DOI] [PubMed] [Google Scholar]
- 40.Yamshchikov AV, Desai NS, Blumberg HM, Ziegler TR, Tangpricha V. Vitamin D for treatment and prevention of infectious diseases: a systematic review of randomized controlled trials. Endocr Pract. 2009;15:438–449. doi: 10.4158/EP09101.ORR. [DOI] [PMC free article] [PubMed] [Google Scholar]
- 41.Murdoch DR, Slow S, Chambers ST, Jennings LC, Stewart AW, Priest PC, et al. Effect of vitamin D3 supplementation on upper respiratory tract infections in healthy adults: the VIDARIS randomized controlled trial. JAMA. 2012;308:1333–1339. doi: 10.1001/jama.2012.12505. [DOI] [PubMed] [Google Scholar]
- 42.Soni SS, Cruz D, Bobek I, Chionh CY, Nalesso F, Lentini P, et al. NGAL: a biomarker of acute kidney injury and other systemic conditions. Int Urol Nephrol. 2010;42:141–150. doi: 10.1007/s11255-009-9608-z. [DOI] [PubMed] [Google Scholar]
- 43.Jeng L, Yamshchikov AV, Judd SE, Blumberg HM, Martin GS, Ziegler TR, et al. Alterations in vitamin D status and anti-microbial peptide levels in patients in the intensive care unit with sepsis. J Transl Med. 2009;7:28. doi: 10.1186/1479-5876-7-28. [DOI] [PMC free article] [PubMed] [Google Scholar]
- 44.Rudnicki M, Kerschbaum J, Hausdorfer J, Mayer G, König P. Risk factors for peritoneal dialysis-associated peritonitis: the role of oral active vitamin D. Perit Dial Int. 2010;30:541–548. doi: 10.3747/pdi.2009.00108. [DOI] [PubMed] [Google Scholar]
- 45.Adams JS, Ren S, Liu PT, Chun RF, Lagishetty V, Gombart AF, et al. Vitamin D-directed rheostatic regulation of monocyte antibacterial responses. J Immunol. 2009;182:4289–4295. doi: 10.4049/jimmunol.0803736. [DOI] [PMC free article] [PubMed] [Google Scholar]