Abstract
Experiments were performed to evaluate the energy-discriminative performance of a spectral (multi-energy) micro-CT system. The system, designed by MARS (Medipix All Resolution System) Bio-Imaging Ltd. (Christchurch, New Zealand), employs a photon-counting energy-discriminative detector technology developed by CERN (European Organization for Nuclear Research). We used the K-edge attenuation characteristic of some known materials to calibrate the detector’s photon energy discrimination. For tomographic analysis, we used the compressed sensing (CS) based ordered-subset simultaneous algebraic reconstruction techniques (OS-SART) to reconstruct sample images, which is effective to reduce noise and suppress artifacts. Unlike conventional CT, the principal component analysis (PCA) method can be applied to extract and quantify additional attenuation information from a spectral CT dataset. Our results show that the spectral CT has a good energy-discriminative performance and provides more attenuation information than the conventional CT.
Keywords: Energy-discriminative performance, Spectral CT, K-edge imaging, Compressive sensing, Iterative reconstruction, Principal component analysis
1. Introduction
Since Hounsfield’s Nobel Prize winning breakthrough, x-ray computed tomography (CT) has been widely applied in clinical and preclinical applications. In the past few years a huge amount of micro-CT or nano-CT scans have been done in research institutions worldwide to generate high-resolution images which provide detailed interior structure. However, a primary problem with conventional x-ray CT is that image contrast is often insufficient to distinguish diagnostically crucial shading (attenuation) differences, due to inherent quantum noise and similar attenuation properties. A typical conventional CT system employs a polychromatic source and a current-integrating sensor whose output is proportional to the energy fluence over the entire x-ray spectrum. Physically, the x-ray spectrum contains much more information, and the conventional CT system collects all the photons ignoring spectral information.
It would be invaluable if x-ray CT is enhanced with energy resolution for material decomposition, being complementary to MRI, PET and SPECT. Fortunately, with the development of x-ray detector techniques, spectral CT is made feasible to improve imaging performance. The earliest attempt to utilize spectral attenuation information is dual-energy CT, which performs two spectrally distinct scans (1). Over the past years, spectral (multi-energy) CT has attracted a major attention, which characterizes structural features in multiplex-ray energy bins (2–5). Previously, high-resolution spectral x-ray imaging was only possible with synchrotron radiation facilities which provide sharp energy selectivity and high beam brightness (6–9). Recently, spectral CT of current interest employs a regular x-ray tube instead, thanks to the energy discriminating detector that differentiates among material attenuation spectra (10–12). This technique fully utilizes the polychromatic spectrum of an x-ray source and opens a door for functional, cellular and molecular imaging.
In this paper, we studied a MARS (Medipix All Resolution System) spectral micro-CT system. The system is based on the state-of-the-art detector chip, exclusively licensed from CERN (Switzerland), and the technology developed by the University of Canterbury (New Zealand). It employs a broad spectral x-ray source used in conventional CT, and its detector (Medipix2) is a photon counting system with selectable threshold. Compared to other spectral x-ray detectors, the Medipix technology defines the finest spatial resolution and fastest imaging speed. It is possible to use this system as a spectroscopic device because it is sensitive to the energy of the incoming photons (12–14). We reported some experimental results to demonstrate the advantages of the spectral CT. First we will analyze the Medipix2 silicon detector, and performed energy calibration of the detector according to some known material K-edge characteristics. Then, we will study material K-edge imaging and test a rubber tube corrupted by iodine solution at different energy ranges. Following this, we also will perform tomographic analysis in which we will design and scan a multi-material physics phantom at different energy ranges. To reconstruct the sample images, we will make use of a compressed sensing (CS) based iterative reconstruction algorithm: the total variation (TV) minimization based ordered-subset simultaneous algebraic reconstruction techniques (OS-SART) (15–19), which is very effective to reduce noises and suppress artifacts. To evaluate the reconstructed spectral images, we will apply the principal component analysis (PCA) technology, which is effective at identifying linearly independent patterns of variance within spectral dataset (20–23). Finally, the energy-discriminative performance of the spectral CT system will be demonstrated from the results of detector energy calibration and spectral data evaluation. The spectral CT has a good energy-discriminative performance and provides more attenuation information than the conventional CT. The spectral CT is a natural, novel and important technique. It could be a powerful tool for preclinical applications, even enabling unforeseen applications.
The rest of this paper is organized as follow: In the second section, we will introduce the characteristics of research materials and methods. In the third section, we will present our experimental results on detector energy calibration and spectral data evaluation. In the last section, we will discuss the related issues and conclude the paper.
2. Materials and Methods
The MARS spectral CT system employs a polychromatic x-ray source and an energy-discriminative detector. To analyze the energy-discriminative performance of the MARS system, we tested the K-edge characteristics of some known materials to perform energy calibration for Medipix2 silicon detector. Subsequently, we also used the spectral CT system to scan physical phantoms in various energy ranges, and applied the PCA method to evaluate these spectral datasets (sample projections and reconstructed slice images). Our goal was to evaluate the energy-discriminative performance of the spectral CT system and investigate the differences between it and conventional CT system.
2.1 Detector Energy Calibration
The MARS spectral micro-CT detector is a photon-counting system with selectable energy thresholds (i.e. selective energy window/range). During initial calibration, each individual detector cell has a unique threshold equalization mask applied to adjust each pixel’s energy threshold response to be homogeneous. For a selected energy threshold value, the detector counts photons whose energy is above that value. Thus, it is necessary to calibrate each detector’s threshold values to a known incident photon energy to determine the relationship between photon energy and threshold value. In addition to calibrating the detector’s energy-discriminative thresholds, we also wish to evaluate the energy-discriminative performance of the MARS system.
We tested the K-edge characteristics of elemental Zirconium (Zr), Molybdenum (Mo) and Palladium (Pd) foils of varying thickness (Fig. 1(a)) using the Medipix2 silicon detector to determine the relationship between photon energies and the selectable thresholds. The active area of the Medipix2 silicon detector is 14×14 mm, comprising 256×256 pixels with each pixel covering an area of 55×55μm. We set the selected threshold value from 450 to 599 to capture transverse projection images of these elemental foils. The scan parameters are listed in Table 1, and an example of these material projections at a selected threshold is shown in Fig. 1(b). To reduce the inherent quantum noise, we captured 20 projections and calculated their average at each threshold. We chose steady-performance regions (i.e. free from defects) in the detector array where projections have less noise (yellow regions in Fig. 1(b)), and calculated the average photon counts captured by one detector unit (pixel) in these steady-performance regions at each threshold value. We also captured flat-field projections at the corresponding thresholds, and calculated the total photon counts in the identical projection region. The integrated attenuation coefficient at a selected energy level is described as:
| (1) |
where μ is the integrated attenuation coefficient and it is a product of the material attenuation coefficient and the material thickness, IL and IH are the captured photon numbers of the detector using a low and high energy thresholds after passing through the imaging object, respectively. For a given energy threshold, the detector could account the photons whose energy is above the energy threshold. IL0 and IH0 are the corresponding values without the imaging object. Finally, we calculated the attenuation-versus-energy curves of these materials using Eq. (1), and determined the K-edges of these materials. It should be pointed out that it does not affect the detector calibration result if we treat μ as the material attenuation coefficeint. In our analysis, IL – IH is considered as the captured photon numbers in an energy bin which covers six energy thresholds. Therefore, we can obtain 145 integrated attenuation coefficients from 150 projections.
Fig. 1.

Test materials for detector calibration. (a) Photograph of the test materials and (b) a representative projection at a given energy threshold 550.
Table 1.
Summary of scan parameters for K-edge calibration
| X-ray source voltage (kVp) | X-ray source current (μA) | Exposure time (ms) | Energy Threshold Values | Energy Threshold Value Step |
|---|---|---|---|---|
| 40 | 400 | 6000 | 450–599 | 1 |
2.2 Projection Analysis
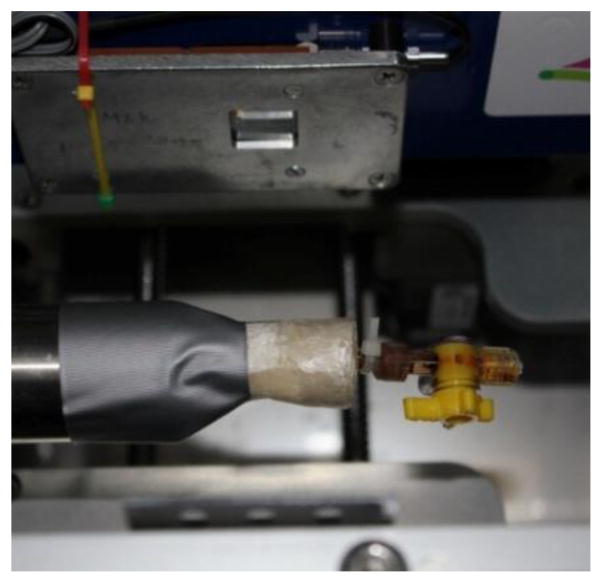
To analyze energy-discriminative performance of the spectral CT, we tested common x-ray contrast elements (e.g. iodine and barium). A rubber tube was filled with iodine solution and scanned for analysis (see Fig. 2). The rubber tube was chosen because it can be saturated by the iodine solution, giving a relatively complex concentration gradient after saturation. The rubber tube in the experiment contains a part saturated by iodine, a part unsaturated by iodine and a part with the solid iodine adhering to interior surface. The energy threshold value was set from 8 to 38 keV, with a step of 2 keV, to capture 16 projections (see Table 2). The relationship between the photon energy and the selectable threshold value can be determined from these measured projections.
Fig. 2.
A photograph of the rubber tube saturated by iodine solution.
Table 2.
Summary of scan parameters for the rubber tube rotted by iodine solution.
| X-ray source voltage (kVp) | X-ray source current (μA) | Exposure time (ms) | Energy threshold range (keV) | Energy threshold step (keV) |
|---|---|---|---|---|
| 50 | 150 | 5000 | 8~38 | 2 |
2.3 Tomographic Analysis
The spectral CT system has a typical cone-beam geometry. To obtain accurate reconstruction results using the iterative algorithm, we needed to accurately measure the geometrical parameters, such as the detector to rotation axis distance and x-ray source to rotation axis distance. In geometrical alignment, a pin was used to calculate the distance from the x-ray source to the system origin and the distance from the system origin to the detector from various projections (23) (the maximum distance from the x-ray source to the system origin is 114.4 mm and the maximum distance from the system origin to the detector is 92.4 mm approximately).
2.3.1 Scan Samples
For the tomographic analysis, we studied a multi-material phantom. The physical phantom (Fig. 3(a)) is a 3.0 cm diameter Acrylic cylinder with interior vessels composed of bone-equivalent plastic, soft-tissue-equivalent plastic (Polymethyl Methacrylate, PMMA). We scanned it at a given energy threshold (15 keV) using the Medipix2 silicon detector, and found the reconstruction image (Fig. 3(b)) has poor tissue contrast. Then we redesigned the phantom (Fig. 3(c)) and employed iodine and barium contrast agents as the substitute for some soft-tissue-equivalent plastics. The iodine solution inside the phantom is contained by a plastic tube whose concentration is about 1.5%. Because the barium sulfate couldn’t dissolve in water, the barium sulfate inside the phantom is mixed into paraffin wax whose proportion is 1:4. We scanned the physical phantom at six energy thresholds (15, 20, 25, 30, 35 and 40 keV) using the Medipix2 silicon detector.
Fig. 3.
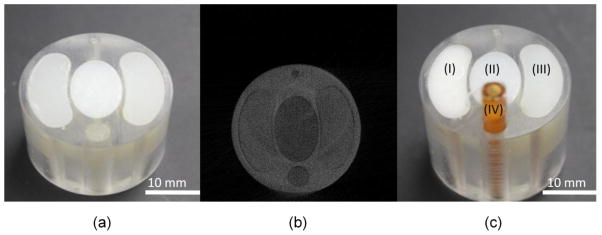
The physical phantoms. (a) Photograph of the original physical phantom, (b) one reconstructed image slice of (a) at a given energy threshold 15 keV, and (c) photograph of the redesigned physical phantom including (I) barium sulfate mixed into paraffin, (II) soft-tissue-equivalent plastic, (III) bone -equivalent plastic and (IV) iodine solution.
2.3.2 Reconstruction Algorithm
Iterative reconstruction is an important algorithm that has been widely used for computed tomography. SART is a representative iterative algorithm, and the OS scheme is an effective method to accelerate the iterative reconstruction algorithm. The OS version of SART (OS-SART) is an accelerated iterative reconstruction algorithm. The convergence of the OS-SART algorithm has been demonstrated and well accepted in the CT field (17, 18). It is worth noting that OS-SART uses index subsets in different orders to accelerate the convergence speed. In recent years, CS-based iterative reconstruction algorithms have been developed, which can reconstruct high-quality images from less projection data than what is usually considered necessary according to the Nyquist sampling theory. In the CS theory, an image can be reconstructed from a rather limited amount of data as long as an underlying image can be sparsely represented in an appropriate domain and determined from these data. Meanwhile, the CS-based iterative algorithm is very effective to deal with image artifact and noise. Because the structure and components of the sample are simple and the signal to noise ratio (SNR) of the sample projection isn’t high, we combine the OS-SART and CS to reconstruct the sample images. In our application, the discrete gradient transform (DGT) was chosen to serve as the sparsifying transform, and the final images were reconstructed by minimizing the total variation (TV) (19).
2.4 Spectral Data Evaluation
Evaluation of the spectral component of the data is vital for determining energy-discriminative performance of spectral CT. At present, principal components analysis (PCA) is an effective method to evaluate spectral information. It is a linear transformation of the multi-energy dataset into new components which can alternatively represent the data. PCA can compress the data without significant loss of information, which often improves the contrast resolution and signal-to-noise ratio compared to the original images. A singular value decomposition (SVD) method can be used to calculate the largest eigenvalues, and the corresponding eigenvectors will be the principal components of the spectral datasets (20–23). In the spectral dataset analysis, the PCA method can be applied to extract the first three eigen-images from the images reconstructed with different energy thresholds. This can help reduce noise and suppress artifacts in the fused true-color images.
3. Results
3.1 Detector Energy Calibration Results
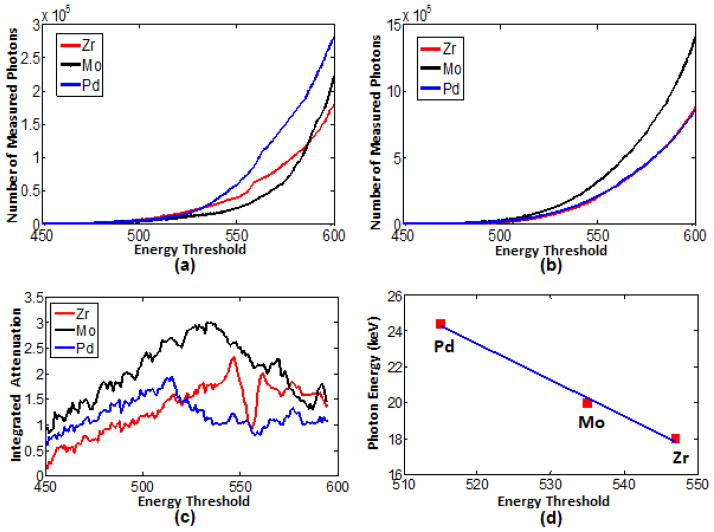
To calibrate the Medipix2 silicon detector, Zirconium, Molybdenum and Palladium foils were scanned to capture 150 projections of successive energy threshold values. We calculated the total photon counts of the homogenous regions where projections have less noise (yellow regions in Fig. 1(b)), and plotted photon counts and energy threshold curves (Fig. 4(a)). We also captured flat-field projections for the same energy thresholds, calculated the total photon counts of the corresponding regions, and plotted photon counts and energy threshold curves (Fig. 4(b)). According to Eq. (1), we set the width between a low and high thresholds as 6 step values (equivalent to energy bin), and obtained the integrated attenuation-versus-energy curves for the elemental foils (Fig. 4(c)).
Fig. 4.
Detector calibration results. (a) Photon count and energy threshold plots of test materials; (b) photon count and energy threshold plots for flat-field projections; (c) attenuation-versus-energy bin plots of the test materials; and (d) linear regression fitted line for the energy calibration of the detector threshold.
Due to the inhomogeniety of the flat-field images, there are slight differences among the three plots in Fig. 4(b). From Fig. 4(c), it is noticed that the measured attenuation-versus-energy bin plots do not display the sudden attenuation increase at the K-edge, which deviates from reference attenuation-versus-energy data (the x-ray attenuation databases reported by NIST (http://www.nist.gov/pml/data/xraycoef/index.cfm)). This is due to the averaging effect of the energy binning protocol, noises in the projections, Compton scattering, charge sharing, pulse pileup effects (24,25), etc. The peak of attenuation-versus-energy bin curve can be considered approximated as the material K-edge, and we can determine the relationship between the K-edges of test materials and detector energy threshold values. In Table 3, we listed the estimated selectable threshold values corresponding to the K-edges of the tested materials. Because the relationship between the photon energy and the threshold value is a linear function [13,26,27], it can be approximated by a linear regression from the data in Table 3: E = −0.20 × T + 128.35, where E is photon energy and T is energy threshold (Fig. 4(d)). By analyzing three materials’ K-edge characteristcs, the experimental results demonstrate that the detector threshold value and photon energy have a linear relationship approximately. After the calibration for the detector of our spectral CT system (the Medipix2 silicon detector), we analyzed the energy resolution characteristics and found that the detector has energy-discriminative capacity within photon energy 0~40 keV. Thus, the spectral CT system not only has good energy-discriminative performance, but could identify some materials’ K-edge characteristics.
Table 3.
Relationship between the K-edge of test materials and energy threshold
| Material | K-edge (keV) | Energy threshold |
|---|---|---|
| Zirconium | 18.0 | 547 |
| Molybdenum | 20.0 | 535 |
| Palladium | 24.4 | 515 |
In the following sections, we will study how to evaluate the spectral data to demonstrate the advantages of spectral CT.
3.2 Physical Phantom Analysis
To evaluate projections of the spectral CT, we scanned a rubber tube saturated by iodine solution with selectable threshold values ranging from 8 to 38 keV, and captured 16 projections at 16 thresholds. Representative projections at thresholds of 8, 28 and 38 keV were shown in Fig. 5(a)–5(c). PCA method was applied to extract the relevant information from these projections at 16 energy levels. Three eigen-images corresponding to the first three maximum eigenvalues were shown in Fig. 5(d)–5(f), which were linearly mapped into the RGB space to generate the true-color image in Fig. 5(g). From Fig. 5(g), we can distinguish the rubber tube saturated by iodine, the part unsaturated by iodine and the solid iodine adhering to interior surface of the rubber tube. Because the projections captured by the conventional CT are same as the ones captured by the spectral CT at a selected threshold, we couldn’t distinguish the interior structure of the rubber tube. However, the fused image (Fig. 5(g)) from projections at different selectable thresholds demonstrate that the spectral CT can provide much richer information than the conventional CT.
Fig. 5.
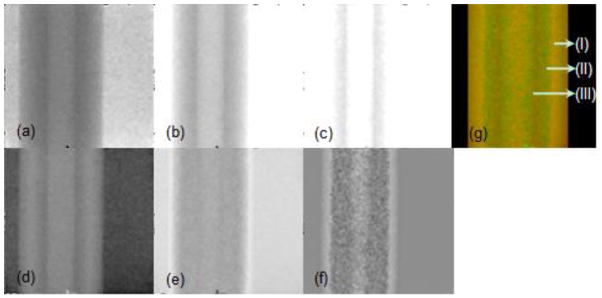
Projection evaluation result of the rubber tube saturated by iodine solution. Images (a)–(c) are projections from thresholds of 8, 28 and 38 keV, respectively. Images (d)–(f) are the eigen-images extracted from 16 projections with respect to the first three maximum eigenvalues. Image (g) is the final mapping from the eigen-images (d)–(f), where (I) is the part unsaturated by iodine, (II) is the part saturated by iodine, and (III) is the solid iodine adhering to interior surface of the rubber tube.
The aforementioned multi-material phantom was scanned at six energy thresholds (15, 20, 25, 30, 35 and 40 keV) according to the energy calibration results, and reconstructed by the CS-based OS-SART method. In our experiments, we didn’t use six adjacent energy bins to perform reconstruction. The reason is that the narrower the energy bin is set, the fewer photons are detected in one energy bin. This will result in more noises in the reconstruction images. Fig. 6 presents the reconstructed images of the central slice for six energy thresholds. PCA was used to evaluate these spectral images to extract the first three maximum eigen-images, which were linearly mapped into the RGB space to generate a true-color image (Fig. 6(g)). From Fig. 6(g), we can see that different material regions not only have different colors, but also have the gray value differences which are displayed in third dimension (the high gray value regions are protuberant, and the low gray value regions are sunken). Fig. 6(g) is considered a true-color image, in contrast to pseudo-color, because the relevant information was extracted from the reconstructed images at six energy levels. Pseudo-color images display different colors using postprocessing, which was independent of the energy of the transmitted x-ray beam. For the conventional CT, the reconstructed image is same as the spectral CT image at one selected threshold, which loses lots of attenuation information. To capture more attenuation information, we could fuse the spectral CT images at different selected thresholds to distinguish the composition characteristic that is lost by the conventional CT.
Fig. 6.
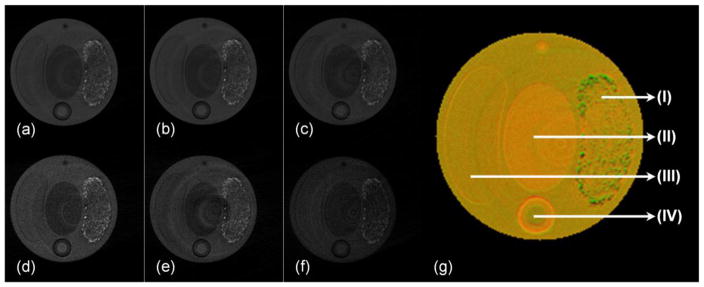
Spectral analysis results of the central slice of the physical phantom. Reconstructed images (a)–(f) are in a display window [0,0.016] with respect to the energy thresholds 15, 20, 25, 30, 35 and 40 keV, respectively. (g) is the true-color image mapped from the first three eigen-images, where (I) is the barium sulfate mixed into paraffin, (II) is soft-tissue-equivalent plastic, (III) is bone-equivalent plastic, and (IV) is iodine solution.
4. Discussion and Conclusion
In this paper, we evaluated the energy-discriminative performance of a spectral CT system and demonstrated that spectral CT can provide more information than conventional CT. We calibrated the energy response for the Medipix2 silicon detector and identified some material K-edge characteristics, which cannot be done with conventional CT. We also analyzed a rubber tube with iodine solution and a multi-material physics phantom in different energy bins. More information can be visually noticed in the fused spectral image, which cannot be seen with the conventional CT.
In our analysis for energy-discriminative performance of the spectral CT, it is indispensable to take into account noise factor at every experiment stage. In the detector energy calibration stage, to obtain more accurate calibration results, some measures were taken to restrain or reduce noises. First, flat-field projections were captured and analyzed to determine the steady regions in the detector array. When the test material projections were captured, the test samples were positioned to cover the homogeneous regions in the detector array. Meanwhile, the exposure time was increased as much as possible, and 20 projections were captured for a single energy bin to obtain an averaged projection. Before the average attenuation coefficient of the test materials were calculated in the homogeneous regions, dead pixels and inhomogeneous pixels were removed from the homogeneous regions.
In the image reconstruction stage, first the sinograms of a sample slice were analyzed, which showed that often there are some vertical lines in sinograms owing to some defective/bad pixels in the detector array. To reduce vertical lines in sinograms, a frequency filter method was employed (28). In the image reconstruction study, a CS-enabled OS-SART algorithm was employed, which is more effective to reduce noise and suppress artifacts than the conventional filtered backprojection (FBP) algorithm. In the spectral data evaluation stage, the PCA method was applied to compress the spectral data without significant loss of information, which often improves the contrast resolution and signal-to-noise ratio compared to the original images. The PCA method can extract the first three eigen-images corresponding to the first three maximum eigenvalues. These eigen-images could be mapped into the color space to render a true-color image, and the noises and artifacts are usually contained in other eigen-images corresponding to smaller eigenvalues.
In conclusion, the spectral CT system has a good energy-discriminative performance which identified the K-edge characteristics of various test materials. From the spectral data evaluation results, we demonstrated the differences between the spectral CT and conventional CT and found the spectral CT could provide more information than the conventional CT. The spectral CT has a great potential for preclinical and clinical applications including, but not limited, to tissue characterization and contrast studies.
Acknowledgments
This work was partially supported by the NIH/NIBIB grant EB011785, the Ministry of Science and Innovation (New Zealand), and a seed grant from Wake Forest Institute for Regenerative Medicine. The funders had no role in study design, data collection and analysis, decision to publish, or preparation of the manuscript.
References
- 1.Alvarez RE, Macovski A. Energy-selective reconstructions in x-ray computerized tomography. Physics in Medicine and Biology. 1976;21(5):733–744. doi: 10.1088/0031-9155/21/5/002. [DOI] [PubMed] [Google Scholar]
- 2.Riederer SJ, Mistretta CA. Selective iodine imaging using K-edge energies in computerized x-ray tomography. Physics in Medicine and Biology. 1977;4(6):474–481. doi: 10.1118/1.594357. [DOI] [PubMed] [Google Scholar]
- 3.Schlomka JP, Roessl E, Dorscheid R, Dill S, Martens G, Istel T, Bäumer C, Herrmann C, Steadman R, Zeitler G, Livne A, Proksa R. Experimental feasibility of multi-energy photon-counting K-edge imaging in pre-clinical computed tomography. Physics in Medicine and Biology. 2008;53(15):4031–4047. doi: 10.1088/0031-9155/53/15/002. [DOI] [PubMed] [Google Scholar]
- 4.Giersch J, Firsching M, Niederlohner D, Anton G. Material reconstruction with spectroscopic pixel X-ray detectors. Nuclear Instruments and Methods in Physics Research Section A. 2005;546(1–2):125–130. [Google Scholar]
- 5.Firsching M, Butler AP, Scott N, Anderson NG, Michel T, Anton G. Contrast agent recognition in small animal CT using the Medipix2 detector. Nuclear Instruments and Methods in Physics Research Section A. 2009;607(1):179–192. [Google Scholar]
- 6.Baumer C, Martens G, Menser B, Roessl E, Schlomka JP, Steadman R, Zeitler G. Testing an energy-dispersive counting-mode detector with hard x-rays from a synchrotron source. IEEE Transactions on Nuclear Science. 2008;55(3):1785–1790. [Google Scholar]
- 7.Kinney JH, Nichols MC. X-ray tomographic microscopy (XTM) using synchrotron radiation. Annual Review of Materials Science. 1992;22:121–152. [Google Scholar]
- 8.Schultke E, Fiedler S, Nemoz C, Ogieglo L, Kelly ME, Crawford P, Esteve F, Brochard T, Renier M, Requardt H, Duc GL, Juurlink B, Meguro K. Synchrotron-based intra-venous K-edge digital subtraction angiography in a pig model: A feasibility study. European Journal of Radiology. 2010;73(3):677–681. doi: 10.1016/j.ejrad.2009.01.019. [DOI] [PubMed] [Google Scholar]
- 9.Rao DV, Cesareo R, Brunetti A, Akatsuka T, Yuasa T, Takeda T, Gigante GE. Embedded soft-tissue image mechanism of a small animal shell with synchrotron-based micro-CT. Journal of X-Ray Science and Technology. 2012;20:291–299. doi: 10.3233/XST-2012-0338. [DOI] [PubMed] [Google Scholar]
- 10.Wang X, Meier D, Mikkelsen S, Maehlum GE, Wagenaar DJ, Tsui BMW, Patt BE, Frey EC. MicroCT with energy-resolved photon-counting Detectors. Physics in Medicine and Biology. 2011;56(9):2791–2816. doi: 10.1088/0031-9155/56/9/011. [DOI] [PMC free article] [PubMed] [Google Scholar]
- 11.Roessl E, Proksa R. K-edge imaging in x-ray computed tomography using multi-bin photon counting detectors. Physics in Medicine and Biology. 2007;52(15):4679–4696. doi: 10.1088/0031-9155/52/15/020. [DOI] [PubMed] [Google Scholar]
- 12.Firsching M, Talla PT, Michel T, Anton G. Material resolving X-ray imaging using spectrum reconstruction with Medipix2. Nuclear Instruments and Methods in Physics Research A. 2008;591(1):19–23. [Google Scholar]
- 13.Llopart X, Campbell M, Segundo DS, Pernigotti E, Dinapoli R. Medipix2: a 64-k pixel readout chip with 55-μm square elements working in single photon counting mode. IEEE Transactions on Nuclear Science. 2002;49(5):2279–2283. [Google Scholar]
- 14.Manuilskiy A, Norlin B, Nilsson HE, Frojdh C. Spectroscopy applications for the Medipix photon counting X-ray system. Nuclear Instruments and Methods in Physics Research A. 2004;531(1–2):251–257. [Google Scholar]
- 15.Andersen AH, Kak AC. Simultaneous Algebraic Reconstruction Technique (SART): a superior implementation of the ART algorithm. Ultrasonic Imaging. 1984;6(1):81–94. doi: 10.1177/016173468400600107. [DOI] [PubMed] [Google Scholar]
- 16.Donoho DL. Compressed sensing. IEEE Transactions on Information Theory. 2006;52(4):1289–1306. [Google Scholar]
- 17.Wang G, Jiang M. Ordered-Subset Simultaneous Algebraic Reconstruction Techniques (OS-SART) Journal of X-ray Science and Technology. 2004;12(3):169–177. [Google Scholar]
- 18.Jiang M, Wang G. Convergence studies on iterative algorithms for image reconstruction. IEEE Transaction on Medical Imaging. 2003;22(5):569–579. doi: 10.1109/TMI.2003.812253. [DOI] [PubMed] [Google Scholar]
- 19.Yu H, Wang G. Compressed sensing based Interior tomography. Physics in Medicine and Biology. 2009;54(9):2791–2805. doi: 10.1088/0031-9155/54/9/014. [DOI] [PMC free article] [PubMed] [Google Scholar]
- 20.Jolliffe IT. Principal Components Analysis. 2. Springer-Verlag; 2002. [Google Scholar]
- 21.Kalukin AR, Van Geet M, Swennen R. Principal components analysis of multienergy x-ray computed tomography of mineral samples. IEEE Transaction on Nuclear Science. 2000;47(5):1729–1736. [Google Scholar]
- 22.Butler AP, Butzer J, Schleich N, Cook NJ, Anderson NG, Scott N, Ruiter N, Grasset R, Tlustos L, Butler PH. Processing of spectral X-ray data with principal components analysis. Nuclear Instruments and Methods in Physics Research A. 2011;633(1):140–142. [Google Scholar]
- 23.He P, Yu H, Thayer P, Jin X, Xu Q, Bennett J, Tappenden R, Wei B, Goldstein A, Renaud P, Butler A, Butler P, Wang G. Preliminary Experimental Results from a MARS Micro-CT System. Journal of X-ray Science and Technology. 2012;20:199–211. doi: 10.3233/XST-2012-0329. [DOI] [PMC free article] [PubMed] [Google Scholar]
- 24.Wang AS, Pelc NJ. Sufficient Statistics as a Generalization of Binning in Spectral X-ray Imaging. IEEE Transaction on Medical Imaging. 2011;30(1):84–93. doi: 10.1109/TMI.2010.2061862. [DOI] [PubMed] [Google Scholar]
- 25.Taguchi K, Frey EC, Wang X. An analytical model of the effects of pulse pileup on the energy spectrum recorded by energy resolved photon counting x-ray detectors. Medical Physics. 2010;37(8):3957–3969. doi: 10.1118/1.3429056. [DOI] [PMC free article] [PubMed] [Google Scholar]
- 26.Ponchut C, Zontone F. Evaluation of medipix-1 in X-ray scattering and X-ray diffraction applications. Nuclear Instruments and Methods in Physics Research A. 2003;510(1–2):29–34. [Google Scholar]
- 27.Fiederle M, Greiffenberg D, Idarraga J, Jakubek J, Kral V, Lebel C, Leroy C, Lord G, Pospisil S, Sochor V, Suk M. Energy calibration measurements of MediPix2. Nuclear Instruments and Methods in Physics Research A. 2008;591(1):75–79. [Google Scholar]
- 28.Raven C. Numerical removal of ring artifacts in microtomography. Review of Scientific Instruments. 1998;69(8):2978–2980. [Google Scholar]


