Abstract
Zinc (Zn) homeostasis is required for a functional immune system. Critically ill patients often exhibit decreased Zn serum concentrations and could potentially benefit from Zn supplementation as a therapeutic strategy. However, the conventional approaches to monitoring Zn are time consuming and costly. This work reports on detection of Zn by anodic stripping voltammetry (ASV) on bismuth electrodes in a microfabricated electrochemical cell. The working potential window of the electrodeposited bismuth film electrode was investigated by cyclic voltammetry, while square wave ASV was used for measuring Zn in acetate buffer and blood serum. Conditions critical to sensing, such as preconcentration potential, preconcentration time, and buffer pH, were optimized for Zn detection. The sensor was successfully calibrated with pH 6 acetate buffer in the physiologically-relevant range of 5 μM to 50μM Zn and exhibited well-defined and highly repeatable peaks. The sensor was used to demonstrate measurement of Zn in blood serum digested in HCl. The results of this work show that Zn detection in serum is possible with smaller sample volumes (μL vs. μL) and faster turnaround time (hours vs. days) as compared with the conventional spectroscopic methods.
Keywords: Anodic stripping voltammetry, Bismuth electrode, Microfabricated electrochemical cell, Zinc in serum
1 Introduction
Zinc (Zn) is an essential trace element required for normal function of multiple enzymes, hormones, and transcription-related factors [1,2]. Zn homeostasis is required for normal functioning of the immune system, insulin secretion/action, and anti-oxidant systems, all processes known to be disturbed in critical illness. Pediatric and adult studies have consistently demonstrated abnormally low zinc levels in critically ill patients as inflammation and infection are associated with reduced serum levels of zinc [3-8]. Zn supplementation may be a beneficial therapeutic strategy in critically ill patients [9-12]. However, for this strategy to work safely, serum zinc levels must be monitored constantly.
The conventional methods for measuring Zn in bodily fluids are accurate, but costly and time consuming. For example, Rahman et al. [13] used instrumental neutron activation analysis (INAA) and atomic absorption spectrophotometry (AAS) to validate quantification of Zn in whole blood of cardiovascular diseases (CVD) and malignant hypertension (MH) patients. Barany et al. [14] used inductively coupled plasma mass spectroscopy (ICP-MS) to measure multiple trace elements including Zn in blood and serum of adolescents. The most critical challenge of these conventional methods is the time delay from sample collection, shipment to a certified metals laboratory, and reporting results to a clinician. Also, laboratory costs associated with these repeated measurements may be high. These challenges are particularly important when dealing with critically ill patients.
Stripping analysis is a powerful yet simple approach to measuring trace metal concentrations. It offers very low limits of detection and simple instrumentation. Thus, it is preferred for “on-site” applications and can be miniaturized for portable and inexpensive field operations [15,16]. Mercury electrodes are typically used in stripping analysis and produce reliable measurements. Different forms of mercury electrodes have been reported in literature for the detection of Zn including hanging mercury drop electrode (HDME), mercury thin film electrode (MFE), chemically modified mercury film electrode and mercury film on screen printed carbon-paste electrodes [17-22]. However, the toxicity of mercury electrodes leads to strict safety and handling requirements, presenting a critical challenge for “on-site” applications.
Bismuth electrode is an emerging approach that is replacing mercury electrodes due to its non-toxic nature and excellent properties for the detection of electronegative metals [23-25]. Kefala et al. [26] have recently demonstrated detection of Zn by ASV with a detection limit of 0.4 μg/L for both in situ and ex situ deposited bismuth on Nafion-coated glassy carbon electrodes. Kruusma et al. [27] reported stripping on glassy carbon and Nafion-coated glassy carbon mercury electrodes but without significant sensitivity, and discussed the necessity of blood extraction procedures. Serrano et al. [28] reported on complexation of bismuth electrode for the detection of Pb, Cd and Zn in the presence of phthalate. Rico et al. [29-32] demonstrated bismuth co-deposition on commercially-available screen-printed strips for detection of Pb, Cd and Zn. Pencil-lead coated with bismuth was used by Economou and Voulgaropoulos [33] for detection of zinc, but their electrodes were fragile and suffered from breakage during handling. Bismuth modified electrodes, such as the graphite-epoxy composite electrodes (Bi-GECE), carbon nanotubes (Bi-CNT) and bismuth/poly(p-amino-benzene sulfonic acid) film electrode have also been reported in literature [34-36]. Despite this recent progress, electrochemical sensors using bismuth electrodes are yet to be applied to point-of-care situations where focus is on rapid analysis of small (<1 mL) sample volumes.
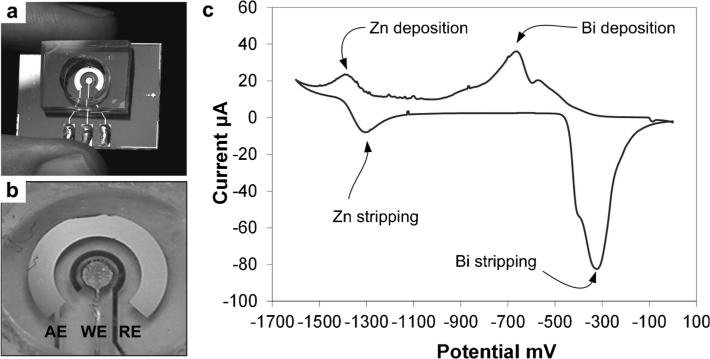
In this work, a miniaturized lab-on-a-chip sensor was developed for measurement of Zn by ASV in serum (Figure 1). The sensor is based on our earlier design [37] and integrates a silver/silver chloride (Ag/AgCl) reference electrode and a gold auxiliary electrode. Bismuth was selected as the working electrode due to its desirable characteristics of low toxicity and suitability for stripping voltammetry [23-25]. We fabricated the sensor using a combination of ex situ electrodeposition and soft lithography methods. Compared with the previous reports [23-25, 29-32], our sensor offers a substantial reduction in sample volume (100 μL) and benefits from batch fabrication methods leading to low-cost, disposable devices. Ultimately, microfluidics can be used to integrate sample preparation with the demonstrated sensor for point-of-care operation which would facilitate near-real-time field and clinical applications. It is envisioned that development of such a portable sensor could lead to bedside quantification of blood Zn concentrations.
Fig. 1.
(a) Microfabricated electrochemical sensor. (b) Close-up of the sensor electrodes (AE: auxiliary gold electrode, WE: Bi working electrode, RE: Ag/AgCl reference electrode). (c) Cyclic voltammetry of 1 mM Zn in acetate buffer pH 6 at Bi electrode preplated at −700 mV.
2 Experimental
2.1 Materials and Reagents
All reagents were used as purchased. Acetate buffer was prepared from sodium acetate salt (Fisher Scientific) and de-ionized water. Zinc stock solution was prepared from zinc acetate salt in acetate buffer. AAS standard solution of Bi (III) ion in 2% HNO3 (Fisher Scientific) was used to make the bismuth plating solution and a concentration of 500 mg/L was made in acetate buffer. Commercially available silver-plating solution from Technic, Inc. was used for the fabrication of the Ag/AgCl reference electrode. Wet etchants for the gold etching and the Ti etching were made from salts and acids namely: the Au etchant was made from 20 g I2: 5 g KI: 200 mL of DI water (w/w/v) and the Ti etchant was made from HNO3, HF and water in the ratio 1:2:7.
2.2 Instrumentation
The sensor consists of a three-electrode system inside a polydimethylsiloxane (PDMS) well. The electrodes were fabricated by electrodeposition on a 200 nm thick gold layer evaporated on a glass substrate. Photolithography was used for patterning the sensor electrodes during device fabrication. The Ag/AgCl reference electrode was formed by electrodeposition of ~2 μm Ag (5 mA/cm2 for 15 s), followed by chloridization in 1 M KCl solution to form an AgCl layer. Unmodified gold surface was used as the auxiliary electrode. The working electrode consisted of a bismuth film, ~1 μm thick. The bismuth working electrode was fabricated by electrodepositing Bi by reduction of Bi3+ from a solution of 0.1 M acetate buffer and 500 mg/L bismuth (III) at −800 mV for 240 s. The concentration of Bi in the plating solution was varied from 50 mg/L to 500 mg/L and was electrodeposited on gold slides of 1 cm2 area. The Zn chip was completed by the fabrication of polydimethylsiloxane (PDMS) Sylgard 184 (Dow Corning) polymer well using the standard soft lithography methods as discussed in previous work [38]. The Reference 600 (Gamry) and BAS100W (BioAnalytical Systems) potentiostats were used in both device fabrication and electrochemical measurements.
2.3 Serum Sample Preparation
Blood was draw from a healthy adult female into metal free, no additives, sterile, Royal Blue Top Tubes (BD Vacutainer). These samples were centrifuged (Eppendorf 5810R) at 4000 rpm for 8 min at 35°C. Serum was then taken off via pipet into tube transport containers (ARUP Labs PK/100 Trace Metal Free Transport Tubes) which were stored at room temperature. For each experiment, 200 μL of serum was digested for 24 h in 0.2 M HCl. Following acid digestion, the sample was adjusted to pH 6 with 0.1 M sodium acetate. The resulting serum dilution was 1:10. A 200 μL of the acid-digested and pH-adjusted serum sample was used for ASV measurements.
2.4 ASV Measurements
An optimized preconcentration potential of −1.6 V (vs. the on board Ag/AgCl reference electrode) and preconcentration time of 600 s were used for buffer and serum samples. A vibrating platform (Fisher Scientific) was used to stir sample during preconcentration. This was followed by a 10 s “quiet time” interval between the preconcentration and stripping steps. The stripping step was performed with square wave stripping voltammetry (SWSV) using the following parameters: 25 mV pulse amplitude, 15 Hz pulse frequency, and 4 mV square wave step voltage. A Reference 600 potentiostat (Gamry Instruments) was used for all experiments.
3 Results and Discussion
3.1 Optimization of ASV Parameters
We first characterized the electrochemical sensor by cyclic voltammetry (CV) of 1 mM Zn in pH 6 sodium acetate buffer at a microfabricated gold electrode that had been pre-plated with Bi. The potential was initially scanned from 0 to −1600 mV and then back at a scan rate of 75 mV/s. A representative CV in Figure 1c shows the bismuth deposition peak on gold at −700 mV and the stripping peak at −300 mV. The CV also indicates the deposition peak for Zn on the Bi film at −1400 mV and the stripping peak at −1300 mV. The rapid increase in current that occurs beyond −1600 mV shows the onset of hydrolysis at the working electrode. The region between the stripping peak of the Bi and the beginning of hydrolysis defines the working potential window of the electrodeposited Bi working electrode, which is approximately 1300 mV wide. These results confirm suitability of Bi as a working electrode material for detection of electronegative Zn.
Since Bi working electrodes were prepared by electrodeposition, we investigated the relation between the Bi concentration in the plating solution and the thickness of the resulting films. As expected, we found that increasing the Bi concentration in the plating solution while maintaining a constant plating time yielded thicker Bi films, which was confirmed by the increased area under the Bi stripping peak in the CVs. In addition, the slope of the hydrolysis current decreased with the increasing Bi concentration in the plating solution, leading to smaller background currents. The Bi films were preplated on the circular gold microfabricated electrode before each measurement. Kefala and Economou [26] compared performance of pre-plated (Bi deposited from a separate plating solution before the analysis of samples) and in situ plated (Bi added to all samples for simultaneous plating and deposition of sample metal ions) Bi films and reported the two methods to be comparable in terms of sensitivity. We used in situ plating in our work because it is simpler in terms of the experimental and fabrication procedures. Thus, following every ASV measurement the Bi film was completely stripped off and a fresh Bi film was re-deposited for the subsequent measurement. A cleaning step was performed prior to in situ electrodeposition by biasing the working electrode at 0 mV for 200 s which ensured stripping of previously-plated bismuth film. This cleaning step was found to increase the consistency of the deposited Bi films and demonstrated excellent reproducibility.
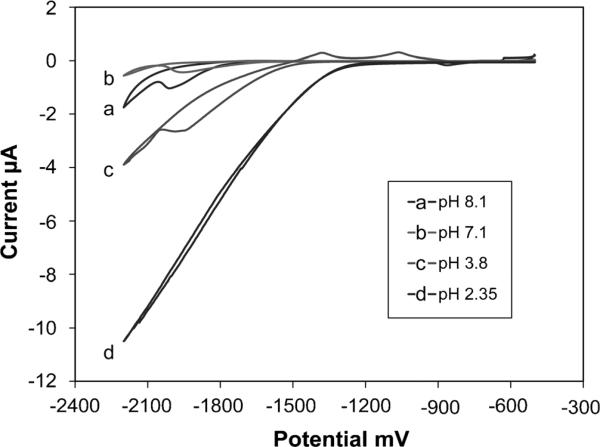
To investigate the effects of the electrolyte solution pH on sensor performance, we varied pH from 2.35 to 8.1. As CVs in Figure 2 show, the more neutral pH of the 0.1 M sodium acetate buffer leads to a wider potential window. The onset of hydrolysis occurred much earlier at −1250 mV at acidic pH 2.35, than at neutral pH 7.1 or slightly basic pH 8.1 (−1750 to −2100 mV). However for the experiments herein, a slightly acidic pH 6 was chosen for two reasons. Firstly, the Bi ions are more susceptible to hydrolysis in a more alkaline medium [39]. Secondly, detection of Zn in serum requires digestion of blood protein by acidification in order to release sequestered Zn ions, and thus the sample must be buffered back to a more neutral pH for measurement. Less buffer capacity is required to raise the pH to 6 than to a more basic pH.
Fig. 2.
Cyclic voltammograms showing optimization of 0.1 M acetate buffer pH.
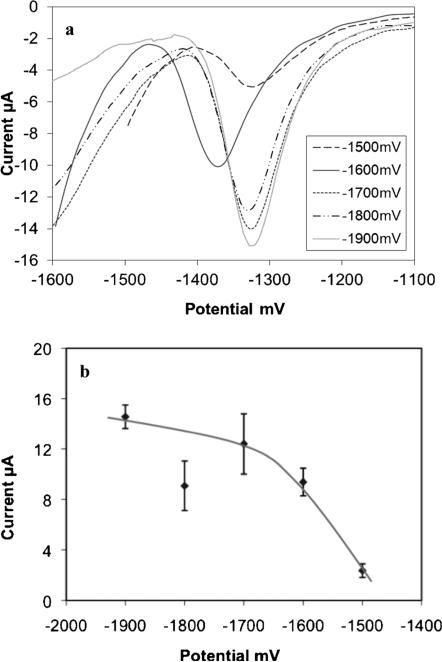
One of the most critical parameters that needed optimization was the preconcentration potential. Zn poses a challenge for detection due to the increased background current from hydrolysis at the working electrode as the deposition potential is made more negative. Thus, to limit the effect of hydrolysis and increase the Zn stripping current, we optimized the preconcentration potential by varying it from −1500 mV to −1900 mV. The resulting ASV peaks in Figure 3a indicate that the currents measured for stripping of Zn at −1700 mV and above were higher than the ones obtained at −1500 mV and −1600 mV. However, the hydrolysis caused hydrogen and oxygen evolution at the working and auxiliary electrodes, respectively, at preconcentration potentials above −1600 mV, which affected reproducibility of the measurements. This also caused the loss of counter electrode function by turning it to a burned black color at times due to the vigorous gas evolution and thus decreasing the sensor lifetime. Decreasing the preconcentration potential to −1600 mV produced reproducible current measurements. However, decreasing the preconcentration potential further to −1500 mV resulted in much lower Zn stripping peak currents. Figure 3b plots the measured current as a function of preconcentration potential. The preconcentration potential was similarly optimized for the detection of Zn in serum samples in acetate buffer with similar results. Considering these experiments, the −1600 mV preconcentration potential was selected.
Fig. 3.
(a) Stripping voltammograms showing optimization of the preconcentration potential in 10 μM Zn in acetate buffer of pH 6 and (b) the corresponding plot of peak current obtained for the varying preconcentration potentials.
We should note that although each data point was repeated at least three times, we still could not obtain a consistent signal current at −1800 mV. The reasons for this are not clear. Nevertheless, this deviation is inconsequential, considering that at −1.9 V the current is back on track with the expected curve and −1600 mV preconcentration potential was selected.
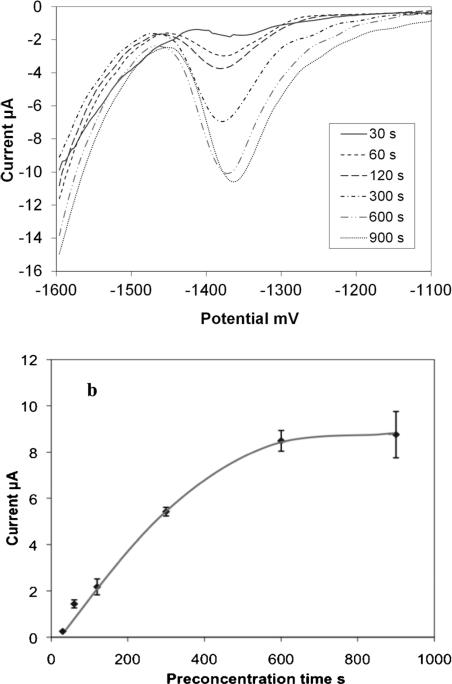
We next optimized preconcentration time and found 600 s to yield sufficient peak currents for detection in the physiological range of 9 μM–18 μM. For this, a 200 μL sample of acetate buffer containing 10 μM Zn was preconcentrated for varying times ranging from 30 s to 900 s. Figure 4 shows that peaks begin appearing at 30 s and steadily increase with increased preconcentration time, saturating at approximately 600 s. Thus, a 600 s precon centration time was selected for all subsequent ASV experiments. The potential was scanned from −1600 mV (also preconcentration potential) to −600 mV.
Fig. 4.
(a) Stripping voltammograms showing optimization of the preconcentration time for 10 μM Zn in acetate buffer of pH 6 and (b) the corresponding plot of peak current obtained for the varying preconcentration times.
3.2 Sensor Calibration with pH 6 Acetate Buffer
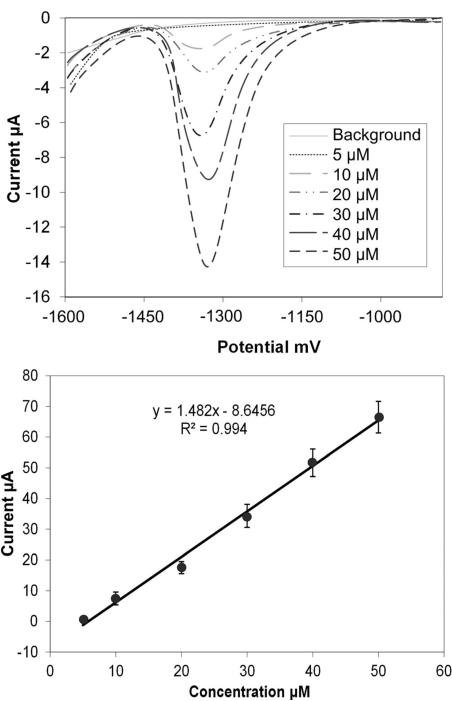
The sensor was successfully calibrated with standard solutions of Zn in pH 6 acetate buffer using the optimized parameters. Figure 5a illustrates the anodic stripping peak for the Zn at −1360 mV. Five sets of measurements were recorded by the sensor for increasing concentrations of Zn in the 5 μM to 50 μM range using sample volumes of 200 μL. The corresponding increase of the current signal with the increase in concentration is shown. This spans the physiological range of Zn in blood serum, which is 9 μM to 18 μM. A linear calibration plot was constructed using these results (Figure 5b), demonstrating the high reliability and reproducibility for the detection of Zn in this range. The sensitivity was 1.482 A/M in the linear range. Others have reported co-deposition of Bi for the fabrication of the Bi electrode along with the metal ion to be detected and have compared with the performance of a preplated film [28,33]. They found that the signal stability of co-deposited or in situ deposited film was better compared to a preplated film as they reported that Zn and Cd were not measurable with the preplated film [28]. This may be the result of the Bi film loss. However, in our work, we did not experience this issue since after every measurement the bismuth film was stripped off during a cleaning step and a fresh bismuth film was electroplated to produce reproducible results. Further, the Bi film was biased prior to introducing the sample solution into the electrochemical cell which prevented any loss of the Bi film before the ASV measurement.
Fig. 5.
(a) Anodic stripping voltammograms of Zn in the concentration range from 5 μM to 50 μM in 0.1 M acetate buffer of pH 6 and (b) the corresponding calibration plot of peak current.
The limit of detection (LOD) of the sensor was calculated by repeating the background signal 20 times for the acetate buffer at −1600 mV preconcentration potential and 600 s preconcentration time. The background signals were measured under the same conditions and after each measurement the cleaning step of stripping the Bi film was performed and a fresh Bi film was plated before the subsequent measurement. The LOD was calculated to be 6 μM using 3 times the standard deviation of the blank at −1360 mV and the linear equation from the calibration plot.
3.3 Detection of Zn in Serum
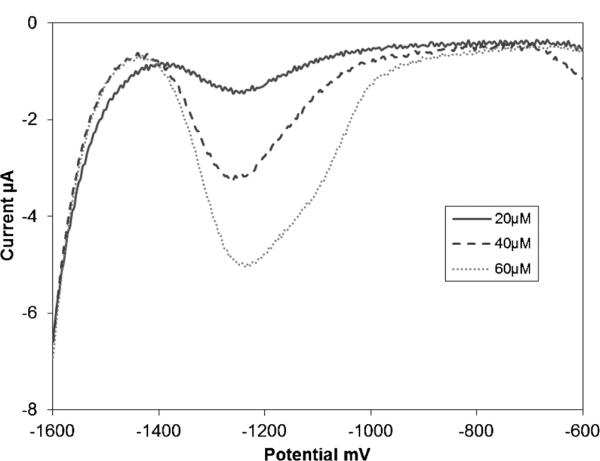
Detection of Zn in serum samples requires an additional serum digestion step in order to free Zn2+ bound by proteins. Multiple methods have been developed for protein digestion and subsequent metal ion release. For simplicity, a 24 h acid digestion in 0.2 M HCl was selected. Following digestion the sample was buffered to pH 6 with sodium acetate. Figure 6 shows the stripping voltammogram of the digested and buffered serum sample obtained using the previously optimized stripping parameters. The Zn stripping peak in this sample can be seen at −1210 mV vs. Ag/AgCl. This peak is shifted approximately 150 mV from the −1360 mV Zn stripping potential obtained in Figure 4. This slightly positive potential shift is believed to be due to the increased Cl− concentration resulting from the acid digestion step.
Fig. 6.
Anodic stripping voltammograms of serum spiked with Zn in the concentration range from 20 μM to 60 μM in 0.1 M acetate buffer of pH 6.
The digested and buffered serum sample was spiked in the cell with 20 μM, 40 μM and 60 μM Zn and stripping voltammograms were obtained. Similar to the unspiked serum sample, the Zn stripping potential for the spiked samples occurs at approximately −1210 mV vs. Ag/AgCl (Figure 6). It is important to note that the stripping voltammograms for all the serum samples gave lower than expected peak currents when compared to the peak currents obtained for similar Zn concentrations in buffer only. This difference could be due to several factors, including fouling of the bismuth film electrode, redepositing Bi between each trial, or possible interactions between the Zn2+ and the digested proteins. These factors could also explain the decreasing background current seen between the first voltammogram and the final voltammogram (Figure 6).
While we successfully demonstrated measurement of zinc in serum, a number of challenges remain. The limit of detection demonstrated by our sensor is 6 μM, which is higher than those reported by other bismuth-type electrodes, such as the in situ coated pencil-lead graphite electrodes [33]. This is due to differences in the working electrode area and the substantially smaller sample volumes (100× reduction from 20 mL to 200 μL in this work) which become depleted of Zn2+ during the deposition step. When these factors are considered, we believe the detection limits of our sensor are quite impressive. Nevertheless, we have explored Zn detection in the submicromolar range and found that while it is possible for the current sensor configuration (electrode size and sample volume) to measure Zn in that range, reproducibility of these measurements was not satisfactory. Considering that the physiologically-relevant range of interest is in the 10–50 μM range, the demonstrated detection limit is sufficient.
The detection limit may be improved by increasing the predisposition time to further increase depletion of Zn2+ from the sample. Meanwhile, the behavior of sensors in serum sample is still not as favorable, with poor stripping peak shape and significant (~10×) signal loss. The reasons for this are not yet clear, as no significant fouling or degradation has been observed on the electrodes, but is likely related to protein content in serum and electronegativity of Zn. Future work will address these issues and incorporate a standard addition calibration method which will allow for Zn quantification in a wide range of bio-samples.
4 Conclusions
In this work, we demonstrated the first monolithically fabricated electrochemical sensor capable of measuring zinc in serum. Controlled-potential electrodeposition was used to deposit bismuth film on a patterned gold layer to form the working electrode. The sensor demonstrated excellent reproducibility and reliability, with good sensitivity in the 5 μM to 50 μM range in pH 6 sodium acetate buffer. The working range of this sensor also perfectly matches with the physiological levels of zinc in blood serum. Detection of Zn in spiked serum samples was also successfully demonstrated.
The success in demonstrating this sensor allows us to envision the development of a point-of-care system for measuring zinc. Such a system must integrate a number of critical aspects, which our sensor addresses. First, the sensor itself must be low-cost and disposable, which is not the case for the vast majority of the zinc sensors reported to date, such as those based on bismuth-coated glassy carbon electrodes [29-31]. For our microfabricated sensors, while gold used as a seed layer is a relatively expensive substrate material, the cost for individual sensors is quite low due to batch fabrication methods that permit fabrication of multiple sensors (12 in our case) from a single gold-coated substrate. Microfabrication could further reduce these costs through further mass production, which is impossible for the commonly used carbon-based electrodes.
Second, and most important, a point-of-care sensor must be able to handle small sample volumes. Reduced sensor size and sample volume are essential requirements for the sensor in a portable point-of-care system, providing the possibility of integration with microfluidics and sample preparation functions. The sensor we reported herein uses only 200 μL of sample (approximately 4 medium-sized drops of blood), which is ~100× smaller volume than other reported sensors [30,33]. This significant reduction in sample volume will permit the sensor to be used in clinical applications or population studies involving children, who often are not able to produce large blood volumes needed for conventional sensor approaches. The issue of sample volume becomes even more important when repeated analyses over short time periods are necessary (such as monitoring Zn supplementation we discussed earlier). Finally, the analysis time of the point-of-care sensor must be short, so that results can be reported in a timely manner. This is especially important for bedside monitoring of critically ill patients. While the analysis time of our sensor is comparable to the existing electrodes [29-33], it is substantially shorter than the conventional approaches using AAS or IC-PMS that require shipment to a centralized laboratory.
The key advantages of our miniaturized sensor enable it to work in various matrices and various locations. In this work, we focused on detection of zinc in serum; offering promising clinical prospects for portable point-of-care system that would enable convenient and flexible monitoring of biological samples. The sensor could easily be extended beyond blood or serum to other biofluids, such as urine, sweat and saliva. It could also be applied to environmental samples such as contaminated soils or industrial waste water. The portable nature of the sensor will not limit measurements to just large, centralize laboratories, but rather could be performed at the bedside and at clinics in remote or undeveloped areas, avoiding significant delays associated with the conventional methods.
Acknowledgements
The authors gratefully acknowledge support provided by NIEHS (R21ES019255) and the NIH Center for Clinical and Translational Science and Training (CCTST) at Cincinnati Children ’s Hospital and Medical Center.
References
- 1.Heyland DK, Jones N, Cvijanovich NZ, Wong H. J. Parenter. Enteral Nutr. 2008;32:509. doi: 10.1177/0148607108322402. [DOI] [PubMed] [Google Scholar]
- 2.Ibs K, Rink L. J. Nutr. 2003:133. doi: 10.1093/jn/133.5.1452S. [DOI] [PubMed] [Google Scholar]
- 3.Cvijanovich N, Shanley TP, Lin R, Allen GL, Thomas NJ, Checchia P, Anas N, Freishtat RJ, Monaco M, Odoms K, Sakthivel B, Wong HR. Physiol. Genom. 2008;34:127. doi: 10.1152/physiolgenomics.00025.2008. [DOI] [PMC free article] [PubMed] [Google Scholar]
- 4.Cvijanovich NZ, King JC, Flori HR, Gildengorin G, Wong HR. Pediat. Crit. Care Med. 2009;10:29. doi: 10.1097/PCC.0b013e31819371ce. [DOI] [PubMed] [Google Scholar]
- 5.Shanley TP, Cvijanovich N, Lin R, Allen GL, Thomas NJ, Doctor A, Kalyanaraman M, Tofil NM, Penfil S, Monaco M, Odoms K, Barnes M, Sakthivel B, Aronow BJ, Wong HR. Mol. Med. 2007;13:495. doi: 10.2119/2007-00065.Shanley. [DOI] [PMC free article] [PubMed] [Google Scholar]
- 6.Wong HR, Cvijanovich N, Allen GL, Lin R, Anas N, Meyer K, Freishtat RJ, Monaco M, Odoms K, Sakthivel B, Shanley TP. Crit. Care Med. 2009;37:1558. doi: 10.1097/CCM.0b013e31819fcc08. [DOI] [PMC free article] [PubMed] [Google Scholar]
- 7.Wong HR, Shanley TP, Sakthivel B, Cvijanovich N, Lin R, Allen GL, Thomas NJ, Doctor A, Kalyanaraman M, Tofil NM, Penfil S, Monaco M, Tagavilla MA, Odoms K, Dunsmore K, Barnes M, Aronow BJ. Physiol. Genomics. 2007;30:146. doi: 10.1152/physiolgenomics.00024.2007. [DOI] [PMC free article] [PubMed] [Google Scholar]
- 8.Liuzzi JP, Lichten LA, Rivera S, Blanchard RK, Aydemir TB, Knutson MD, Ganz T, Cousins RJ. Proc. Natl. Acad. Sci. USA. 2005:102. doi: 10.1073/pnas.0502257102. [DOI] [PMC free article] [PubMed] [Google Scholar]
- 9.Bhutta ZA, Bird SM, Black RE, Brown KH, Gardner JM, Hidayat A, Khatun F, Martorell R, Ninh NX, Penny ME, Rosado JL, Roy SK, Ruel M, Sazawal S, Shankar A. Am. J. Clin. Nutr. 2000;72:1516. doi: 10.1093/ajcn/72.6.1516. [DOI] [PubMed] [Google Scholar]
- 10.Bhutta ZA, Nizami SQ, Isani Z. Pediatrics. 1999:103. doi: 10.1542/peds.103.4.e42. [DOI] [PubMed] [Google Scholar]
- 11.Ruel MT, Rivera JA, Santizo M, Lönnerdal B, Brown KH. Pediatrics. 1997;99:808. doi: 10.1542/peds.99.6.808. [DOI] [PubMed] [Google Scholar]
- 12.Sazawal S, Black RE, Ramsan M, Chwaya HM, Dutta A, Dhingra U, Stoltzfus RJ, Othman MK, Kabole FM. Lancet. 2007;369:927. doi: 10.1016/S0140-6736(07)60452-8. [DOI] [PubMed] [Google Scholar]
- 13.Rahman S, Wahid S. J. Radioanal. Nucl. Chem. 2009;3:915. [Google Scholar]
- 14.Barany E, Bergdahl IA. Toxicol. Lett. 1996;88:87. [Google Scholar]
- 15.Kissinger P, Heineman WR, editors. Laboratory Techniques in Electroanalytical Chemistry. Marcel Dekker; New York: 1996. p. 1008. [Google Scholar]
- 16.Krolicka A, Bobrowski A, Kalcher K, Mocak J, Svancara I, Vytras K. Electroanalysis. 2003;15:1859. [Google Scholar]
- 17.Israel Y, Ofir T, Rezek J. Mikrochim. Acta. 1978;69:151. [Google Scholar]
- 18.Lu T, Huang J, Sun I. Anal. Chim. Acta. 2002;454:93. [Google Scholar]
- 19.Barbeira PJS, Mazo LH, Stradiotto NR. Analyst. 1995;120:1647. [Google Scholar]
- 20.Opydo J. Water Air Soil Pollut. 1989;45:43. [Google Scholar]
- 21.Martinotti W, Queirazza G, Guarinoni A, Mori G. Anal. Chim. Acta. 1995;305:183. [Google Scholar]
- 22.Desmond D, Lane B, Alderman J, Hill M, Arrigan DWM, Glennon JD. Sens. Actuators B, Chem. 1998;48:409. [Google Scholar]
- 23.Jorge EO, Neto MMM, Rocha MM. Talanta. 2007;72:1392. doi: 10.1016/j.talanta.2007.01.047. [DOI] [PubMed] [Google Scholar]
- 24.Pauliukaite R, Hočevar SB, Ogorevc B, Wang J. Electroanalysis. 2004;16:719. [Google Scholar]
- 25.Wang J, Lu J, Hocevar SB, Farias PAM, Ogorevc B. Anal. Chem. 2000;72:3218. doi: 10.1021/ac000108x. [DOI] [PubMed] [Google Scholar]
- 26.Kefala G, Economou A, Voulgaropoulos A. Analyst. 2004;129:1082. doi: 10.1039/b404978k. [DOI] [PubMed] [Google Scholar]
- 27.Kruusma J, Banks CE, Nei L, Compton RG. Anal. Chim. Acta. 2004;510:85. [Google Scholar]
- 28.Serrano N, Martín N, Díaz-Cruz JM, Ariño C, Esteban M. Electroanalysis. 2009;21:431. [Google Scholar]
- 29.Rico MAG, Olivares-Marin M, Gil EP. Talanta. 2009;80:631. doi: 10.1016/j.talanta.2009.07.039. [DOI] [PubMed] [Google Scholar]
- 30.Kefala G, Economou A, Voulgaropoulos A, Sofoniou M. Talanta. 2003;61:603. doi: 10.1016/S0039-9140(03)00350-3. [DOI] [PubMed] [Google Scholar]
- 31.Guo Z, Feng F, Hou Y, Jaffrezic-Renault N. Talanta. 2005;65:1052. doi: 10.1016/j.talanta.2004.08.060. [DOI] [PubMed] [Google Scholar]
- 32.Granado Rico MÁ, Olivares-Marín M, Gil EP. Electroanalysis. 2008;20:2608. [Google Scholar]
- 33.Demetriades D, Economou A, Voulgaropoulos A. Anal. Chim. Acta. 2004;519:167. [Google Scholar]
- 34.Kirgos UA, Marin S, Pumera M, Merkoci A, Alegret S. Electroanalysis. 2005;17:10. [Google Scholar]
- 35.Hwang GH, Han WK, Park JS, Kang SG. Talanta. 2008;76:301. doi: 10.1016/j.talanta.2008.02.039. [DOI] [PubMed] [Google Scholar]
- 36.Wu Y, Li NB, Luo HQ. Sens. Actuators B, Chem. 2008;133:677. [Google Scholar]
- 37.Jothimuthu P, Wilson RA, Herren J, Haynes EN, Heineman WR, Papautski J. Biomed. Microdevices. 2011;13:695. doi: 10.1007/s10544-011-9539-1. [DOI] [PMC free article] [PubMed] [Google Scholar]
- 38.Bhagat AAS, Peterson ETK, Papautsky I. J. Micromech. Microeng. 2007;17:1017. [Google Scholar]
- 39.Kokkinos C, Economou A. Curr. Anal. Chem. 2008;4:183. [Google Scholar]


