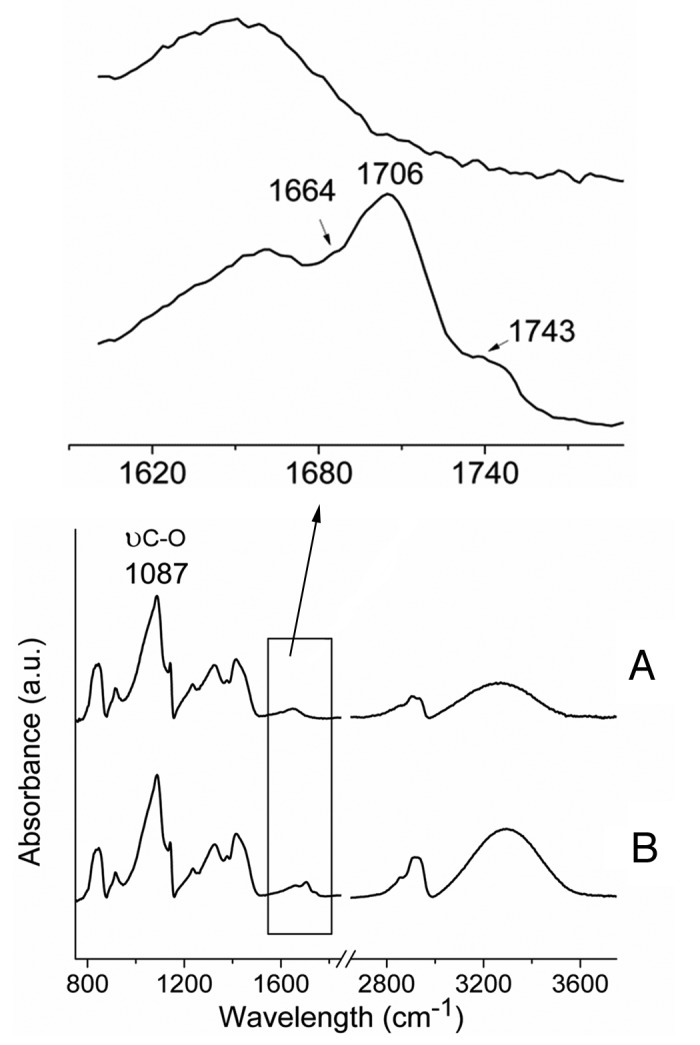
Figure 2. FTIR spectra of PVA films before (A) and after plasma treatment (B). New peaks and bands appeared at 1654 cm−1, 1705 cm−1 and 3200–3400 cm−1, associated to amide, carboxylic acid and OH/NH functionalities, respectively. A.u., arbitrary units.
