

Abstract
Purpose
Myelodysplastic syndromes (MDS) are clonal hematopoietic disorders that are more common in patients aged ≥ 60 years and are incurable with conventional therapies. Reduced-intensity conditioning (RIC) allogeneic hematopoietic stem-cell transplantation is potentially curative but has additional mortality risk. We evaluated RIC transplantation versus nontransplantation therapies in older patients with MDS stratified by International Prognostic Scoring System (IPSS) risk.
Patients and Methods
A Markov decision model with quality-of-life utility estimates for different MDS and transplantation states was assessed. Outcomes were life expectancy (LE) and quality-adjusted life expectancy (QALE). A total of 514 patients with de novo MDS aged 60 to 70 years were evaluated. Chronic myelomonocytic leukemia, isolated 5q– syndrome, unclassifiable, and therapy-related MDS were excluded. Transplantation using T-cell depletion or HLA-mismatched or umbilical cord donors was also excluded. RIC transplantation (n = 132) stratified by IPSS risk was compared with best supportive care for patients with nonanemic low/intermediate-1 IPSS (n = 123), hematopoietic growth factors for patients with anemic low/intermediate-1 IPSS (n = 94), and hypomethylating agents for patients with intermediate-2/high IPSS (n = 165).
Results
For patients with low/intermediate-1 IPSS MDS, RIC transplantation LE was 38 months versus 77 months with nontransplantation approaches. QALE and sensitivity analysis did not favor RIC transplantation across plausible utility estimates. For intermediate-2/high IPSS MDS, RIC transplantation LE was 36 months versus 28 months for nontransplantation therapies. QALE and sensitivity analysis favored RIC transplantation across plausible utility estimates.
Conclusion
For patients with de novo MDS aged 60 to 70 years, favored treatments vary with IPSS risk. For low/intermediate-1 IPSS, nontransplantation approaches are preferred. For intermediate-2/high IPSS, RIC transplantation offers overall and quality-adjusted survival benefit.
INTRODUCTION
The myelodysplastic syndromes (MDS) are clonal hematopoietic disorders characterized by ineffective hematopoiesis, marrow dysplasia, and variable rates of transformation to acute myeloid leukemia (AML). MDS incidence rises markedly with age, whereas outcome worsens.1,2
Of various systems to predict MDS outcomes, the International Prognostic Scoring System (IPSS), developed by the International MDS Risk Analysis Workshop (IMRAW), is most frequently used.1,3–11 Several groups have validated its utility.12,13 The revised-IPSS (IPSS-R) classification requires additional variables but offers greater prognostic power.14 Additionally, anemia/RBC transfusion dependence, incorporated into the WHO classification–based prognostic scoring system (WPSS), implies a worse prognosis, especially for lower risk MDS.15–17
Lenalidomide is approved for 5q– MDS and can reduce transfusion requirements in patients with non–5q– MDS, although its survival impact remains uncertain.18–20 Patients with nonanemic low/intermediate-1 IPSS MDS are offered best supportive care (BSC).21 Erythropoiesis-stimulating agents (ESA; erythropoietin ± granulopoiesis-stimulating factors) may offer a survival advantage for anemic patients or those with RBC transfusion-dependent low/intermediate-1 IPSS MDS.22,23 Hypomethylating agent therapy can reduce rate of AML progression in patients with intermediate-2/high IPSS MDS, and azacytidine has been demonstrated to improve survival.24–26 Unfortunately these treatments seldom induce durable remissions, and none are curative.
Allogeneic hematopoietic stem-cell transplantation is potentially curative. In myeloablative conditioning (MAC) transplantation, IPSS risk is correlated with MDS relapse and disease-free survival.27 Treatment-related mortality (TRM) is 35% to 80%, varying with age and other factors.28–36 In a prior analysis, we documented that for patients 18 to 60 years of age with intermediate-2/high IPSS MDS, early MAC transplantation provides maximal quality-adjusted survival.37 However, 75% of patients with MDS are ≥ 60 years at diagnosis and are typically not considered MAC transplantation candidates.1
In patients ≥ 60 years of age, reduced-intensity conditioning (RIC) transplantation is potentially curative but is also associated with mortality risk. Retrospectively, TRM was 26% to 41%, with long-term MDS/AML survival of 27% to 54%.35,38,39 RIC transplantation in older patients remains uncertain because MDS prognosis differs from that of younger patients, and RIC and MAC transplantation risks and benefits may also differ.1,16,40 A retrospective report suggests that transplantation benefits patients with advanced MDS/AML who are 60 to 70 years old, but head-to-head comparisons of RIC transplantation versus nontransplantation approaches are lacking for MDS.41
Decision analysis is a statistical technique to aid medical decision making under conditions of uncertainty. The technique is flexible and allows assessment of outcome given multiple variations of initial testing conditions and assumptions.42 It has been applied widely in hematologic diseases.37,43–46 We undertook a decision analysis in patients with de novo MDS aged 60 to 70 years to determine life expectancy after early RIC transplantation versus conventional nontransplantation therapies. Quality-of-life (QoL) considerations were incorporated. Robustness of the conclusions was assessed.
PATIENTS AND METHODS
Data Sets
Inclusion criteria comprised de novo MDS in patients aged 60 to 70 years (there were insufficient patients > 70 years of age). Isolated 5q–, therapy-related, and unclassifiable MDS and chronic myelomonocytic leukemia were excluded. When data was available, patients with inadequate performance status (Eastern Cooperative Oncology Group performance status [ECOG PS] >2) or organ dysfunction (renal, hepatic) were excluded. The analysis was updated July 9, 2012.
BSC.
A total of 123 patients with nonanemic low/intermediate-1 IPSS MDS with a median age of 66 years (range, 60 to 70 years) and median follow-up in survivors of 40 months (range, 2 to 187 months) were accessed from University of Pavia (1992 through 2010) and IMRAW data sets (1976 through 1993; Table 1).1,16 Survival and IPSS was measured from MDS diagnosis, the start of BSC. ECOG-PS and comorbidities were unavailable.
Table 1.
Baseline Characteristics of the MDS Data Sets
| Characteristic | BSC | Growth Factors* | HypoM Agents | RIC HSCT CIBMTR | RIC HSCT non-CIBMTR | Non-HSCT Total† | HSCT Total‡ | P CIBMTR v Non-CIBMTR | P HSCT v Non-HSCT |
|---|---|---|---|---|---|---|---|---|---|
| No. of patients | 123 | 91 | 164 | 88 | 44 | 378 | 132 | ||
| Age, years | .02 | < .001 | |||||||
| Median | 66 | 67 | 66 | 63 | 64 | 66 | 64 | ||
| Range | 60-70 | 60-70 | 60-70 | 60-70 | 60-70 | 60-70 | 60-70 | ||
| Male sex | .80 | .11 | |||||||
| No. | 72 | 54 | 121 | 63 | 34 | 247 | 97 | ||
| % | 59 | 59 | 74 | 72 | 77 | 65 | 73 | ||
| Follow-up for survivors, months | .15 | .29 | |||||||
| Median | 40 | 38 | 20 | 24 | 36 | 30 | 30 | ||
| Range | 2-187 | 2-113 | 5-46 | 3-96 | 17-109 | 2-187 | 3-109 | ||
| IPSS risk group | .20 | .84 | |||||||
| Low/int-1 | — | ||||||||
| No. | 123 | 91 | 45 | 28 | 214 | 73 | |||
| % | 100 | 100 | 51 | 64 | 57 | 55 | |||
| Int-2/high | — | — | |||||||
| No. | 164 | 43 | 16 | 164 | 59 | ||||
| % | 100 | 49 | 36 | 43 | 45 |
Abbreviations: BSC, best supportive care (International Myelodysplastic Syndrome Risk Analysis and University of Pavia data sets); HSCT, hematopoietic stem-cell transplantation; Hypo-M, hypomethylating agents (Celgene AZA-001, Groupe Francophone des Myelodysplasies compassionate-use azacytidine, and MD Anderson Cancer Center decitabine data sets); int, intermediate; IPSS, International Prognostic Scoring System; Non-CIBMTR RIC, reduced-intensity conditioning transplantation data sets of Dana-Farber Cancer Institute and Fred Hutchinson Cancer Research Center; RIC CIBMTR, Center for International Blood and Marrow Transplant Research reduced-intensity conditioning transplantation data set.
Erythropoiesis ± granulopoiesis stimulating agents (Nordic MDS and Groupe Francophone des Myelodysplasies data sets).
Total of BSC, Growth Factors, HypoM data.
Total of CIBMTR and Dana-Farber Cancer Institute and Fred Hutchinson Cancer Research Center data.
ESA therapy.
A total of 91 anemic (hemoglobin <10 g/dL) or RBC transfusion–dependent patients with low/intermediate-1 IPSS MDS and a median age of 67 years (range, 60 to 70 years) and median follow-up in survivors of 38 months (range, 2 to 113 months) was accessed from the Nordic MDS Group (1992 through 1998) and the Groupe Francophone des Myelodysplasies (GFM; 1998 through 2005) ESA data sets (Table 1).22,23 Survival and IPSS was measured from start of ESA therapy. ECOG-PS and comorbidities were unavailable.
Hypomethylating agent therapy.
A total of 164 patients with intermediate-2/high IPSS MDS and a median age of 66 years (range, 60 to 70 years) and median follow-up in survivors of 20 months (range, 5 to 46 months) were accessed from the multicenter randomized azacytidine trial (AZA-001; 2004 through 2006), GFM compassionate-use azacytidine (ATU; 2005 through 2009), and MD Anderson Cancer Center decitabine (MDACC; 2003 through 2008) data sets (Table 1).47–49 Survival and IPSS was measured from the start of hypomethylating agent therapy. Patients with ECOG PS more than 2 or baseline organ dysfunction (renal, hepatic) were excluded.
Transplantation therapy.
A total of 132 patients with de novo MDS undergoing T-replete ≥ 8/8 HLA-matched RIC transplantation with a median age of 64 years (range, 60 to 70 years) and a median follow-up in survivors of 30 months (range, 3 to 109 months) were accessed from the Center for International Blood and Marrow Transplant Research (CIBMTR), Dana-Farber Cancer Institute (DFCI), and Fred Hutchinson Cancer Research Center (FHCRC) data sets (overall RIC cohort time period, 1998 through 2009; Table 1). Survival was measured from transplantation. Pretransplantation therapies were unavailable. IPSS was based on the pretransplantation score. They include 73 patients (55%) with low/intermediate-1 IPSS and 59 patients (45%) with intermediate-2/high IPSS. Transplantation using alternative donors (umbilical cord blood, haploidentical, or HLA-mismatched grafts) or T-cell depletion in vitro (eg, CD34+ selection or T-cell antibody–based depletion) or in vivo (antithymocyte globulin or alemtuzumab-based conditioning) was excluded. The CIBMTR and non-CIBMTR data sets had a 1-year difference in age (63 v 64 years; P = .02; Table 1).
Decision Model
Separate Markov models were created to reflect outcomes of RIC transplantation versus nontransplantation therapy (Fig 1) for low/intermediate-1 (model A) or intermediate-2/high IPSS (model B). All patients were considered to be in one of three Markov health states within each model: (1) alive with MDS, (2) alive after RIC transplantation, or (3) dead. Cohort analysis used the TreeAge Pro 2009 software package (TreeAge Software, Williamstown, MA). Cycle length was 3 months with RIC transplantation or nontransplantation therapy initiated in cycle 1. The model encompassed 10 years of follow-up. Transition probabilities between Markov states were calculated from the underlying survival rate of the cohorts in the data sets and thereafter extrapolated from the slope of the terminal survival probability in each cohort, adjusting for the US general population mortality rate according to age, sex, and race (ASR) and allowed to vary over time. Using cohort analysis, life expectancy (LE) was calculated from the area under the survival curves, whereas quality-adjusted life expectancy (QALE) reflected adjustment for quality of survival. In decision analysis, the strategy leading to the greatest LE or QALE is deemed superior. We also undertook Monte-Carlo simulation (n = 10,000) based on the underlying transition probabilities in each cohort to visually depict Kaplan-Meier survival plots (with log-rank P values).
Fig 1.

Markov decision model. All patients (stratified by risk state into low/intermediate-1 International Prognostic Scoring System [IPSS; model A] or intermediate-2/high IPSS [model B]) began in the “alive with MDS” state and were able to transition after each 3-month cycle to other health states as indicated. The reduced-intensity conditioning (RIC) transplantation state was transitory, and all patients entering the transplantation state transitioned to another health state by the end of the cycle. MDS, myelodysplastic syndromes.
Model Assumptions
A 3-month cycle length was chosen to best represent MDS natural history. This implies that patients can only transition between health states every 3 months. We assume a sequential transition. Patients in any health state can die, but they cannot for instance have low IPSS MDS in one cycle and be alive post-RIC in the next without an intervening transplantation cycle. Events within each cycle were assumed to occur at midcycle. We categorized MDS risk per pretreatment IPSS. We applied ASR general population mortality rates to MDS and transplantation-specific mortality rates because the underlying population mortality in older patients owing to other conditions is not negligible. When data were available, we excluded nontransplantation patients with organ dysfunction or impaired performance status who would not have been transplantation candidates. Other model assumptions were kept to a minimum for simplicity and because the cohort survival estimates already incorporated changes in individual patient clinical status (eg, treatment complications, disease progression). We did not formally model MDS/AML progression or disease relapse after RIC transplantation, as they are already part of the cohort survival estimate. We also did not censor treatment cross-over (eg, later RIC transplantation in the nontransplantation cohort), permitting clinically appropriate salvage for nonresponders. The model was externally validated by comparing model-generated outcomes with the primary data.
Base Case
The base case (typical patient) was an otherwise healthy patient aged 65 years recently diagnosed with MDS who is deciding between HLA-matched RIC transplantation and nontransplantation treatments.
QoL
We incorporated health state utilities in the model to acknowledge QoL differences after different treatments. State utilities range from 0 (QoL equivalent to dead) to 1 (optimal health) and are intended to reflect how people value their lives given differing health conditions. Survival time with poor QoL is valued less than time in good health. QoL-adjusted MDS and RIC transplantation health states were based on published estimates of state utility values for MDS, AML, and transplantation, whose therapy may have differed from that of our patients (Table 2).37,44,46,50,51 We therefore also conducted sensitivity analyses across the range of plausible QoL values for each health state. In two-way sensitivity analyses, QoL after RIC transplantation and QoL for MDS were varied together; the optimal strategy was that which provided superior QALE. Conservative estimates were used when a broad range was suggested by the literature, for example, the state utility for being alive after transplantation with chronic graft-versus-host disease, estimated at between 0.6 and 0.9 in prior reports, was maintained at 0.6 for this analysis.37,44,46,50
Table 2.
Estimated QoL Health State Utilities
| QoL Adjustment for MDS and Transplantation States | Estimated State Utility |
|---|---|
| Low/intermediate-1 IPSS | |
| Transfusion-independent MDS | 0.84 |
| Transfusion-dependent MDS | 0.60 |
| Estimated Plausible QoL range | 0.54-0.94 |
| Intermediate-2/high IPSS | |
| MDS on hypomethylating agent therapy | 0.53 |
| Estimated Plausible QoL range | 0.33-0.73 |
| RIC Transplantation | |
| Post-transplantation without chronic GVHD | 0.92 |
| Post-transplantation with chronic GVHD | 0.60 |
| Estimated Plausible QoL range | 0.60-0.92 |
Abbreviations: IPSS, International Prognostic Scoring System; GVHD, graft-versus-host disease; MDS, myelodysplastic syndromes; QoL, quality of life.
Other Analyses
We assessed whether conclusions were altered by (1) time from MDS diagnosis, and (2) anemia/transfusion-dependence (for low/intermediate-1 IPSS risk). We also tested whether discounting future versus present survival (3% annually) influenced conclusions. Finally, we evaluated the impact of a plateau in long-term transplantation survival (ie, terminal ASR-only mortality).
RESULTS
For 287 patients with low/intermediate-1 IPSS, early RIC transplantation had an LE of 38 months versus 77 months with nontransplantation therapies (BSC, ESA; Table 3). Figure 2A shows a Kaplan-Meier plot derived from the Monte Carlo simulation. The QALE gap was narrower (Table 3), but sensitivity analyses did not support RIC transplantation as a preferred option across the range of plausible state utilities for low/intermediate-1 MDS (0.54 to 0.94) versus the range of plausible state utilities after RIC transplantation (0.6 to 0.92; Fig 2B). Modeling a plateau of long-term post-transplantation survival or discounting future survival also did not change the conclusion (Table 3).
Table 3.
Markov Analysis: Transplantation and Nontransplantation Strategy Outcomes
| Variable | Early RIC Transplantation Survival (months) | Nontransplantation Survival (months) |
|---|---|---|
| Patients with low/intermediate-1 IPSS MDS* | ||
| LE | ||
| Base case | 38 | 77 |
| Modeling discounted survival | 35 | 68 |
| Modeling “plateau in RIC transplantation survival” | 48 | 77 |
| All RIC v BSC (time from MDS diagnosis) | 57 | 80 |
| All RIC v all nontransplantation therapies (time from MDS diagnosis) | 57 | 80 |
| RIC within 12 months v BSC (time from MDS diagnosis) | 49 | 80 |
| RIC within 12 months v all nontransplantation therapies (time from MDS diagnosis) | 49 | 80 |
| RIC within 12 months v ESA therapy (time from treatment) | 42 | 67 |
| QALE | ||
| Base case | 35 | 47 |
| Modeling discounted survival | 32 | 41 |
| Modeling “plateau in RIC transplantation survival” | 44 | 46 |
| Assuming worst QoL with HSCT (chronic GVHD) | 23 | — |
| Assuming best QoL with MDS (transfusion independent) | — | 65 |
| Patients with intermediate-2/high IPSS MDS† | ||
| LE | ||
| Base case | 36 | 28 |
| Modeling discounted survival | 32 | 27 |
| Modeling “plateau in RIC transplantation survival” | 38 | 28 |
| RIC within 12 months v hypomethylating agents (GFM/Nordic data set—time from treatment) | 36 | 28 |
| QALE | ||
| Base case | 33 | 15 |
| Modeling discounted survival | 30 | 14 |
| Modeling “plateau in RIC transplantation survival” | 35 | 15 |
| Assuming worst QoL with HSCT (chronic GVHD) | 22 | — |
| Assuming Best QoL with advanced MDS (estimated) | — | 21 |
NOTE. LE and QALE measured in months. The results in bold indicate the dominant strategy.
Abbreviations: BSC, best supportive care (International MDS Risk Analysis and University of Pavia data sets); ESA, erythropoiesis-stimulating agents (Nordic MDS and GFM data sets); GFM, Groupe Francophone des Myelodysplasies; GVHD, graft-versus-host disease; HSCT, allogeneic hematopoietic stem-cell transplantation; IPSS, International Prognostic Scoring System; LE, life expectancy; MDS, myelodysplastic syndromes; QALE, quality-adjusted life expectancy; QoL, quality of life; RIC, reduced-intensity conditioning.
Base case assumption for QALE model includes state utility of 0.92 for HSCT (QoL without chronic GVHD) and 0.6 for non-HSCT (transfusion-dependent MDS); sensitivity assuming state utility of 0.6 for HSCT = post-HSCT with chronic GVHD, and of 0.84 for non-HSCT = transfusion-independent MDS.
Base case assumption for QALE model includes state utility of 0.92 for HCT (QoL without chronic GVHD) and 0.53 for non-HSCT (advanced MDS); sensitivity assuming state utility of 0.6 for HSCT = post-HSCT with chronic GVHD, and of 0.73 for non-HSCT (estimated upper boundary for QoL with advanced MDS).
Fig 2.
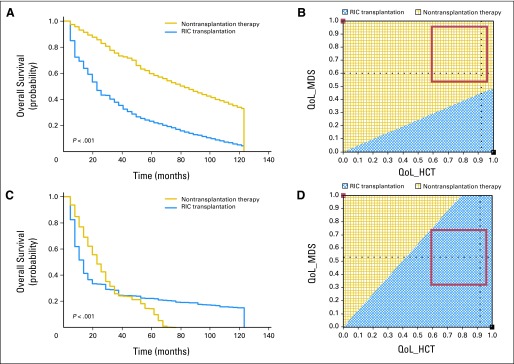
(A) Monte Carlo analysis for low/intermediate-1 International Prognostic Scoring System (IPSS) myelodysplastic syndromes (MDS). Simulated Kaplan-Meier survival plots (n = 10,000; with log-rank P value) are indicated for the modeled 10-year time period, comparing a strategy of early reduced-intensity conditioning (RIC) transplantation (blue line) versus no early RIC transplantation (gold line). The results graphically indicate survival benefit of the nontransplantation strategy in low/intermediate-1 IPSS MDS quality-adjusted life expectancy (QALE): two-way sensitivity analysis. Two-way sensitivity analysis plot for the utilities of the Markov states “alive after RIC transplantation” and “alive with MDS without RIC transplantation” is shown. The gold area indicates the range in which nontransplantation therapy produces superior QALE. The blue area indicates the range in which RIC transplantation produces superior QALE. The red square indicates the plausible range of quality of life (QoL) for “alive with low/intermediate-1 IPSS MDS” and for “alive after RIC transplantation” and does not cross the threshold line. This result is interpreted as insensitive, that is, the conclusion regarding benefit does not change within the plausible QoL range. (C) Monte Carlo analysis for intermediate-2/high IPSS MDS. Simulated Kaplan-Meier survival plots (n = 10,000; with log-rank P value) are indicated for the modeled 10-year time period, comparing a strategy of early RIC transplantation (blue line) versus no early RIC transplantation (gold line). The results graphically indicate survival benefit of the early RIC transplantation strategy in intermediate-2/high IPSS MDS. (D) Intermediate-2/high IPSS MDS QALE: two-way sensitivity analysis. Two-way sensitivity plot for the utilities of the Markov states “alive after RIC transplantation” and “alive with MDS without early RIC transplantation” is shown. The gold area indicates the range in which nontransplantation therapy produces superior QALE. The blue area indicates the range in which RIC transplantation produces superior QALE. The red square indicates the plausible range of QoL for “alive with intermediate-2/high IPSS MDS” and for “alive after RIC transplantation” and does not cross the threshold line. This result is interpreted as insensitive, that is, the conclusion regarding benefit does not change within the plausible QoL range. HCT, hematopoietic cell transplantation.
We considered the impact of survival from MDS diagnosis rather than treatment decision. We created separate models for survival time from diagnosis for the cohort of patients who underwent transplantation within 12 months of diagnosis, as well as for the total transplantation cohort. For the nontransplantation therapy cohorts, we considered separately the BSC data set (IMRAW, University of Pavia) and a data set of all nontransplantation therapies (BSC, ESA), both for time from diagnosis and from initiation of therapy (Table 3). Choosing survival from MDS diagnosis did not alter the conclusion of lack of transplantation benefit.
We further considered the comparability of the anemic and nonanemic low/intermediate-1 MDS cohorts to justify combining disparate nontransplantation therapies versus RIC transplantation. Overall survival was shorter for the ESA cohort (time from treatment) compared with the BSC cohort (time from diagnosis; log-rank P = .0034). However, when comparing survival from diagnosis, there was no difference (log-rank P = .61). We also separately assessed anemic/RBC transfusion-dependent low/intermediate-1 IPSS MDS in a model, because in clinical practice, this may provide a trigger for consideration of transplantation. RIC transplantation had an LE of 42 months versus 67 months for anemic patients on ESA therapy (Table 3). Life expectancy assessments for the additional analyses do not change the conclusions of the initial model.
For 223 patients with intermediate-2/high IPSS, early RIC transplantation had an LE of 36 months versus 28 months with nontransplantation therapy (Table 3). Figure 2C shows a Kaplan-Meier plot derived from the Monte Carlo simulation. QoL inclusion also indicated QALE benefit with early RIC transplantation (Table 3), and sensitivity analyses supported RIC transplantation as a preferred option across the range of plausible state utilities for patients with intermediate-2/high MDS receiving hypomethylating agent therapy (0.33 to 0.73) versus the range of plausible state utilities after RIC transplantation (0.6 to 0.92; Fig 2D). Explicitly modeling a plateau of long-term post-transplantation survival or discounting future survival also did not change the conclusion (Table 3).
We considered the impact of survival from MDS diagnosis rather than from treatment. We created separate models of survival from diagnosis for the cohort of patients who underwent transplantation within 12 months of diagnosis, as well as for the total transplantation cohort. For the nontransplantation cohorts, the MDACC and AZA-001 data sets had information on time from MDS diagnosis, whereas the GFM ATU data set did not. On comparing the groups, post-treatment survival for MDACC/AZA-001 and GFM-ATU was not different (P = .62; data not shown), supporting combining the groups in the initial model. Only one patient in the MDACC/AZA-001 data sets initiated hypomethylating agent therapy more than 12 months after diagnosis. For patients with intermediate-2/high IPSS MDS, time from diagnosis (> 12 v ≤ 12 months) did not affect the conclusion of transplantation benefit (Table 3).
DISCUSSION
MDS disproportionately affects individuals ≥ 60 years of age, but its prognosis remains variable and stratifiable by IPSS score at diagnosis.1 MDS therapies are also heterogeneous and stratified by IPSS risk. For instance, 2011 National Comprehensive Cancer Network guidelines distinguish treatment recommendations by risk categories of low/intermediate-1 and intermediate-2/high IPSS.21 In low/intermediate-1 IPSS MDS, therapeutic recommendations for the majority include BSC or ESA therapy. In intermediate-2/high IPSS MDS, the standard of care is hypomethylating agent therapy. MAC or RIC transplantation may be considered for patients with intermediate-2/high IPSS MDS who have an available donor.
Data are limited on RIC transplantation in MDS, a potentially curative—albeit potentially toxic—therapy in patients ≥ 60 years of age. Reports have documented the feasibility and lack of adverse impact of age of RIC transplantation for various hematologic malignancies including, but not specifically focusing on, MDS.41,52,53 There is an even greater paucity of data comparing RIC transplantation versus nontransplantation therapies in older patients with MDS. Randomized comparisons are unavailable.
Decision analysis is a statistical technique used to synthesize available information while allowing sensitivity analyses for plausible ranges of outcomes and QoL. For patients with de novo MDS aged 60 to 70 years with low/intermediate-1 IPSS, we document that RIC transplantation does not offer LE benefit. This conclusion was robust in multiple additional analyses including QoL adjustment and would only change if the QoL impairment of MDS was deemed severe (Fig 2B). Conversely, for intermediate-2/high IPSS, early RIC transplantation offers LE benefit. The benefit of RIC transplantation is due to a long-term plateau of survival in approximately 25% of patients despite higher early mortality (Fig 2C). QoL and other considerations did not change this conclusion.
One concern of this analysis is the comparability of the RIC transplantation and nontransplantation cohorts with regard to interval between MDS diagnosis and entry into the cohort (implying variable disease biology), patient performance status, and comorbidities. To allay these concerns, we conducted additional analyses. First, we did not identify any impact of difference in the interval from MDS diagnosis to treatment (stratified by < or ≥ 12 months), suggesting that time to MDS progression may not be a relevant to treatment decisions for patients in a particular IPSS risk category. This is consistent with data that IPSS risk at the time of MDS progression dynamically prognosticates for subsequent survival.17
Second, with regard to performance status and comorbidities (eg, organ dysfunction), we do not have such data available for the low/intermediate-1 IPSS nontransplantation cohorts. However, even if these patients were frailer or sicker and transplantation ineligible, their better life expectancy indicates that nontransplantation therapy is still superior. For similar reasons, incorporating time trend–adjusted survival for BSC recipients from an earlier period was not necessary. For the patients with intermediate-2/high IPSS MDS receiving hypomethylating agents, there is better information regarding comparability. Many were enrolled onto prospective clinical trials, indicating a degree of patient selection. Their treatment time period overlapped with the transplantation recipients. We also excluded patients with impaired performance status (ECOG PS > 2) and/or organ dysfunction (liver, kidney), as they would likely not have been transplantation candidates. Within the limits of retrospective database evaluation, the intermediate-2/high IPSS cohorts were comparable, and the results should not be dismissed on this basis. We also note that salvage treatments (eg, chemotherapy) are often administered before transplantation. Hence categorizing IPSS risk by pretransplantation score may underestimate the true MDS severity of both the lower and higher risk transplantation cohorts. If true, RIC transplantation outcomes for both low/intermediate-1 and intermediate-2/high IPSS may seem worse than they really are.
Finally, the accuracy of long-term survival modeling needs to be considered. Like prior reports, our analysis models 10-year LE and QALE, longer than the median follow-up period of the data sets.37,46 A 10-year time horizon assumes that all patients in both groups have no survival beyond 10 years, an assumption that penalizes the RIC transplantation strategy because it has more survivors when the model ends. Although our long-term modeling is conservative and seems appropriately derived directly from the slope of the terminal survival probability in each cohort, it does induce a likely bias against potentially curative RIC transplantation in data sets in which a long-term plateau in survival is anticipated but not fully captured within the follow-up period (eg, RIC transplantation in the low/intermediate-1 IPSS model; Fig 2A). However, explicitly modeling plateaus in long-term RIC transplantation survival did not change the conclusions (Table 3).
There are limitations to our analysis, including selection bias, which, although not an apparent confounder on additional analysis, can only be eliminated in a prospective randomized study. Furthermore, our information is limited, with clinically and biologically relevant data being often unavailable (eg, we could not unambiguously stratify all patients beyond low/intermediate-1 and intermediate-2/high IPSS risk cohorts). We could only identify 514 older patients with MDS with sufficient data for analysis. The results are applicable only to patients meeting criteria for our analysis (eg, de novo MDS; age 60 to 70 years; available HLA-matched donor). Additionally, newer MDS prognostic schemes and novel molecular markers may be better than the IPSS.14,16,54 However, clinical outcomes data for newer schemes are even more limited (eg, we could not incorporate IPSS-R or WPSS, despite their improved prognostic ability especially in lower-risk MDS, for which decision modeling suggests benefit for younger MAC transplantation recipients).55 Although for the future, prospective genetically based MDS risk stratification would be optimal, such data are in their infancy, and the available long-term clinical data based on the widely used and validated IPSS should not be lightly discarded.
In conclusion, we undertook decision modeling to quantify benefit of RIC transplantation versus nontransplantation therapies in patients with de novo MDS aged 60 to 70 years. We conclude that early RIC transplantation offers survival benefit for intermediate-2/high IPSS MDS, but not for low/intermediate-1 IPSS MDS. These simple but robust findings may help clinical decision making for the older patient with MDS.
Acknowledgment
We thank Minou Modabber and the Dana-Farber Medical Arts Core Facility for help with the figures.
Appendix
Supplementary Mathematical Information
Transition probabilities between Markov states were calculated from the underlying survival rate of the cohorts in the data sets using the expression: Rate_die_(×) = (−1/time_die_(×) * Ln (1 − pDie (×))). This rate was combined with the underlying US general population mortality rate according to age, sex, and race (ASR) and converted to probability by the following: pDeath_(×) = [ 1 – EXP (– (Rate_Die_ASR + Rate_Die_(×)))].
Fig A1.

Overall survival of nontransplantation cohorts stratified by low/intermediate (int) -1 and int-2/high International Prognostic Scoring System myelodysplastic syndromes.
Fig A2.

Overall survival of reduced-intensity conditioning transplantation cohorts stratified by low/intermediate (int) -1 and int-2/high International Prognostic Scoring System myelodysplastic syndromes.
Footnotes
J.K. is a Leukemia and Lymphoma Society Scholar in Clinical Research. C.C. is supported by the Stem Cell Cyclists of the Pan Mass Challenge.
Authors' disclosures of potential conflicts of interest and author contributions are found at the end of this article.
AUTHORS' DISCLOSURES OF POTENTIAL CONFLICTS OF INTEREST
Although all authors completed the disclosure declaration, the following author(s) and/or an author's immediate family member(s) indicated a financial or other interest that is relevant to the subject matter under consideration in this article. Certain relationships marked with a “U” are those for which no compensation was received; those relationships marked with a “C” were compensated. For a detailed description of the disclosure categories, or for more information about ASCO's conflict of interest policy, please refer to the Author Disclosure Declaration and the Disclosures of Potential Conflicts of Interest section in Information for Contributors.
Employment or Leadership Position: Robert Peter Gale, Celgene (C); C.L. Beach, Celgene (C) Consultant or Advisory Role: None Stock Ownership: C.L. Beach, Celgene Honoraria: None Research Funding: None Expert Testimony: None Patents: None Other Remuneration: None
AUTHOR CONTRIBUTIONS
Conception and design: John Koreth, Martin S. Tallman, John F. DiPersio, Donald Bunjes, Daniel J. Weisdorf, Corey Cutler
Provision of study materials or patients: Waleska S. Perez, H. Joachim Deeg, Guillermo Garcia-Manero, Luca Malcovati, Mario Cazzola, Sophie Park, Raphael Itzykson, Lionel Ades, Pierre Fenaux, Martin Jadersten, Robert Peter Gale, C.L. Beach, Peter L. Greenberg, Martin S. Tallman, John F. DiPersio, Donald Bunjes, Daniel J. Weisdorf
Collection and assembly of data: John Koreth, Joseph Pidala, Waleska S. Perez, H. Joachim Deeg, Guillermo Garcia-Manero, Luca Malcovati, Mario Cazzola, Sophie Park, Raphael Itzykson, Lionel Ades, Pierre Fenaux, Martin Jadersten, Eva Hellstrom-Lindberg, C.L. Beach, Mary M. Horowitz, Peter L. Greenberg, Corey Cutler
Data analysis and interpretation: John Koreth, Joseph Pidala, Pierre Fenaux, Eva Hellstrom-Lindberg, Robert Peter Gale, Stephanie J. Lee, Mary M. Horowitz, Daniel J. Weisdorf, Corey Cutler
Manuscript writing: All authors
Final approval of manuscript: All authors
REFERENCES
- 1.Greenberg P, Cox C, LeBeau MM, et al. International scoring system for evaluating prognosis in myelodysplastic syndromes. Blood. 1997;89:2079–2088. [Erratum: Blood 91:1100, 1998] [PubMed] [Google Scholar]
- 2.Rollison DE, Howlader N, Smith MT, et al. Epidemiology of myelodysplastic syndromes and chronic myeloproliferative disorders in the United States, 2001-2004, using data from the NAACCR and SEER programs. Blood. 2008;112:45–52. doi: 10.1182/blood-2008-01-134858. [DOI] [PubMed] [Google Scholar]
- 3.Bennett JM, Catovsky D, Daniel MT, et al. Proposals for the classification of the myelodysplastic syndromes. Br J Haematol. 1982;51:189–199. [PubMed] [Google Scholar]
- 4.Mufti GJ, Stevens JR, Oscier DG, et al. Myelodysplastic syndromes: A scoring system with prognostic significance. Br J Haematol. 1985;59:425–433. doi: 10.1111/j.1365-2141.1985.tb07329.x. [DOI] [PubMed] [Google Scholar]
- 5.Coiffier B, Adeleine P, Gentilhomme O, et al. Myelodysplastic syndromes: A multiparametric study of prognostic factors in 336 patients. Cancer. 1987;60:3029–3032. doi: 10.1002/1097-0142(19871215)60:12<3029::aid-cncr2820601229>3.0.co;2-4. [DOI] [PubMed] [Google Scholar]
- 6.Sanz GF, Sanz MA, Vallespí T, et al. Two regression models and a scoring system for predicting survival and planning treatment in myelodysplastic syndromes: A multivariate analysis of prognostic factors in 370 patients. Blood. 1989;74:395–408. [PubMed] [Google Scholar]
- 7.Aul C, Gattermann N, Heyll A, et al. Primary myelodysplastic syndromes: Analysis of prognostic factors in 235 patients and proposals for an improved scoring system. Leukemia. 1992;6:52–59. [PubMed] [Google Scholar]
- 8.Morel P, Hebbar M, Lai JL, et al. Cytogenetic analysis has strong independent prognostic value in de novo myelodysplastic syndromes and can be incorporated in a new scoring system: A report on 408 cases. Leukemia. 1993;7:1315–1323. [PubMed] [Google Scholar]
- 9.Maschek H, Gutzmer R, Choritz H, Georgii A. Life expectancy in primary myelodysplastic syndromes: A prognostic score based upon histopathology from bone marrow biopsies of 569 patients. Eur J Haematol. 1994;53:280–287. doi: 10.1111/j.1600-0609.1994.tb01320.x. [DOI] [PubMed] [Google Scholar]
- 10.Cunningham I, MacCallum SJ, Nicholls MD, et al. The myelodysplastic syndromes: An analysis of prognostic factors in 226 cases from a single institution. Br J Haematol. 1995;90:602–606. doi: 10.1111/j.1365-2141.1995.tb05590.x. [DOI] [PubMed] [Google Scholar]
- 11.Harris NL, Jaffe ES, Diebold J, et al. World Health Organization classification of neoplastic diseases of the hematopoietic and lymphoid tissues: Report of the Clinical Advisory Committee meeting-Airlie House, Virginia, November 1997. J Clin Oncol. 1999;17:3835–3849. doi: 10.1200/JCO.1999.17.12.3835. [DOI] [PubMed] [Google Scholar]
- 12.Balduini CL, Guarnone R, Pecci A, et al. International prognostic scoring system and other prognostic systems for myelodysplastic syndromes. Blood. 1997;90:4232–4234. [PubMed] [Google Scholar]
- 13.Estey E, Keating M, Pierce S, et al. Application of the International Scoring System for myelodysplasia to M.D. Anderson patients. Blood. 1997;90:2843–2846. [PubMed] [Google Scholar]
- 14.Greenberg PL, Tuechler H, Schanz J, et al. Revised international prognostic scoring system for myelodysplastic syndromes. Blood. 2012;120:2454–2465. doi: 10.1182/blood-2012-03-420489. [DOI] [PMC free article] [PubMed] [Google Scholar]
- 15.Cazzola M, Malcovati L. Myelodysplastic syndromes: Coping with ineffective hematopoiesis. N Engl J Med. 2005;352:536–538. doi: 10.1056/NEJMp048266. [DOI] [PubMed] [Google Scholar]
- 16.Malcovati L, Porta MG, Pascutto C, et al. Prognostic factors and life expectancy in myelodysplastic syndromes classified according to WHO criteria: A basis for clinical decision making. J Clin Oncol. 2005;23:7594–7603. doi: 10.1200/JCO.2005.01.7038. [DOI] [PubMed] [Google Scholar]
- 17.Malcovati L, Germing U, Kuendgen A, et al. Time-dependent prognostic scoring system for predicting survival and leukemic evolution in myelodysplastic syndromes. J Clin Oncol. 2007;25:3503–3510. doi: 10.1200/JCO.2006.08.5696. [DOI] [PubMed] [Google Scholar]
- 18.Nimer SD. Clinical management of myelodysplastic syndromes with interstitial deletion of chromosome 5q. J Clin Oncol. 2006;24:2576–2582. doi: 10.1200/JCO.2005.03.6715. [DOI] [PubMed] [Google Scholar]
- 19.Raza A, Reeves JA, Feldman EJ, et al. Phase 2 study of lenalidomide in transfusion-dependent, low-risk, and intermediate-1 risk myelodysplastic syndromes with karyotypes other than deletion 5q. Blood. 2008;111:86–93. doi: 10.1182/blood-2007-01-068833. [DOI] [PubMed] [Google Scholar]
- 20.Fenaux P, Giagounidis A, Selleslag D, et al. A randomized phase 3 study of lenalidomide versus placebo in RBC transfusion-dependent patients with Low-/Intermediate-1-risk myelodysplastic syndromes with del5q. Blood. 2011;118:3765–3776. doi: 10.1182/blood-2011-01-330126. [DOI] [PubMed] [Google Scholar]
- 21.Greenberg PL, Attar E, Bennett JM, et al. NCCN Clinical Practice Guidelines in Oncology: Myelodysplastic syndromes. J Natl Compr Canc Netw. 2011;9:30–56. doi: 10.6004/jnccn.2011.0005. [DOI] [PMC free article] [PubMed] [Google Scholar]
- 22.Park S, Grabar S, Kelaidi C, et al. Predictive factors of response and survival in myelodysplastic syndrome treated with erythropoietin and G-CSF: The GFM experience. Blood. 2008;111:574–582. doi: 10.1182/blood-2007-06-096370. [DOI] [PubMed] [Google Scholar]
- 23.Jädersten M, Malcovati L, Dybedal I, et al. Erythropoietin and granulocyte-colony stimulating factor treatment associated with improved survival in myelodysplastic syndrome. J Clin Oncol. 2008;26:3607–3613. doi: 10.1200/JCO.2007.15.4906. [DOI] [PubMed] [Google Scholar]
- 24.Silverman LR, McKenzie DR, Peterson BL, et al. Further analysis of trials with azacitidine in patients with myelodysplastic syndrome: Studies 8421, 8921, and 9221 by the Cancer and Leukemia Group B. J Clin Oncol. 2006;24:3895–3903. doi: 10.1200/JCO.2005.05.4346. [DOI] [PubMed] [Google Scholar]
- 25.Kantarjian H, Issa JP, Rosenfeld CS, et al. Decitabine improves patient outcomes in myelodysplastic syndromes: Results of a phase III randomized study. Cancer. 2006;106:1794–1803. doi: 10.1002/cncr.21792. [DOI] [PubMed] [Google Scholar]
- 26.Fenaux P, Mufti GJ, Santini V, et al. Azacitidine (AZA) treatment prolongs overall survival (OS) in higher-risk MDS patients compared with conventional care regimens (CCR): Results of the AZA-001 phase III study. Blood. 2007:110. (abstr 817) [Google Scholar]
- 27.Deeg HJ, Storer B, Slattery JT, et al. Conditioning with targeted busulfan and cyclophosphamide for hemopoietic stem cell transplantation from related and unrelated donors in patients with myelodysplastic syndrome. Blood. 2002;100:1201–1207. doi: 10.1182/blood-2002-02-0527. [DOI] [PubMed] [Google Scholar]
- 28.Anderson JE, Appelbaum FR, Schoch G, et al. Allogeneic marrow transplantation for myelodysplastic syndrome with advanced disease morphology: A phase II study of busulfan, cyclophosphamide, and total-body irradiation and analysis of prognostic factors. J Clin Oncol. 1996;14:220–226. doi: 10.1200/JCO.1996.14.1.220. [DOI] [PubMed] [Google Scholar]
- 29.Anderson JE, Appelbaum FR, Schoch G, et al. Allogeneic marrow transplantation for refractory anemia: A comparison of two preparative regimens and analysis of prognostic factors. Blood. 1996;87:51–58. [PubMed] [Google Scholar]
- 30.Arnold R, de Witte T, van Biezen A, et al. Unrelated bone marrow transplantation in patients with myelodysplastic syndromes and secondary acute myeloid leukemia: An EBMT survey—European Blood and Marrow Transplantation Group. Bone Marrow Transplant. 1998;21:1213–1216. doi: 10.1038/sj.bmt.1701269. [DOI] [PubMed] [Google Scholar]
- 31.Runde V, de Witte T, Arnold R, et al. Bone marrow transplantation from HLA-identical siblings as first-line treatment in patients with myelodysplastic syndromes: Early transplantation is associated with improved outcome—Chronic Leukemia Working Party of the European Group for Blood and Marrow Transplantation. Bone Marrow Transplant. 1998;21:255–261. doi: 10.1038/sj.bmt.1701084. [DOI] [PubMed] [Google Scholar]
- 32.de Witte T, Hermans J, Vossen J, et al. Haematopoietic stem cell transplantation for patients with myelo-dysplastic syndromes and secondary acute myeloid leukaemias: A report on behalf of the Chronic Leukaemia Working Party of the European Group for Blood and Marrow Transplantation (EBMT) Br J Haematol. 2000;110:620–630. doi: 10.1046/j.1365-2141.2000.02200.x. [DOI] [PubMed] [Google Scholar]
- 33.Sierra J, Pérez WS, Rozman C, et al. Bone marrow transplantation from HLA-identical siblings as treatment for myelodysplasia. Blood. 2002;100:1997–2004. [PubMed] [Google Scholar]
- 34.Castro-Malaspina H, Harris RE, Gajewski J, et al. Unrelated donor marrow transplantation for myelodysplastic syndromes: Outcome analysis in 510 transplants facilitated by the National Marrow Donor Program. Blood. 2002;99:1943–1951. doi: 10.1182/blood.v99.6.1943. [DOI] [PubMed] [Google Scholar]
- 35.Scott BL, Sandmaier BM, Storer B, et al. Myeloablative vs nonmyeloablative allogeneic transplantation for patients with myelodysplastic syndrome or acute myelogenous leukemia with multilineage dysplasia: A retrospective analysis. Leukemia. 2006;20:128–135. doi: 10.1038/sj.leu.2404010. [DOI] [PubMed] [Google Scholar]
- 36.Scott B, Deeg HJ. Hemopoietic cell transplantation as curative therapy of myelodysplastic syndromes and myeloproliferative disorders. Best Pract Res Clin Haematol. 2006;19:519–533. doi: 10.1016/j.beha.2005.07.009. [DOI] [PubMed] [Google Scholar]
- 37.Cutler CS, Lee SJ, Greenberg P, et al. A decision analysis of allogeneic bone marrow transplantation for the myelodysplastic syndromes: Delayed transplantation for low-risk myelodysplasia is associated with improved outcome. Blood. 2004;104:579–585. doi: 10.1182/blood-2004-01-0338. [DOI] [PubMed] [Google Scholar]
- 38.Alyea EP, Kim HT, Ho V, et al. Impact of conditioning regimen intensity on outcome of allogeneic hematopoietic cell transplantation for advanced acute myelogenous leukemia and myelodysplastic syndrome. Biol Blood Marrow Transplant. 2006;12:1047–1055. doi: 10.1016/j.bbmt.2006.06.003. [DOI] [PubMed] [Google Scholar]
- 39.Nakamura R, Rodriguez R, Palmer J, et al. Reduced-intensity conditioning for allogeneic hematopoietic stem cell transplantation with fludarabine and melphalan is associated with durable disease control in myelodysplastic syndrome. Bone Marrow Transplant. 2007;40:843–850. doi: 10.1038/sj.bmt.1705801. [DOI] [PubMed] [Google Scholar]
- 40.Feinstein LC, Sandmaier B. Nonmyeloablative transplantation. In: Soiffer R, editor. Stem Cell Transplantation for Hematologic Malignancies. Totowa, NJ: Humana Press; 2004. pp. 469–482. [Google Scholar]
- 41.Platzbecker U, Schetelig J, Finke J, et al. Allogeneic hematopoietic cell transplantation in patients aged 60-70 years with de novo high-risk myelodysplastic syndrome or secondary acute myelogenous leukemia: Comparison with patients lacking donors who received azacitidine. Biol Blood Marrow Transplant. 2012;18:1415–1421. doi: 10.1016/j.bbmt.2012.05.003. [DOI] [PMC free article] [PubMed] [Google Scholar]
- 42.Weinstein MC, Fineberg HV, Elstein AS, et al. Clinical Decision Analysis. Philadelphia, PA: Saunders; 1980. [Google Scholar]
- 43.Djulbegovic B, Hendler FJ, Hamm J, et al. Residual mediastinal mass after treatment of Hodgkin's disease: A decision analysis. Med Hypotheses. 1992;38:166–175. doi: 10.1016/0306-9877(92)90089-u. [DOI] [PubMed] [Google Scholar]
- 44.Lee SJ, Kuntz KM, Horowitz MM, et al. Unrelated donor bone marrow transplantation for chronic myelogenous leukemia: A decision analysis. Ann Intern Med. 1997;127:1080–1088. doi: 10.7326/0003-4819-127-12-199712150-00005. [DOI] [PubMed] [Google Scholar]
- 45.Ng AK, Weeks JC, Mauch PM, et al. Decision analysis on alternative treatment strategies for favorable-prognosis, early-stage Hodgkin's disease. J Clin Oncol. 1999;17:3577–3585. doi: 10.1200/JCO.1999.17.11.3577. [DOI] [PubMed] [Google Scholar]
- 46.Kurosawa S, Yamaguchi T, Miyawaki S, et al. A Markov decision analysis of allogeneic hematopoietic cell transplantation versus chemotherapy in patients with acute myeloid leukemia in first remission. Blood. 2011;117:2113–2120. doi: 10.1182/blood-2010-05-285502. [DOI] [PubMed] [Google Scholar]
- 47.Fenaux P, Mufti GJ, Hellstrom-Lindberg E, et al. Efficacy of azacitidine compared with that of conventional care regimens in the treatment of higher-risk myelodysplastic syndromes: A randomised, open-label, phase III study. Lancet Oncol. 2009;10:223–232. doi: 10.1016/S1470-2045(09)70003-8. [DOI] [PMC free article] [PubMed] [Google Scholar]
- 48.Itzykson R, Thépot S, Quesnel B, et al. Prognostic factors for response and overall survival in 282 patients with higher-risk myelodysplastic syndromes treated with azacitidine. Blood. 2011;117:403–411. doi: 10.1182/blood-2010-06-289280. [DOI] [PubMed] [Google Scholar]
- 49.Kantarjian HM, O'Brien S, Shan J, et al. Update of the decitabine experience in higher risk myelodysplastic syndrome and analysis of prognostic factors associated with outcome. Cancer. 2007;109:265–273. doi: 10.1002/cncr.22376. [DOI] [PubMed] [Google Scholar]
- 50.Pidala J, Anasetti C, Kharfan-Dabaja MA, et al. Decision analysis of peripheral blood versus bone marrow hematopoietic stem cells for allogeneic hematopoietic cell transplantation. Biol Blood Marrow Transplant. 2009;15:1415–1421. doi: 10.1016/j.bbmt.2009.07.009. [DOI] [PubMed] [Google Scholar]
- 51.Pan F, Peng S, Fleurence R, et al. Economic analysis of decitabine versus best supportive care in the treatment of intermediate- and high-risk myelodysplastic syndromes from a US payer perspective. Clin Ther. 2010;32:2444–2456. doi: 10.1016/j.clinthera.2010.12.003. [DOI] [PubMed] [Google Scholar]
- 52.McClune BL, Weisdorf DJ, Pedersen TL, et al. Effect of age on outcome of reduced-intensity hematopoietic cell transplantation for older patients with acute myeloid leukemia in first complete remission or with myelodysplastic syndrome. J Clin Oncol. 2010;28:1878–1887. doi: 10.1200/JCO.2009.25.4821. [DOI] [PMC free article] [PubMed] [Google Scholar]
- 53.Koreth J, Aldridge J, Kim HT, et al. Reduced-intensity conditioning hematopoietic stem cell transplantation in patients over 60 years: Hematologic malignancy outcomes are not impaired in advanced age. Biol Blood Marrow Transplant. 2010;16:792–800. doi: 10.1016/j.bbmt.2009.12.537. [DOI] [PMC free article] [PubMed] [Google Scholar]
- 54.Bejar R, Stevenson K, Abdel-Wahab O, et al. Clinical effect of point mutations in myelodysplastic syndromes. N Engl J Med. 2011;364:2496–2506. doi: 10.1056/NEJMoa1013343. [DOI] [PMC free article] [PubMed] [Google Scholar]
- 55.Alessandrino EP, Della Porta MG, Malcovati L, et al. Decision analysis of allogeneic stem cell transplantation in patients with myelodysplastic syndrome stratified according to the WHO classification-based prognostic scoring system (WPSS) Blood. 2011:118. doi: 10.1038/leu.2017.88. (abstr 116) [DOI] [PMC free article] [PubMed] [Google Scholar]