

Summary
When a visual stimulus suddenly appears, it captures attention, producing a transient improvement of performance on basic visual tasks. We investigate the effect of transient attention on stimulus representations in early visual areas using rapid event-related fMRI. Participants discriminated the orientation of one of two gratings preceded or followed by a non-predictive peripheral cue. Compared to control conditions, precueing the target location improved performance and produced a larger fMRI response in corresponding retinotopic areas. This enhancement progressively increased from striate to extrastriate areas. Control conditions indicated that the enhanced fMRI response was not due to sensory summation of cue and target signals. Thus, an uninformative precue increases both perceptual performance and the concomitant stimulus-evoked activity in early visual areas. These results provide evidence regarding the retinotopically specific neural correlate for the effects of transient attention on early vision.
Introduction
When something appears suddenly in our peripheral vision, we cannot help but notice it. That object momentarily seizes our attention, even when the low acuity of peripheral vision may prevent us from fully identifying it. This situation exemplifies the operation of an involuntary, stimulus-driven mechanism of attentional control. Together with the voluntary, goal-driven mechanism for deploying attention, the two mechanisms enable us to prioritize the processing of visual information in various tasks. They can do so covertly, viz., without eye movements, and they enable us to selectively attend and process a subset of the vast amount of information that impinges on our retina at any moment (Jonides, 1980; Nakayama and Mackeben, 1989; Yantis, 2000). In behavioral studies, the two attentional systems can be differentiated by their distinct temporal dynamics. Voluntary, goal-driven attention is slow and maintained over long periods of time, whereas involuntary, stimulus-driven attention is fast and decays quickly (Jonides, 1980; Nakayama and Mackeben, 1989; Yantis, 2000). Here, we refer to the two systems as sustained and transient attention, respectively. Both types of attention improve performance in a wide variety of tasks (e.g., Carrasco and McElree, 2001; Carrasco et al., 2000; Lee et al., 1999; Lu and Dosher, 1998).
Studies on brain mechanisms of attention have mostly examined sustained attention, and some of them have characterized its effects on stimulus processing in the visual cortex. For instance, in single-unit recording studies, researchers have learned that sustained attention can reduce external noise by reducing the influence of unattended stimuli (Luck et al., 1997; Moran and Desimone, 1985) and that it can also boost the signal by increasing the effective stimulus contrast (Martinez-Trujillo and Treue, 2002; Reynolds et al., 2000). Correspondingly, human electrophysiological studies have provided evidence that attention can increase sensory gain (Hillyard et al., 1998; Johannes et al., 1995), and neuroimaging studies have shown attentional modulation of neural activity in many visual areas (Kanwisher and Wojciulik, 2000; Kastner and Ungerleider, 2000), including primary visual cortex (Brefczynski and DeYoe, 1999; Gandhi et al., 1999; Martinez et al., 1999; Somers et al., 1999).
Compared to sustained attention, less is known about the neural mechanisms for transient attention and its effects on stimulus processing. In this study, we investigated the effects of transient attention on the neural activity evoked by a stimulus while observers performed a simple orientation discrimination task. Recent psychophysical studies have established that transient attention enhances early visual processes. For example, transient attention increases contrast sensitivity (Cameron et al., 2002; Carrasco et al., 2000, 2004a; Lu and Dosher, 1998; Solomon et al., 1997) and spatial resolution (Carrasco et al., 2002; Yeshurun and Carrasco, 1998) and speeds up information accrual (Carrasco and McElree, 2001; Carrasco et al., 2004b). Because these basic visual dimensions are computed in early visual cortex, these psychophysical results suggest that transient attention should enhance neural activity in early stages of visual processing. This hypothesis, although appealing, lacks direct physiological evidence. Here, we tested this hypothesis by measuring brain activity in early visual areas using fMRI in conjunction with a peripheral cueing paradigm to manipulate transient attention.
A number of previous human neuroimaging studies have examined the control mechanism of attentional capture in frontoparietal networks (reviewed in Corbetta and Shulman, 2002), but those studies have not addressed the effects of transient attention on the stimulus representations in the visual cortex. This is perhaps due to a potential measurement difficulty with the peripheral cueing paradigm used to manipulate transient attention. In this paradigm, a cue is briefly presented in the periphery and quickly followed by a stimulus nearby; the cue draws attention to the location of the upcoming stimulus. Because the spatiotemporal separation between the cue and stimulus is relatively small compared to the spatiotemporal resolution of imaging techniques, it is difficult to differentiate the sensory response to the cue and the attentional modulation of the stimulus-evoked response and thus to rule out an explanation based on sensory summation.
We circumvented this methodological limitation with two innovations in our experimental design, a spatial and a temporal manipulation that complement each other. First, to anatomically separate the cue and stimulus responses, we presented them above and below the horizontal meridian, respectively (Figure 1). This spatial arrangement exploited the fact that early retinotopic areas (V1, V2, and V3) form quadrant representations of the visual field (Horton and Hoyt, 1991) such that the cue and stimulus would activate the ventral and dorsal partition of the visual cortex, respectively. Because V1 has a contiguous hemifield representation, we conducted preliminary studies to determine the distance necessary to separate the cue and stimulus activity within V1. However, this spatial control is not effective for higher visual areas with a hemifield representation and larger receptive fields (e.g., V3a and hV4), which will likely give rise to overlapping activations of the cue and stimulus. Furthermore, given subthreshold activation as well as imperfect image coregistration and surface reconstruction, it may not be possible to completely isolate the cortical locations activated by the cue and stimulus even in the early retinotopic areas. Thus, in addition to the spatial control, we also manipulated a temporal feature: we used postcues in addition to precues (Figure 1, right panel). A postcue trial was identical to a precue trial, except that the temporal order of the cue and stimulus was reversed (see Experimental Procedures). Whereas this resulted in identical amount of visual stimulation, the postcue does not elicit transient attention. Because of the sluggishness of the hemodynamic response compared to the cue-stimulus interstimulus interval (ISI; 50 ms), a sensory response from a region that responded to both the cue and stimulus could not differentiate the order of the two. Thus, any differential effects between the precue and postcue conditions cannot be attributed to purely sensory summation of the hemodynamic response to the cue and stimulus and must represent attentional modulation.
Figure 1. Experimental Design.
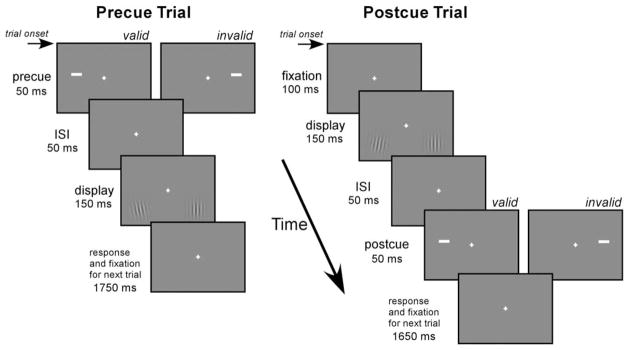
The sequence of events in the precue and postcue trials is illustrated. Note that the onset of the Gabor stimuli within a trial is identical for the precue and postcue trials; both are 100 ms after trial onset. For the purpose of illustration, the Gabor stimuli are shown at a contrast of 50%, and the tilted Gabor stimuli are oriented ±10°.
In the experiment, we presented two Gabor patches simultaneously in the periphery, one vertical and one tilted (Figure 1). Participants were asked to discriminate the orientation of the tilted Gabor (target); the vertical Gabor was a distracter. We used orientation discrimination to assess the effect of attention on stimulus contrast because performance on this task improves with increasing contrast (Cameron et al., 2002; Carrasco et al., 2000; Lu and Dosher, 1998; Nachmias, 1967), and because fMRI response increases monotonically with stimulus contrast (Boynton et al., 1999). Each Gabor display was either preceded (precue trial) or followed (postcue trial) by a cue that was either valid or invalid. The terms “valid” and “invalid” refer to whether the cue and target appeared on the same or on opposite sides, respectively. In fact, the cue was not predictive of the location of the target (50% validity), nor was it predictive of its orientation. Participants were explicitly told that the cue was completely uninformative regarding both target location and orientation and that there was no benefit whatsoever in using the cue to perform the task (Carrasco et al., 2004a; Gobell and Carrasco, 2005). The stimulus onset asynchrony between the pre-cue and stimulus was set at 100 ms, to maximize the effect of transient attention (Jonides, 1980; Nakayama and Mackeben, 1989). By minimizing the possible influence of voluntary, top-down control of attention, this procedure allowed us to isolate the effects of transient attention.
Based on psychophysical studies showing that transient attention increases contrast sensitivity (Cameron et al., 2002; Carrasco et al., 2000, 2004a; Lu and Dosher, 1998; Solomon et al., 1997) and on the findings that attention increases contrast gain (Cameron et al., 2002; Carrasco et al., 2004a; Martinez-Trujillo and Treue, 2002; Reynolds et al., 2000), together with the fact that the fMRI response increases with contrast (Boynton et al., 1999), we hypothesized that the uninformative valid precue would improve performance and increase the fMRI response.
Results
Behavior
Discrimination accuracy and reaction time (RT) were computed for each participant in each condition, and the group average is shown in Figure 3A. The valid pre-cue condition produced the highest accuracy [one-way repeated measures ANOVA; F(3, 15) = 9.2; p < 0.01]. Planned contrasts showed that the accuracy of valid precue condition was higher than that of the invalid precue [F(1, 5) = 9.53; p < 0.05], valid postcue [F(1, 5) = 19.67; p < 0.01], and invalid postcue [F(1, 5) = 45.19; p < 0.01] conditions; accuracy did not differ for these three conditions. Correspondingly, the valid precue also yielded the shortest RT [one-way repeated measures ANOVA; F(3, 15) = 51.04; p < 0.0001]. Planned contrasts showed that RT in the valid precue condition was faster than that in the invalid precue [F(1, 5) = 15.49; p < 0.05], which in turn was faster than that for the valid postcue [F(1, 5) = 18.03; p < 0.01], with the invalid postcue being the slowest [F(1, 5) = 8.29; p < 0.05]. This pattern of results indicates that there was no speed-accuracy tradeoff across different conditions.
Figure 3. Group-Averaged Data.

(A) Behavioral results. Proportion correct (left) and reaction time (right) are shown for the four cue conditions (V-Pre, valid precue; I-Pre, invalid precue; V-Post, valid postcue; I-Post, invalid postcue). Error bars are 1 SEM.
(B) Imaging results. Mean fMRI responses across participants for each cue condition and distracter are shown for each visual area. Response was obtained from the dorsal (V1, V2, V3, and V3a) and ventral (hV4) representations of the target (the green areas in Figure 2). The average standard error of all time points along a curve is shown as the error bar on the first time point.
Imaging
Previous to each experimental session, we localized cortical regions responding to the target stimuli and performed region of interest (ROI) analyses on the fMRI signal in early visual areas V1, V2, V3, V3a, and hV4. Representative results from the localizer scan are shown in Figure 2 on an inflated right hemisphere. The blue and green maps depict activations for the cue and the Gabor stimulus, respectively. Consistent with the known retinotopic organization of early visual areas, the cue and the Gabor stimulus largely activated ventral and dorsal regions of visual cortex, respectively. The separation between cue and Gabor activity was evident in V1, even though the dorsal and ventral representations are contiguous in that area. Activations for the cue and the Gabor remained separate in dorsal V2 and V3, whereas they started to overlap in higher areas such as V3a and hV4, which was expected, as these areas contain a hemifield representation (Tootell et al., 1997; Wade et al., 2002).
Figure 2. Representative Results from the Localizer Scans.

The diagram on the left illustrates the locations of the cue and the Gabor stimulus, which were presented in alternating blocks. Shown on the right are results from the right hemisphere of one participant, viewed on inflated surface representation of the posterior occipital cortex. Light and dark gray depict gyral and sulcal surfaces, respectively. Brain activity associated with the cue and brain activity associated with the Gabor stimulus are shown in blue and green maps, respectively. Black lines indicate the borders of early visual areas defined by the retinotopic mapping procedure (solid line, vertical meridian; dashed line, horizontal meridian). These borders were derived by using a wedge stimulus encompassing 0.25°–8.25° eccentricity, and the Gabor stimulus covered 4°–8° eccentricity. The asterisk indicates the foveal confluence where borders between areas cannot be resolved. At this statistical threshold (p < 0.001, uncorrected for multiple comparisons), the activation of the cue and the Gabor did not overlap in V1, V2, and V3. Activity started to overlap in V3a and hV4, as they contain a hemifield representation (Tootell et al., 1997; Wade et al., 2002).
The group-averaged estimates of the fMRI response for contralateral targets and distracters are shown in Figure 3B. A given trial always contained one target (tilted Gabor) and one distracter (vertical Gabor) in opposite hemifields. The fMRI response was estimated by a deconvolution procedure without assuming a canonical hemodynamic response function (Dale, 1999). All responses were similar in shape with a peak at the third time point (4–6 s). The activity level of different conditions did not differ significantly in V1, whereas activity for the valid precue condition was higher than that for the other conditions in extrastriate visual areas. The same pattern of results was evident in individual participant data. Figure 4 shows behavioral and imaging data from two participants, an experienced psychophysical observer (FP) and a naive observer (KM).
Figure 4. Individual Data.

Representative data from two individual participants—a trained psychophysical observer (FP) and a naive observer (KM). For each participant, the top row shows behavioral results, and the middle and bottom rows show imaging results for different visual areas. (For details, see the legend of Figure 3.)
To further evaluate the differences among conditions, activity at time point 3 was taken as an index of the response amplitude, and the values are plotted in Figure 5. For each visual area, a one-way repeated measures ANOVA was performed with cue condition as a factor (valid precue, invalid precue, valid postcue, and invalid postcue). Including the distracter data in the analyses did not change the results. The effect of cue condition showed a trend of marginal significance in V1 [F(3, 15) = 2.66; p = 0.086] and significant effects in V2 [F(3, 15) = 5.18; p < 0.05], V3 [F(3, 15) = 6.39; p < 0.01], V3a [F(3, 15) = 18.22; p < 0.001], and hV4 [F(3, 15) = 19.37; p < 0.001].
Figure 5. Peak fMRI Response.

Peak amplitude of the fMRI response for different trial types in all visual areas (legends identical to Figure 3). Error bars are 1 SEM.
In V1, planned contrasts showed that the peak activity of the valid precue condition was not different from that of the other three conditions (p > 0.05 for all). In V2, peak activity of the valid precue condition was significantly greater than that of the invalid precue [F(1, 5) = 7.09; p < 0.05] and invalid postcue [F(1, 5) = 7.47; p < 0.05], and marginally greater than that of the valid post-cue [F(1, 5) = 5.10; p = 0.07]. The differences between the valid precue and the other three conditions—invalid precue, valid postcue, and invalid postcue—were all significant in V3 (F > 10.21, p < 0.05 for all), V3a (F > 33.94, p < 0.01 for all), and hV4 (F > 21.36, p < 0.01 for all). To test for the possible effect of sensory summation of the cue and target, we compared valid postcue versus invalid precue or versus invalid postcue conditions. The first comparison yielded no significant effect in any visual area, whereas the second comparison revealed a higher response to the valid postcue than to the invalid postcue in areas V3a [F(1, 5) = 8.08; p < 0.05] and hV4 [F(1, 5) = 8.27; p < 0.05], areas in which the cue and target produced overlapping activation.
To further quantify the effect of transient attention, we calculated an attention modulation index (AMI; see Experimental Procedures), similar to that used in single-unit physiology (Treue and Maunsell, 1996). A large attentional effect leads to an AMI value close to 1, and a small effect leads to an AMI value close to 0. The mean AMI values are shown in Figure 6. The AMI increased gradually from V1 to extrastriate visual areas. A significant effect of visual area was observed in a one-way repeated measures ANOVA [F(4, 20) = 9.75; p < 0.001]. The increase in AMI exhibited a significant linear trend [F(1, 5) = 41.62; p < 0.01] but no higher-order trends (p > 0.2 for all).
Figure 6. Magnitude of Attentional Effect.
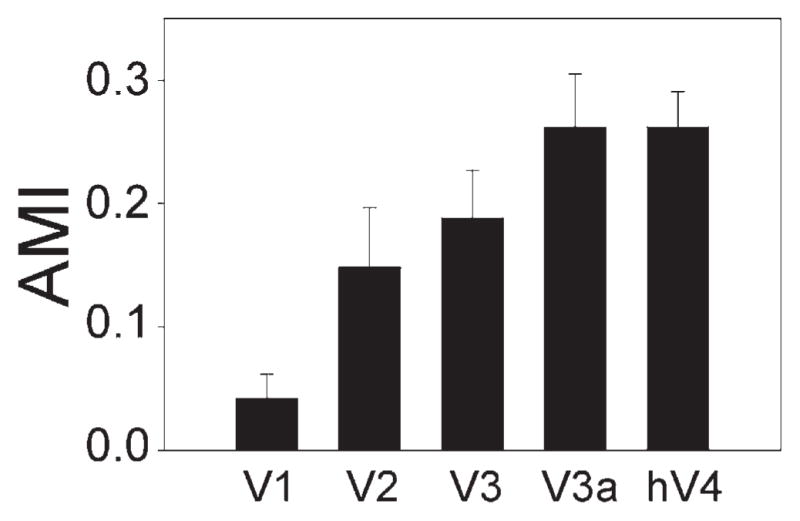
Mean attention modulation index (AMI) across participants for different visual areas [AMI = (Peakvalid precue − Peakbaseline)/(Peakvalid precue + Peakbaseline), where Peakbaseline = average of the peak amplitude for the invalid precue, valid postcue, and invalid postcue conditions]. Error bars are 1 SEM.
Discussion
We found that an uninformative peripheral precue improved discrimination performance. The cues contained no information: they were not indicative of the location or the orientation of the target Gabor, and participants knew this. Because there was neither a benefit nor an incentive for participants to use the cues to direct their voluntary attention, and the timing between the cue and the stimulus was not long enough for the deployment of sustained attention, the top-down component in the task was minimized, which allowed us to isolate the operation of bottom-up transient attention. The enhanced performance associated with the valid precue are consistent with the idea that the precue captured attention in an automatic, stimulus-driven fashion. Similar results have been found for contrast appearance (Carrasco et al., 2004a), for contrast sensitivity (Pestilli and Carrasco, 2005), for accuracy and temporal dynamics of visual search (A.M. Giordano et al., 2004, J. Vis., abstract), and for accuracy of letter identification (Luck and Thomas, 1999).
Our results show that transient attention increases neural activity at the retinotopic locations of the subsequent target stimulus. The spatial and temporal parameters used enabled us to rule out a pure sensory explanation of this effect. The cue and target were presented above and below the horizontal meridian, respectively, so that their corresponding cortical locations in early visual areas mapped to the ventral and dorsal portions of the contralateral hemisphere, providing a spatial separation of the cue and target activity. In addition, we took advantage of the sluggishness of the hemodynamic response and evaluated the effect of postcue trials to control for the sensory effect of the cue. If a mere summation of the sensory response of the cue and target was responsible for the differences among the experimental conditions, we should have observed similar levels of fMRI response for the precue and post-cue trials. The finding that activity was higher for the valid precue than for the valid postcue conditions allows us to rule out the possibility that the enhanced fMRI signal was due to low-level sensory effects of the cue.
The temporal control afforded by the postcue is especially important for higher visual areas V3a and hV4, where the cue and Gabor stimuli activate overlapping areas, due to their large receptive fields and hemifield representations (Figure 2; see Tootell et al., 1997; Wade et al., 2002). Consequently, it is not surprising that the cue contributed to the greater response in the valid postcue than in the invalid pre- and postcue conditions. Critically, however, the response in these areas was significantly larger for the valid precue than for the valid postcue condition. This difference suggests that the modulation of the target induced by the valid precue goes beyond sensory summation and can be unequivocally attributed to attention.
The enhancement in fMRI signal with transient attention is consistent with behavioral and neurophysiological data suggesting that attention effectively increases stimulus contrast (Cameron et al., 2002; Carrasco et al., 2000, 2004a; Johannes et al., 1995; Lee et al., 1999; Lu and Dosher, 1998; Martinez-Trujillo and Treue, 2002; Reynolds et al., 2000). The present results also lend support to the mechanism of signal enhancement, which proposes that attention improves the quality of the stimulus representation (Carrasco et al., 2000, 2002, 2004a; Lu and Dosher, 1998).
In a human ERP study that examined the effect of nonpredictive transient cues in a size discrimination task, a faster RT and larger occipital P1 component were observed for the valid than for the invalid cue (Hopfinger and Mangun, 1998, 2001; see also Handy et al., 2003; McDonald and Ward, 2000 for related results). Given that previous studies have localized the source of the P1 component in extrastriate cortex (Di Russo et al., 2002, 2003; Heinze et al., 1994), these ERP results suggest an extrastriate involvement in transient attention. A recent fMRI study using rapid serial visual presentation (RSVP) shows that a peripheral stimulus captures attention and also produces elevated response in visual cortex compared to a noncapturing stimulus (Serences et al., 2005). Note that this observed increase in cortical activation, which was reported as a whole rather than for different visual areas, was in response to the cue rather than to the stimuli for which the behavioral response was made; participants performed a detection task in the central stream. In contrast, the present study provides both behavioral and imaging measures of the processing of a visual stimulus adjacent to a transient cue. With the aid of retinotopic mapping and surface-based analysis techniques, our results directly reveal that transient attention had a more pronounced effect in extrastriate than in striate areas. These effects likely underlie the enhanced contrast sensitivity reported here and in other previous studies (Cameron et al., 2002; Carrasco et al., 2000, 2004a; Lu and Dosher, 1998; Solomon et al., 1997). Our results provide a retinotopically specific neural correlate for the effects of transient attention on early vision with a concomitant behavioral effect.
The attentional effect increased along the hierarchy of visual areas: V1, V2, V3, V3a, hV4 (Figures 5 and 6). We observed only a marginal trend in V1, whereas attentional effects in extrastriate visual areas were significant and increasingly more pronounced. Larger attentional effects in higher visual areas have also been found in studies of sustained attention (e.g., Kastner et al., 1999; Maunsell and Cook, 2002). Such a pattern is consistent with top-down modulation from frontal and parietal areas feeding back to visual cortex, with diminishing effects in earlier visual areas. However, the attentional gradient could also be due to a feed-forward mechanism in which attentional modulation accumulates across sequential levels of processing. Whereas it has been established that sustained attention—a conceptually driven mechanism—is mediated by a feedback mechanism (Corbetta and Shulman, 2002; Desimone and Duncan, 1995; Kanwisher and Wojciulik, 2000; Kastner and Ungerleider, 2000; Schroeder et al., 2001), a feed-forward model seems more likely in the case of transient attention—a stimulus-driven mechanism. Such a feed-forward model could be implemented by steeper contrast response functions in extrastriate than in striate areas. This higher sensitivity in extrastriate areas is due to areal summation across progressively larger receptive fields in higher areas (Sclar et al., 1990). Given that attention can boost the signal by increasing the effective stimulus contrast (Martinez-Trujillo and Treue, 2002; Reynolds et al., 2000) via contrast gain (Cameron et al., 2002; Carrasco et al., 2004a; Martinez-Trujillo and Treue, 2002; Reynolds et al., 2000), its effect would be more pronounced in areas with steeper contrast response functions.
Previous fMRI studies have shown increased V1 activity under sustained attention (Brefczynski and De-Yoe, 1999; Gandhi et al., 1999; Martinez et al., 1999; Somers et al., 1999). These attentional effects in V1 have been explained as delayed reentrant feedback from extrastriate areas, since there is no attentional modulation of an early C1 component localized in striate cortex (Martinez et al., 1999). More recent studies support this hypothesis by localizing a delayed increase in ERP (Di Russo et al., 2003) and MEG (Noesselt et al., 2002) signals with sustained attention in V1.
Because transient attention enhances low-level visual processing such as contrast sensitivity, one might expect that V1, the first stage of cortical computation, is also modulated by transient attention. However, we did not find a significant V1 attentional effect in the present study. There are at least three possible reasons for such an outcome. First, the V1 effect might be more variable and too small to detect (see also Kastner et al., 1999). The marginal trend in V1 might become significant with more statistical power. Second, the effects of sustained and transient attention on early visual areas might be intrinsically different. For example, more feedback signal from extrastriate areas might reach V1 under sustained attention than under transient attention, especially if a feed-forward mechanism underlies the effect of transient attention, as discussed above. Third, previous fMRI results with sustained attention might be partly caused by baseline increases in neural activity (Martinez et al., 1999), whereas baseline shift was unlikely in the present study because participants did not maintain attention to a particular location. Baseline increases with sustained attention have been reported in the absence of visual stimulation in both single-unit (Luck et al., 1997) and fMRI (Kastner et al., 1999; Ress et al., 2000) studies. Future studies are needed to evaluate these possibilities.
To conclude, we demonstrated that a nonpredictive peripheral cue increased both behavioral performance and retinotopic-specific neural response to a subsequent stimulus. The increased fMRI response in visual cortex brought about by transient attention provides the neural correlate of enhanced behavioral performance in an early visual task—enhanced contrast sensitivity in orientation discrimination. Previous research in single-unit physiology (Martinez-Trujillo and Treue, 2002; Reynolds et al., 2000) and human psychophysics (Cameron et al., 2002; Carrasco et al., 2000, 2004a; Lee et al., 1999; Lu and Dosher, 1998; Solomon et al., 1997) indicates that covert attention increases contrast sensitivity. By supplying evidence from an intermediate scale of analysis—neuroimaging—this study bridges the gap between single-unit physiology and human psychophysics of attention.
Experimental Procedures
Participants
Six graduate and undergraduate students (ages 22–29; four women) participated in the experiment, all with normal or corrected-to-normal vision. Three were trained psychophysical observers, and three were naive observers. All participants gave written informed consent in compliance with the protocol approved by the Institutional Review Board at New York University.
Cueing Experiment: Stimuli and Task
Visual stimuli were presented on a flat-panel display (NEC, MultiSync LCD 2110) housed in a Faraday box with an electrically conductive glass front, positioned at the rear of the scanner bore. Participants viewed the display through an angled mirror attached to the head coil, and a bite bar was used to stabilize their heads. Stimuli were generated on a Macintosh G4 computer using Matlab (MathWorks, Natick, MA) and the Psychophysics Toolbox (Brainard, 1997; Pelli, 1997). Background luminance was set to 25 cd/m2.
The cue consisted of a single white rectangle (width, 1°; height, 0.15°; luminance, 129 cd/m2), and the stimuli consisted of two Gabors (Gaussian-windowed sinusoidal gratings) with a space constant of 1°. Each Gabor contained a compound grating of 2 and 6 cycles/degree (cpd), at 5% contrast. A white fixation cross (0.3°) was present at the center of the screen throughout the experiment. There were two possible cue locations at 5.5° eccentricity (0.6° azimuth), to the left and right of the fixation cross. The two possible locations for the Gabors were at 6° of eccentricity (−2.5° azimuth). The cue and Gabor locations on the same side of the fixation were thus vertically aligned; the former was above and the latter was below the horizontal meridian (see Figure 2).
A single trial lasted 2 s and is illustrated in Figure 1. For the precue trials (Figure 1, left panel), a cue was shown for 50 ms, randomly either in the left or right location. After a 50 ms ISI, two Gabors were shown for 150 ms, followed by a 1750 ms response interval. One of the Gabors was oriented vertically, and the other was slightly tilted, either in the clockwise or counterclockwise direction. The postcue trials were identical to the precue trials except that the order of the cue and Gabors was reversed (Figure 1, right panel). To match the within-trial temporal onset of the Gabors between the two trial types, a 100 ms blank interval was inserted at the beginning of the postcue trials. The response interval was correspondingly reduced by 100 ms, to 1650 ms.
The participant’s task was to detect the tilted Gabor (target) and report its orientation, by pressing one of two keys on a MR-compatible response box. Participants were instructed to maintain fixation and respond as accurately and quickly as possible. Eye movements were not monitored, because the time between cue onset and target offset was only 250 ms, which prevents goal-directed saccades (Mayfrank et al., 1987). Even if such eye movements had occurred after stimulus offset, they could not have underlain the pattern of results. At that point, the fixation cross was presented alone, which would only weakly activate visual cortex, and most likely outside the predefined ROIs. Moreover, because the cue was uninformative (see below), participants had no incentive to make saccades to the cued location; thus any eye movement would have influenced different cue conditions similarly.
All participants received 1–2 hr of practice on the task outside the scanner. During the practice, we estimated the amount of tilt for each individual participant such that accuracy on the orientation discrimination task was in an intermediate range (around 75%). The degree of tilt was also adjusted between runs during the scan if accuracy was approaching floor or ceiling levels. The adjustment of the tilt ranged between 1.5° and 4° in 0.5° increments. The location of the cue as well as the location and orientation of the target Gabor were randomly assigned for each trial. In other words, the cue was not informative about either the location or the orientation of the target. Participants were informed of this arrangement and were told that there was no benefit in using the cue to perform the task. Even though the cue was not predictive, for the ease of exposition and terminological consistency, we use the terms “valid” and “invalid” to refer to cues that were presented on the same side and opposite side of the target, respectively.
There were four cue types: valid precue, invalid precue, valid postcue, and invalid postcue. Because the target could appear either in the left or the right visual field, there were eight trial types, produced by the combination of four cue types and two target locations. Each run in the scanner contained 16 trials of each type, plus 64 null (blank) trials in a random sequence. The blank trials provided temporal jitter and a baseline for estimating the hemodynamic response. Fixation periods of 4 and 12 s were also inserted into the beginning and the end of a run, respectively. The total time of a single run was thus 400 s. Five participants completed 14 runs in two sessions, and one participant completed seven runs in one session (due to technical difficulty, we could not obtain additional data from her). The pattern of results was the same whether her data were included or not.
Localizer and Retinotopic Mapping
We defined the cortical representation of the Gabor stimuli and the cues using a block design. For the cue blocks, cue stimuli that were identical to those in the main experiment were flashed (on/off) at 2 Hz at the two cue locations. The Gabor stimuli were of the same size, spatial frequency, and location as those in the main experiment, but they were at full contrast and their orientations were either 45° or −45° off vertical. During the Gabor blocks, the two orthogonal Gabor stimuli were flashed alternatively at 2 Hz. This was done to maximize the activation of the Gabor stimuli, which defined the ROI for the cueing experiment. The cue and Gabor blocks were 12 s long, and they were presented in alternation with 12 s blank periods in between. A localizer run contained 12 stimulation blocks (six blocks each for the cues and Gabors). Participants completed two localizer runs in each scanning session. They were instructed to fixate a cross (0.3°) that was present at the center of the screen throughout a run.
Retinotopic mapping procedures followed well-established methods using phase-encoded stimuli (DeYoe et al., 1996; Engel et al., 1997; Sereno et al., 1995). Phase maps of polar angle were obtained by using a rotating double-wedge checkerboard (Slotnick and Yantis, 2003), and borders of early visual areas were drawn along the phase reversals on inflated surface representations of the brain. There is controversy regarding the definition and nomenclature of visual areas beyond ventral V3 (for a review, see Wandell et al., 2005). We adopted hV4 as defined by Wade et al. (2002), which contains a hemifield representation.
Magnetic Resonance Imaging Procedure
Imaging was conducted on a 3T Siemens Allegra head-only scanner (Erlangen, Germany). High-resolution anatomic images were obtained for each participant using a T1-weighted magnetization-prepared rapid gradient echo (MPRAGE) sequence (FOV = 256 × 256 mm; 176 sagittal slices; 1 × 1 × 1 mm voxels). Functional images were collected using a receive-only surface coil array (Nova Medical, Wilmington, MA) with a T2*-weighted echo-planar imaging sequence (TR = 2000 ms; TE = 30 ms; flip angle = 90°). One volume contained 21 slices positioned perpendicular to the calcarine sulcus and covered the occipital and posterior parietal lobes (FOV = 192 × 192 mm; resolution = 3 × 3 × 3 mm; no gap). In each session, we also acquired T1-weighted anatomic images in the same slices as the functional images (spin echo; TR = 600 ms; TE = 9.1 ms; flip angle = 90°; resolution = 1.5 × 1.5 × 3 mm). The in-plane images were used to align functional images from different sessions to the same high-resolution anatomic volume for each participant.
fMRI Data Analysis
Imaging data were analyzed using BrainVoyager (Brain Innovation, Maastricht, the Netherlands) and custom software written in Matlab. Each participant’s high-resolution anatomic volume was transformed into Talairach space (Talairach and Tournoux, 1988), after which an automated segmentation procedure was applied to obtain a surface reconstruction of the white-gray matter boundary. The surface was further inflated to reveal the sulci/gyri pattern. All analyses were performed on this inflated representation of the cortical sheet. Preprocessing of functional data included slice time correction, motion correction, linear trend removal, and temporal high-pass filtering (three cycles per scan) to remove slow drifts in the fMRI signal. Given the block design, no slice time correction was applied to data from the localizer scan. The 2D functional data were then aligned with the high-resolution anatomic volume and transformed into 3D data in the Talairach space with 3 × 3 × 3 mm resolution. Images were not spatially smoothed.
For each participant, ROIs were defined using data from her/his localizer scans. The localizer data were analyzed by constructing a general linear model in which blocks of visual stimulation were modeled with delayed γ functions convolved with boxcar functions. Linear contrasts between the stimulation blocks and fixation blocks yielded activated voxels for the cues and Gabors. Statistical threshold was set at p < 0.001 (uncorrected for multiple comparisons). The activation was then projected onto the inflated surface of the brain and superimposed with borders of visual areas derived from retinotopic mapping. The resulting map defined cortical ROIs for the Gabor stimuli in early visual areas V1, V2, V3, V3a, and hV4 (see Figure 2).
MR time series in the cueing experiment were extracted from the localizer-defined ROIs and then concatenated. A deconvolution analysis was applied without assuming the shape of the hemodynamic response function (e.g., Dale, 1999). Eight time points (0–16 s) following each event were estimated and corrected for serial autocorrelation. There were five event types for each ROI: valid precue, invalid precue, valid postcue, invalid postcue, and distracter (present on every trial). Only events from the contralateral hemifield were entered into the design matrix for a given ROI. Estimates of the fMRI response were then collapsed across hemispheres for each participant, as no differences were found between the two hemispheres. Finally, response estimates for each condition were averaged across participants. Activity at time point 3 (4–6 s) was taken as the peak amplitude of the response. To quantify the magnitude of attentional effects in different ROIs, an AMI was calculated as (Peakvalid precue − Peakbaseline)/(Peakvalid precue + Peakbaseline), where Peakbaseline was defined as the average of the peak amplitude for the invalid precue, valid postcue, and invalid postcue conditions. Defining Peakbaseline as the peak response in the individual conditions (invalid precue, valid postcue, or invalid postcue) yielded similar results.
Acknowledgments
This work was supported by a grant from the National Science Foundation (BCS-9910734) and a Guggenheim fellowship to M.C., and a grant from the Beatrice and Samuel A. Seaver Foundation to New York University. We thank C. Curtis, D.J. Heeger, L.T. Maloney, B. McElree, D. Pelli, E. Phelps, and the members of the Carrasco lab for their helpful comments.
References
- Boynton GM, Demb JB, Glover GH, Heeger DJ. Neuronal basis of contrast discrimination. Vision Res. 1999;39:257–269. doi: 10.1016/s0042-6989(98)00113-8. [DOI] [PubMed] [Google Scholar]
- Brainard DH. The psychophysics toolbox. Spat Vis. 1997;10:433–436. [PubMed] [Google Scholar]
- Brefczynski JA, DeYoe EA. A physiological correlate of the ‘spotlight’ of visual attention. Nat Neurosci. 1999;2:370–374. doi: 10.1038/7280. [DOI] [PubMed] [Google Scholar]
- Cameron EL, Tai JC, Carrasco M. Covert attention affects the psychometric function of contrast sensitivity. Vision Res. 2002;42:949–967. doi: 10.1016/s0042-6989(02)00039-1. [DOI] [PubMed] [Google Scholar]
- Carrasco M, McElree B. Covert attention accelerates the rate of visual information processing. Proc Natl Acad Sci USA. 2001;98:5363–5367. doi: 10.1073/pnas.081074098. [DOI] [PMC free article] [PubMed] [Google Scholar]
- Carrasco M, Penpeci-Talgar C, Eckstein M. Spatial covert attention increases contrast sensitivity across the CSF: support for signal enhancement. Vision Res. 2000;40:1203–1215. doi: 10.1016/s0042-6989(00)00024-9. [DOI] [PMC free article] [PubMed] [Google Scholar]
- Carrasco M, Williams PE, Yeshurun Y. Covert attention increases spatial resolution with or without masks: support for signal enhancement. J Vis. 2002;2:467–479. doi: 10.1167/2.6.4. [DOI] [PubMed] [Google Scholar]
- Carrasco M, Ling S, Read S. Attention alters appearance. Nat Neurosci. 2004a;7:308–313. doi: 10.1038/nn1194. [DOI] [PMC free article] [PubMed] [Google Scholar]
- Carrasco M, Giordano AM, McElree B. Temporal performance fields: visual and attentional factors. Vision Res. 2004b;44:1351–1365. doi: 10.1016/j.visres.2003.11.026. [DOI] [PubMed] [Google Scholar]
- Corbetta M, Shulman GL. Control of goal-directed and stimulus-driven attention in the brain. Nat Rev Neurosci. 2002;3:201–215. doi: 10.1038/nrn755. [DOI] [PubMed] [Google Scholar]
- Dale AM. Optimal experimental design for event-related fMRI. Hum Brain Mapp. 1999;8:109–114. doi: 10.1002/(SICI)1097-0193(1999)8:2/3<109::AID-HBM7>3.0.CO;2-W. [DOI] [PMC free article] [PubMed] [Google Scholar]
- Desimone R, Duncan J. Neural mechanisms of selective visual attention. Annu Rev Neurosci. 1995;18:193–222. doi: 10.1146/annurev.ne.18.030195.001205. [DOI] [PubMed] [Google Scholar]
- DeYoe EA, Carman GJ, Bandettini P, Glickman S, Wieser J, Cox R, Miller D, Neitz J. Mapping striate and extrastriate visual areas in human cerebral cortex. Proc Natl Acad Sci USA. 1996;93:2382–2386. doi: 10.1073/pnas.93.6.2382. [DOI] [PMC free article] [PubMed] [Google Scholar]
- Di Russo F, Martinez A, Sereno MI, Pitzalis S, Hillyard SA. Cortical sources of the early components of the visual evoked potential. Hum Brain Mapp. 2002;15:95–111. doi: 10.1002/hbm.10010. [DOI] [PMC free article] [PubMed] [Google Scholar]
- Di Russo F, Martinez A, Hillyard SA. Source analysis of event-related cortical activity during visuo-spatial attention. Cereb Cortex. 2003;13:486–499. doi: 10.1093/cercor/13.5.486. [DOI] [PubMed] [Google Scholar]
- Engel SA, Glover GH, Wandell BA. Retinotopic organization in human visual cortex and the spatial precision of functional MRI. Cereb Cortex. 1997;7:181–192. doi: 10.1093/cercor/7.2.181. [DOI] [PubMed] [Google Scholar]
- Gandhi SP, Heeger DJ, Boynton GM. Spatial attention affects brain activity in human primary visual cortex. Proc Natl Acad Sci USA. 1999;96:3314–3319. doi: 10.1073/pnas.96.6.3314. [DOI] [PMC free article] [PubMed] [Google Scholar]
- Gobell J, Carrasco M. Attention alters the appearance of spatial frequency and gap size. Psychol Sci. 2005 doi: 10.1111/j.1467-9280.2005.01588.x. in press. [DOI] [PubMed] [Google Scholar]
- Handy TC, Grafton ST, Shroff NM, Ketay S, Gazzaniga MS. Graspable objects grab attention when the potential for action is recognized. Nat Neurosci. 2003;6:421–427. doi: 10.1038/nn1031. [DOI] [PubMed] [Google Scholar]
- Heinze HJ, Mangun GR, Burchert W, Hinrichs H, Scholz M, Munte TF, Gos A, Scherg M, Johannes S, Hundeshagen H, et al. Combined spatial and temporal imaging of brain activity during visual selective attention in humans. Nature. 1994;372:543–546. doi: 10.1038/372543a0. [DOI] [PubMed] [Google Scholar]
- Hillyard SA, Vogel EK, Luck SJ. Sensory gain control (amplification) as a mechanism of selective attention: electrophysiological and neuroimaging evidence. Philos Trans R Soc Lond B Biol Sci. 1998;353:1257–1270. doi: 10.1098/rstb.1998.0281. [DOI] [PMC free article] [PubMed] [Google Scholar]
- Hopfinger JB, Mangun GR. Reflexive attention modulates processing of visual stimuli in human extrastriate cortex. Psychol Sci. 1998;9:441–447. doi: 10.1111/1467-9280.00083. [DOI] [PMC free article] [PubMed] [Google Scholar]
- Hopfinger JB, Mangun GR. Tracking the influence of reflexive attention on sensory and cognitive processing. Cogn Affect Behav Neurosci. 2001;1:56–65. doi: 10.3758/cabn.1.1.56. [DOI] [PubMed] [Google Scholar]
- Horton JC, Hoyt WF. The representation of the visual field in human striate cortex. A revision of the classic Holmes map. Arch Ophthalmol. 1991;109:816–824. doi: 10.1001/archopht.1991.01080060080030. [DOI] [PubMed] [Google Scholar]
- Johannes S, Munte TF, Heinze HJ, Mangun GR. Luminance and spatial attention effects on early visual processing. Brain Res Cogn Brain Res. 1995;2:189–205. doi: 10.1016/0926-6410(95)90008-x. [DOI] [PubMed] [Google Scholar]
- Jonides J. Voluntary vs. automatic control over the mind’s eye’s movement. In: Long JB, Baddeley AD, editors. Attention and Performance IX. Hillsdale, NJ: Erlbaum; 1980. pp. 187–204. [Google Scholar]
- Kanwisher N, Wojciulik E. Visual attention: insights from brain imaging. Nat Rev Neurosci. 2000;1:91–100. doi: 10.1038/35039043. [DOI] [PubMed] [Google Scholar]
- Kastner S, Ungerleider LG. Mechanisms of visual attention in the human cortex. Annu Rev Neurosci. 2000;23:315–341. doi: 10.1146/annurev.neuro.23.1.315. [DOI] [PubMed] [Google Scholar]
- Kastner S, Pinsk MA, De Weerd P, Desimone R, Ungerleider LG. Increased activity in human visual cortex during directed attention in the absence of visual stimulation. Neuron. 1999;22:751–761. doi: 10.1016/s0896-6273(00)80734-5. [DOI] [PubMed] [Google Scholar]
- Lee DK, Itti L, Koch C, Braun J. Attention activates winner-take-all competition among visual filters. Nat Neurosci. 1999;2:375–381. doi: 10.1038/7286. [DOI] [PubMed] [Google Scholar]
- Lu ZL, Dosher BA. External noise distinguishes attention mechanisms. Vision Res. 1998;38:1183–1198. doi: 10.1016/s0042-6989(97)00273-3. [DOI] [PubMed] [Google Scholar]
- Luck SJ, Thomas SJ. What variety of attention is automatically captured by peripheral cues? Percept Psychophys. 1999;61:1424–1435. doi: 10.3758/bf03206191. [DOI] [PubMed] [Google Scholar]
- Luck SJ, Chelazzi L, Hillyard SA, Desimone R. Neural mechanisms of spatial selective attention in areas V1, V2, and V4 of macaque visual cortex. J Neurophysiol. 1997;77:24–42. doi: 10.1152/jn.1997.77.1.24. [DOI] [PubMed] [Google Scholar]
- Martinez A, Anllo-Vento L, Sereno MI, Frank LR, Buxton RB, Dubowitz DJ, Wong EC, Hinrichs H, Heinze HJ, Hillyard SA. Involvement of striate and extrastriate visual cortical areas in spatial attention. Nat Neurosci. 1999;2:364–369. doi: 10.1038/7274. [DOI] [PubMed] [Google Scholar]
- Martinez-Trujillo J, Treue S. Attentional modulation strength in cortical area MT depends on stimulus contrast. Neuron. 2002;35:365–370. doi: 10.1016/s0896-6273(02)00778-x. [DOI] [PubMed] [Google Scholar]
- Maunsell JH, Cook EP. The role of attention in visual processing. Philos Trans R Soc Lond B Biol Sci. 2002;357:1063–1072. doi: 10.1098/rstb.2002.1107. [DOI] [PMC free article] [PubMed] [Google Scholar]
- Mayfrank L, Kimmig H, Fischer B. The role of attention in the preparation of visually guided saccadic eye movements in man. In: O’Regan JK, Levy-Schoen A, editors. Eye Movements: from Physiology to Cognition. New York: North-Holland; 1987. pp. 37–45. [Google Scholar]
- McDonald JJ, Ward LM. Involuntary listening aids seeing: evidence from human electrophysiology. Psychol Sci. 2000;11:167–171. doi: 10.1111/1467-9280.00233. [DOI] [PubMed] [Google Scholar]
- Moran J, Desimone R. Selective attention gates visual processing in the extrastriate cortex. Science. 1985;229:782–784. doi: 10.1126/science.4023713. [DOI] [PubMed] [Google Scholar]
- Nachmias J. Effect of exposure duration on visual contrast sensitivity with square-wave gratings. J Opt Soc Am. 1967;57:421–427. [Google Scholar]
- Nakayama K, Mackeben M. Sustained and transient components of focal visual attention. Vision Res. 1989;29:1631–1647. doi: 10.1016/0042-6989(89)90144-2. [DOI] [PubMed] [Google Scholar]
- Noesselt T, Hillyard SA, Woldorff MG, Schoenfeld A, Hagner T, Jancke L, Tempelmann C, Hinrichs H, Heinze HJ. Delayed striate cortical activation during spatial attention. Neuron. 2002;35:575–587. doi: 10.1016/s0896-6273(02)00781-x. [DOI] [PubMed] [Google Scholar]
- Pelli DG. The VideoToolbox software for visual psychophysics: transforming numbers into movies. Spat Vis. 1997;10:437–442. [PubMed] [Google Scholar]
- Pestilli F, Carrasco M. Attention enhances contrast sensitivity at cued locations and impairs it at uncued locations. Vision Res. 2005 doi: 10.1016/j.visres.2005.01.019. in press. [DOI] [PubMed] [Google Scholar]
- Ress D, Backus BT, Heeger DJ. Activity in primary visual cortex predicts performance in a visual detection task. Nat Neurosci. 2000;3:940–945. doi: 10.1038/78856. [DOI] [PubMed] [Google Scholar]
- Reynolds JH, Pasternak T, Desimone R. Attention increases sensitivity of V4 neurons. Neuron. 2000;26:703–714. doi: 10.1016/s0896-6273(00)81206-4. [DOI] [PubMed] [Google Scholar]
- Schroeder CE, Mehta AD, Foxe JJ. Determinants and mechanisms of attentional control over cortical neural processing. Front Biosci. 2001;6:D672–D684. doi: 10.2741/schroed. [DOI] [PubMed] [Google Scholar]
- Sclar G, Maunsell JH, Lennie P. Coding of image contrast in central visual pathways of the macaque monkey. Vision Res. 1990;30:1–10. doi: 10.1016/0042-6989(90)90123-3. [DOI] [PubMed] [Google Scholar]
- Serences JT, Shomstein S, Leber A, Golay X, Egeth H, Yantis S. Coordination of voluntary and stimulus-driven attentional control in human cortex. Psychol Sci. 2005 doi: 10.1111/j.0956-7976.2005.00791.x. in press. [DOI] [PubMed] [Google Scholar]
- Sereno MI, Dale AM, Reppas JB, Kwong KK, Belliveau JW, Brady TJ, Rosen BR, Tootell RB. Borders of multiple visual areas in humans revealed by functional magnetic resonance imaging. Science. 1995;268:889–893. doi: 10.1126/science.7754376. [DOI] [PubMed] [Google Scholar]
- Slotnick SD, Yantis S. Efficient acquisition of human retinotopic maps. Hum Brain Mapp. 2003;18:22–29. doi: 10.1002/hbm.10077. [DOI] [PMC free article] [PubMed] [Google Scholar]
- Solomon JA, Lavie N, Morgan MJ. Contrast discrimination function: spatial cuing effects. J Opt Soc Am A. 1997;14:2443–2448. doi: 10.1364/josaa.14.002443. [DOI] [PubMed] [Google Scholar]
- Somers DC, Dale AM, Seiffert AE, Tootell RB. Functional MRI reveals spatially specific attentional modulation in human primary visual cortex. Proc Natl Acad Sci USA. 1999;96:1663–1668. doi: 10.1073/pnas.96.4.1663. [DOI] [PMC free article] [PubMed] [Google Scholar]
- Talairach J, Tournoux P. Co-Planar Sterotaxic Atlas of the Human Brain. New York: Thieme; 1988. [Google Scholar]
- Tootell RB, Mendola JD, Hadjikhani NK, Ledden PJ, Liu AK, Reppas JB, Sereno MI, Dale AM. Functional analysis of V3A and related areas in human visual cortex. J Neurosci. 1997;17:7060–7078. doi: 10.1523/JNEUROSCI.17-18-07060.1997. [DOI] [PMC free article] [PubMed] [Google Scholar]
- Treue S, Maunsell JH. Attentional modulation of visual motion processing in cortical areas MT and MST. Nature. 1996;382:539–541. doi: 10.1038/382539a0. [DOI] [PubMed] [Google Scholar]
- Wade AR, Brewer AA, Rieger JW, Wandell BA. Functional measurements of human ventral occipital cortex: retinotopy and colour. Philos Trans R Soc Lond B Biol Sci. 2002;357:963–973. doi: 10.1098/rstb.2002.1108. [DOI] [PMC free article] [PubMed] [Google Scholar]
- Wandell BA, Brewer AA, Dougherty RF. Visual field map clusters in human cortex. Philos Trans R Soc Lond B Biol Sci. 2005 doi: 10.1098/rstb.2005.1628. in press. [DOI] [PMC free article] [PubMed] [Google Scholar]
- Yantis S. Goal-directed and stimulus-driven determinants of attentional control. In: Monsell S, Driver J, editors. Control of Cognitive Processes: Attention and Performance XVIII. Cambridge, MA: MIT Press; 2000. pp. 73–103. [Google Scholar]
- Yeshurun Y, Carrasco M. Attention improves or impairs visual performance by enhancing spatial resolution. Nature. 1998;396:72–75. doi: 10.1038/23936. [DOI] [PMC free article] [PubMed] [Google Scholar]