Abstract
Major facilitators of water movement through plant cell membranes include aquaporin proteins. Wheat is among the largest and most important cereal crops worldwide; however, unlike other model plants such as rice, maize and Arabidopsis, little has been reported on wheat major intrinsic proteins (MIPs). This study presents a comprehensive computational identification of 349 new wheat expressed sequence tags (ESTs), encoding 13 wheat aquaporin genes. Identified aquaporins consist of 6 plasma membrane intrinsic proteins (PIP) and 1 TIP showing high sequence similarity with rice aquaporins. We also identified 4 NOD26-like intrinsic proteins (NIP) and 2 SIP members that showed more divergence. Further, expression analysis of the aquaporin genes using the available EST information in UniGene revealed their transcripts were differentially regulated in various stress- and tissue-specific libraries. Allele specific Polymerase chain reaction (PCR) primers based on single nucleotide polymorphism (SNP) were designed using PIP as the target gene and validated on a core set of Indian wheat genotypes. A 3D theoretical model of the wheat aquaporin protein was built by homology modeling and could prove to be useful in the further functional characterization of this protein. Collectively with expression and bioinformatics analysis, our results support the idea that the genes identified in this study signify an important genetic resource providing potential targets to modify the water use properties of wheat.
Keywords: major intrinsic proteins, aquaporins, gene expression, abiotic stress, homology modeling
Introduction
Bread wheat, an allohexaploid plant also known as Triticum aestivum Linnaeus (L.), is cultivated in the Southern and Northern hemispheres and is one of the most important cereal crops next to rice in the world in terms of planting area. Bread wheat contributes approximately 95% towards total production and it occupies a central position in agricultural policies. Extreme environmental conditions such as rise in temperature and drought are factors that affect its production. 1 Plants have an adaptive mechanism to regulate water balance in response to a variety of challenging environmental conditions. To withstand the drought stress, it induces a number of proteins, such as late embryogen esis abundant (LEA), aquaporin (AQP), and proline synthetase.2 Aquaporins are ~26–30 kDa water channel proteins, belongs to a highly conserved group of membrane proteins called the major intrinsic proteins (MIPs) that form a large family. MIPs have been reported in animals, insects, fungi, protozoa, bacteria, archaea, and plants and play a key role in transport of water molecules across cell membrane.3 The molecular and functional characterization of aquaporins has highlighted the importance of their regulation in response to environmental stimuli.4 In plants, aquaporins are most abundantly present in the plasma membrane and in the vacuolar membrane, and possibly in other internal membranes.5 Considering the importance of water transport across the membrane, studies on plant AQPs and plant water relations have been well documented. Earlier research has shown that AQPs assist with transportation through the membrane for various physiologically important molecules such as water, glycerol,6 CO2, H2O2, boron and silicon,7 as well as assist with various physiological processes such as drought avoidance,8 salt tolerance, 9 and the chilling response.10 This implies that AQPs have vital roles in transporting a large volume of water with minimal energy expenditure and appear to regulate the trans-cellular route of water.10
On the basis of sequence similarities, plant aquaporins have been classified into 4 subfamilies: the plasma membrane intrinsic proteins (PIPs); tonoplast intrinsic proteins (TIPs); nodulin26-like membrane intrinsic protein (NIPs); small membrane intrinsic proteins (SIPs) and basic membrane intrinsic proteins (BIPs).11,12 There are a number of studies focused on the in silico prediction of aquaporin gene in plants. For instance, 35 aquaporin genes were identified in Arabidopsis,13,14 33 from Oryza sativa L.,15 28 from Vitis vinifera L.,16 and 23 from a moss called Physcomitrella patens17 using whole genome sequences. Recently, 55 expressed aquaporin genes were detected in Populus trichocarpa18 genome sequence data while 33 aquaporin genes from Zea mays19 were determined using expressed sequence tag (EST) data analysis.
Aquaporins exhibit a typically conserved structure with 6 transmembrane helices (TMHs; H1–H6), connected by 5 loops (loops A–E), and two Asn-Pro- Ala amino acid motif. This conserved NPA motif is found to confer substrate selectivity for molecularw transport.13 The expression profile of each aquaporin gene family is regulated differentially. Javot and Maurel’s20 studies revealed that AQPs expression level was highly abundant in roots during soil water uptake.
Promising observations from the evaluation ofw aquaporins among stress resistance or sensitive plants, such as drought susceptible and drought tolerant wheat cultivars,22 other crop cultivars,23 or stressed EST libraries,24 clearly indicate that aquaporins would be important for water uptake, transport and identification or development of any stress tolerant genotypes of crop species. The present work tackles challenges for development of functional marker (FMs) from sequence polymorphisms present in allelic variants of an aquaporin gene. FMs precisely distinguish alleles of a targeted gene, and are modern molecular markers for marker-assisted selection in wheat breeding.25 Improvement of productivity of wheat cultivars under drought conditions has become one of the important breeding program objectives in wheat. The performance of genotypes under drought conditions is largely attributed to genetic variations, mostly at the single nucleotide level. Therefore, an in silico analysis was conducted with the aim to identify all possible SNPs within aquaporin ESTs and to demonstrate the utility of SNP in genetic mapping and genetic diversity applications.
An enormous deal is known about aquaporin proteins in several plant species; however, little information is available about the aquaporin gene family in wheat. This may be due to the unavailability of its complete genome sequence, as well as the allohexaploid nature of the genome, which is proving to be for gene identification and analysis. Previously, 35 PIP and TIP aquaporin genes have been identified in wheat as reported by Forrest and Bhave,11 as well as Yousif and Bhave.12 Determining and understanding of the molecular mechanisms underlying the response to abiotic stress responses is required for genetic improvement of wheat for stress tolerance.23 Although AQP genes respond to multiple stresses, their precise role in abiotic stress tolerance remains unclear. As reported by Forrest and Bhave,11 more MIPs may exist in wheat due to presence of 3 homologous genomes in wheat. The aim of this work was to identify and characterize more wheat aquaporin gene encoding AQPs that are potentially important for the regulation of root water flow. In this regard, we developed a bioinformatics pipeline by combining an in-house PERL script with openly available analysis tools to identify new wheat aquaporin (TaAQP) genes from a publicly available wheat EST (wEST) database. Here, identification of 13 MIP genes in wheat provides extensive information for functional studies and the development of markers for stress tolerance. Phylogenetic analysis revealed how the evolutionarily-conserved multigene aquaporin family behaves in a polyploid species such as wheat. Conserved consensus motifs exist across the aquaporin subfamilies to support their association. Using the available EST information as a source of expression profile, aquaporin genes from wheat were detected in 9 different tissues. A 3- dimensional (3D) model of the T. aestivum aquaporin (PIP1:2) has been developed. This is the first report of the protein structure analysis of T. aestivum PIP gene and development of PIP gene specific marker. Identification of the functional genes in wheat is becoming an important line of research, which could help us to understand the molecular genetic basis for the wheat genetic improvement and also provide the functional genetic resources for transgenic research.
Materials and Methods
Database sources
The T. aestivum EST sequences were downloaded from the National Center for Biotechnology Information (NCBI) in the form of UniGene (Ta.seq.all.gz). Rice aquaporins family sequences were retrieved from Uniprot database (http://www.uniprot.org/) and used as query. To avoid false positives, 50% identity and e-value of 1e-3 was taken as the threshold for the sequences obtained from BLAST analysis. The transcripts obtained from the search were analyzed using the CAP3 Sequence Assembly Program.26
Bioinformatics analysis
Open reading frames (ORFs) were generated by ORF finder (http://www.ncbi.nlm.nih.gov/gorf). Sub-cellular localization prediction of each predicted TaAQP was carried out using WoLF PSORT (http://wolfpsort.seqcbrc.jp) and TargetP 1.1 (http://www.cbs.dtu.dk/services/TargetP). 2D and 3D structure alignment was performed using MATRAS (http://strcomp.protein.osaka-u.ac.jp/matras/). Conserved domains and signature pattern analysis was performed using SMART (http://smart.embl-heidelberg.de/) and Scanprosite (http://prosite.expasy.org/scanprosite/) programs.
Phylogenetic tree construction
Amino acid sequences of 67 gramineous PIPs, TIPs, SIPs and TIPs, including 20 from rice (Oryza sativa), 29 from maize (Zea mays), 11 from wheat, and 7 from barley (Hordeum vulgare), and the remainder from from dicot species like Arabidopsis thaliana and Brachypodium distachyon were aligned with 13 TaAQP identified in this study using ClustalW program (http://www.ebi.ac.uk/clustalw/). To investigate the evolutionary relationship among aquaporins proteins, a phylogenetic tree was constructed by employing the minimal evolution (ME) method and the neighbor-joining (NJ) method using the Bootstrap value of 1,000 replicates wrapped in the MEGA4 (http://www.megasoftware.net/mega.html)27 software suite.
Analysis of expression profiles
The expression profile was determined by analyzing the EST counts based on UniGene of T. aestivum for the various tissues (http://www.ncbi.nlm.nih.gov/UniGene). The EST expression profile was calculated by
In silico mining of SNP
Aquaporin ESTs were downloaded from Unigene and were cleaned to remove contaminating sequences. Vector sequences and other contaminations were identified by using the VecScreen web server (http://www.ncbi.nlm.nih.gov/VecScreen/VecScreen.html). Poly-A/T tails were completely trimmed by the EST trimmer Perl program. After pre-cleaning, EST sequences shorter than 50 bases were discarded. Furthermore, low complexity regions were masked by using Repeat Masker (http://www.repeatmasker.org/). ESTs clustering and SNP identification as performed on the Seqman module of DNAstar software (DNASTAR, USA). A Perl script was written to parse Indel data from output results.
Validation of SNPs
The allele-specific primers were designed from the position of base transition. The rationale in designing the primers was based on the premise that the 3′-terminal positions ought to be unique among the known wheat genomic sequences. The primers were designed from consensus sequence of contigs which have the candidates SNPs by Primer3 (http://frodo.wi.mit.edu/cgibin/primer3/primer3_www.cgi) with Tm 55 °C–65 °C, and PCR product size 175 bp. Polymerase chain reaction (PCR) was performed in a 25 μL volume containing 100 ng of genomic DNA, 2.5 μL of 10 xPCR buffer, 200 μM of each dNTP, 0.2 μM of each primer and 1.0 unit of Taq DNA polymerase (Bangalore Genei, India). The thermocycling program consisted of an initial denaturation at 94 °C for 4 min, followed by 30 cycles of 45 sec at 94 °C, 45 sec at 64 °C, 60 sec at 72 °C and a final cycle of 5 min at 72 °C in S-1000 Thermal Cycler (Bio-Rad). The amplified product was separated by electrophoresis on 3% (w/v) agarose gel and stained with ethidium bromide.
3-D model generation and validation
The model of PIP gene (Accession no AF366564) was built by Modeller 9v8 (http://www.salilab.org/modeller/), using a template structure (2B5F: spinach aquaporin) with 74% identity. The model with the lowest discrete optimized protein energy (DOPE) score was selected. Finally, the model was minimized using GROMACS28 and its stereochemical quality was evaluated using PROCHECK (http://www.ebi.ac.uk/thornton-srv/software/PROCHECK/) RSMD tertiary structures of both template and modeled protein was calculated by SuperPose (http://wishart.biology.ualberta.ca/SuperPose/). The final 3D structure of T. aestivum aquaporin was submitted to the Protein Model Database (PMDB; http://mi.caspur.it/PMDB/).
Results and Discussion
Identification and characterization of aquaporin genes in wheat
ESTs have proven to be an excellent source for gene discovery, molecular marker discovery and gene expression analysis. To ascertain aquaporin genes in the wheat genome, wheat’s UniGene database, Ta.seq. all, which contains 56,943 entries, was obtained. Aquaporin families from O. sativa were employed against the UniGene database of wheat by BLAST application. As a result 349 selected ESTs were assembled into continuous sequences of length ranged from 292–128 bp, encoding 13 aquaporin genes. The BLAST identity ranged from 51%–90% by E-value of 0 to 8e-109 (Table 1). The total number of ESTs used for the assembly was highest in TaPIP1-1 (Table 1). All AQP existence was supported by EST hits from SwissProt or GenBank database (Table 1). Since there was standard nomenclature established for AQPs in Arabidopsis and rice, we named the predicted MIPs accordingly. In this study we noticed that all the predicted AQPs had conserved transmemebrane helix domains, which is the backbone for the AQP family. Based on homologies between DNA sequences, amino acid sequences, structure domain, and the phylogenetic analysis in comparisons with rice, 6 were confirmed as TaPIP subfamily as they exhibited closest sequence identity (61%–90%) to rice PIP cDNAs. Likewise, the others were confirmed as TaNIP based upon grouping and closest identity to rice NIP cDNAs (73%–86%), followed by TaSIP (51%–88% identity) whereas TaTIP showed 86% identity with rice TIP cDNAs (for detail see Table 1). The identified TaPIP subfamily can be further divided into 2 subfamilies named PIP1 and PIP2 (PIP2-1, PIP2-3, PIP1-3, PIP1-1, PIP2-2, PIP2-4). Similarly TaNIP can be further divided into 3 subgroups TaNIP1, TaNIP2, and TaNIP 4, (NIP4-1, NIP1-3, NIP1-1, NIP2-1) and SIP into 2 subgroups TaSIP1 and TaSIP2 (TaSIP1-2, TaSIP1-1), respectively. In the light of the large numbers of AQPs genes in rice, maize and Arabidopsis, it was possible that additional genes may exist in wheat. Our results are addition on the AQP identified by Forrest and Bhave11,12 as they do not identify SIP and NIP in their investigation under a genome-wide analysis of the aquaporin gene family in wheat. Thus, PIP and TIP genes with a new set of wEST followed by new members of NIP and SIP were identified in the wheat genome, which will add further diversity to the wheat MIP super family and provide valuable information for understanding the whole AQP family of common wheat.
Table 1.
Blast results of identified aquaporin to classify them accordingly.
| Aquaporin identified | No. of ESTs in TC | TC length | Rice gene | Chromosome no | Cellular localization | Bit score | % identity | E-value |
|---|---|---|---|---|---|---|---|---|
| Blast sequences alignment | ||||||||
| TaNIP1-1 | 24 | 278 | OsNIP1-1 | 2 | PM and M | 466 | 86 | 4e-165 |
| TaNIP1-3 | 24 | 153 | OsNIP1-3 | – | PM and M | 459 | 76 | 7e-68 |
| TaNIP2-1 | 41 | 295 | OsNIP2-1 | 2 | PM and M | 510 | 86 | 0 |
| TaNIP4-1 | 6 | 290 | OsNIP4-1 | 1 | PM and M | 323 | 73 | 8e-109 |
| TaPIP1-1 | 64 | 290 | OsPIP1-1 | 3 | M | 483 | 87 | 2e-171 |
| TaPIP1-3 | 32 | 292 | OsPIP1-3 | – | M | 535 | 90 | 0 |
| TaPIP2-1 | 25 | 353 | OsPIP2-1 | 7 | M | 250 | 61 | 3.00E-77 |
| TaPIP2-2 | 39 | 290 | OsPIP2-2 | 2 | PM and M | 489 | 83 | 2e-175 |
| TaPIP2-3 | 8 | 286 | OsPIP2-4 | – | PM and M | 494 | 86 | 3e-175 |
| TaPIP2-4 | 3 | 286 | OsPIP2-6 | 4 | PM and M | 526 | 90 | 0 |
| TaSIP2-1 | 38 | 244 | OsSIP2-1 | – | ER | 218 | 51 | 2e-70 |
| TaSIP1-1 | 38 | 128 | OsSIP1-1 | – | ER | 207 | 88 | 2e-66 |
| TaTIP4-1 | 7 | 252 | OsTIP4-1 | 5 | T | 370 | 86 | 3e-130 |
Abbreviations: TC, tentative consensus sequence; PM, plasma membrane; M, mitochondria; T, tonoplast; ER, endoplasmic reticulum.
Comparisons of aquaporin genes in selected plant species
For comparative analysis, we used aquaporin genes of rice, barley, wheat, Arabidopsis, maize and grapes available in the public domain (Table 2). The genome of Arabidopsis encodes the largest number of homologous aquaporin,13 followed by O. sativa L.15 and Z. mays L.19 It is interesting to note here that wheat, rice and barley belong to the same grass family so their overall aquaporin gene number (identified aquaporin) proportions were very close.
Table 2.
Summary of the aquaporin family in different plant species.
| Plant | A. thaliana | O. sativa | Z. mays | V. vinifera | H. vulgare | T. aestivum |
|---|---|---|---|---|---|---|
| Class | Newly identified | |||||
| NIP | ||||||
| NIP1-1 | 3 | 1 | – | 1 | 1 | 1 |
| NIP1-3 | – | 1 | – | – | – | 1 |
| NIP2-1 | 3 | 1 | – | 1 | 1 | 1 |
| NIP4-1 | 1 | 1 | – | – | 1 | 1 |
| PIP | ||||||
| PIP1-1 | 5 | 1 | 1 | 1 | 1 | 1 |
| PIP1-3 | 5 | 1 | 4 | 1 | 1 | 1 |
| PIP2-1 | 7 | 1 | 4 | 5 | 1 | 1 |
| PIP2-2 | 3 | 1 | 2 | 1 | 1 | 1 |
| PIP2-3 | 3 | 1 | 1 | 1 | 1 | 1 |
| PIP2-4 | 3 | 1 | 2 | 1 | 1 | 1 |
| SIP | ||||||
| SIP2-1 | 1 | 1 | 1 | – | – | 1 |
| SIP1-1 | 3 | 1 | – | – | 1 | 1 |
| TIP | ||||||
| TIP4-1 | 3 | 1 | – | 1 | 1 | 1 |
Sequence alignment and conserved motifs in wheat and rice
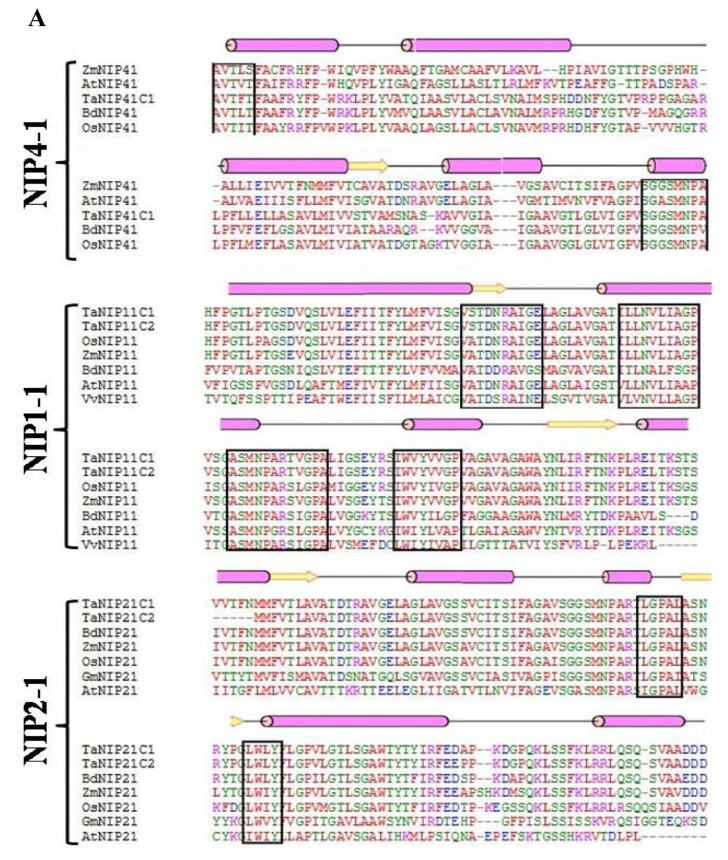
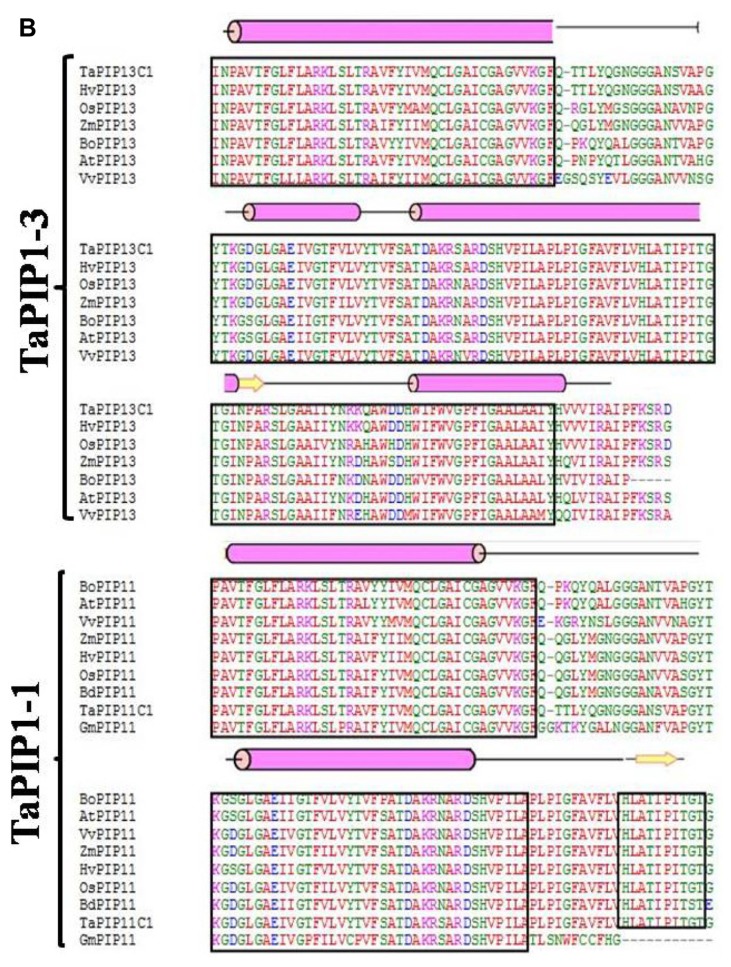
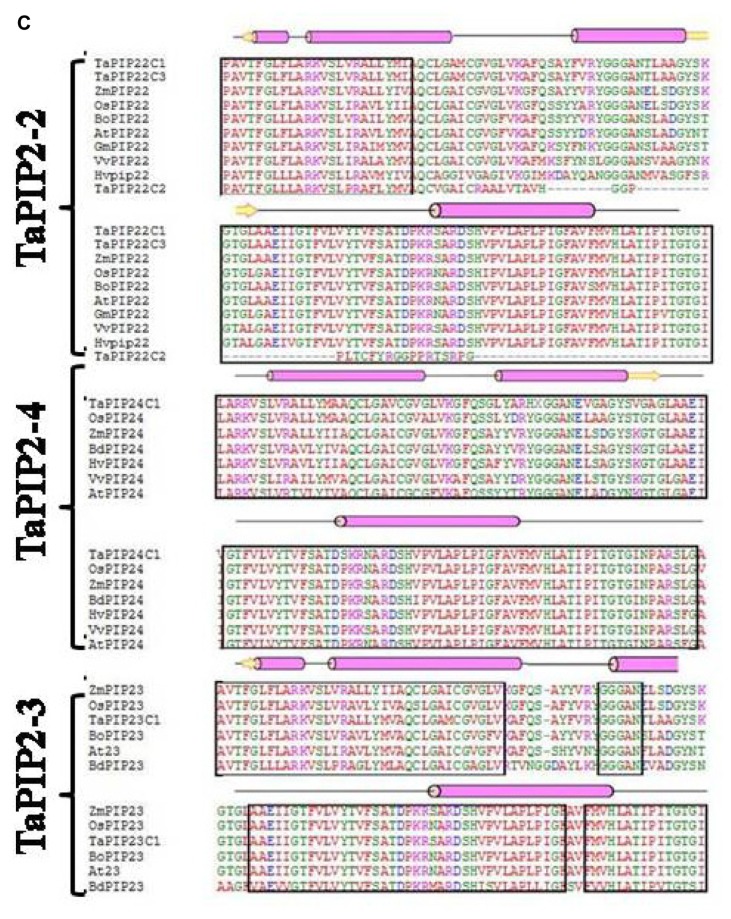
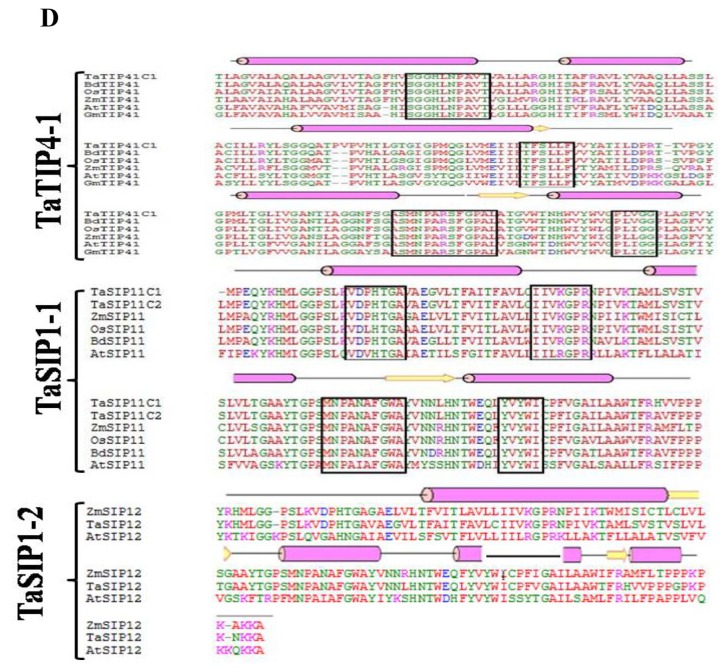
The sequence and structural alignment of deduced amino acid sequences of wheat and some well-described AQPs from selected plant species showed a high degree of homology (Fig. 1). Considering the high homology between aquaporin subgroups irrespective of species, these groups may have evolved before the divergence of higher plants. It was observed that all the aquaoprin subfamilies have a tendency to have alpha (α) helical structure followed by a beta (β) sheet. PIP2 genes are highly homologous as compared to PIP1 and other aquaporin subgroups (Fig. 1B and C). Functional studies of AQPs showed that PIP2s reveal high osmotic water permeability in contrast with PIP1 members that show lower or no water permeability when expressed in Xenopus oocytes, maize,19 poplar,29 gravepine16 and wheat.30 A high degree of divergence was observed in NIPs (Fig. 1B). Variations were observed between A. thaliana and G. max in SIP1-1, whereas in SIP1-2 subfamily, no conserved residues were detected (Fig. 1D). Because of the high amino acid sequence homology and functional diversity of AQPs in plants, a systematic analysis of signature sequences and residues is required to precisely identify and classify newly predicted AQPs. The translated amino acid sequences of TaAQP were scanned for motifs, signature pattern and conserved secondary structure to obtain a detailed functional analysis.
Figure 1.
Multiple sequence alignment using amino acid sequence of (A) TaNIP1-1, TaNIP1-3, TaNIP2-1, TaNIP4-1 (B) TaPIP1-1 and TaPIP1-3 (C) TaPIP2-2, TaPIP2-3 and TaPIP2-4 (D) TaTIP1-4, TaSIP1-1 and TaSIP1-2 from different cereal crops. Conserved amino acids are shown in black boxes. Protein structural features are indicated above the alignment. Alpha helix and beta strands are elements of secondary structure represented as rods and arrows.
Computational prediction revealed up to 6 transmembrane helices with 21 amino acid residues in each helix among all 13 deduced amino acid sequences of TaAQPs as shown in Supplementary Figure 1. Predicted amino acid sequences of the aquaporin gene family revealed an NPA motif (Asn-Pro-Ala) that was extremely conserved.11,12 Two NPA motifs were predicted in PIPs, NIPs, TIPs, and one in SIPs (Supplementary Fig. 2). The NPA boxes and adjacent residues are considered essential for water transport activity.31 The first NPA box is located in the first cytosolic loop and the second NPA box is located in the third extracellular (or vacuolar for TIPs) loop. Substrate selectivity for molecular transport is recognized by the presence of an NPA box.32 The helical region is of particular importance for AQP structure because they contain the conserved NPA motifs that are functionally important for water channels. The C-terminal region of TaPIPs and NIPs encompasses conserved phosphorylation sites KXSXXR/K (Supplementary Fig. 2). Phosphorylation of the C-terminal serine may regulate aquaporin activity in response to an osmotic signal.18 An increase in aquaporin activity following phosphorylation was demonstrated in α-TIP and PM28A in oocytes.33 AQPs belonging to PIP1 subfamily encode polypeptides of 244–292 amino acids in length with 92.47% (TaPIP1-1 and TaPIP1-3) shared sequence identity in wheat. The length of the PIP2 (PIP2-3) ORF ranged from 170–320 amino acids, which had a relatively high sequence similarity of 88% with PIP2-2. In addition, PIP2-2 and PIP2-4 shared 80% amino acid sequence identity with each other. In general, lengths of estimated ORFs were quite different between PIP1 and PIP2. The predicted single polypeptide of TIP1 was 252 amino acids in length. However, predicted SIP1-1 polypeptide ORFs ranged from 128 to 244 amino acids that shared 55% sequence identity (see Supplementary Table 1). NIPs were divided phylogenetically into 4 different subgroups (NIP1-2, NIP1-3, NIP2-1 and NIP4-1) with ORF lengths ranging from 245 to 250 amino acids. However, TaNIP2-1 and TaNIP4-1 (26%) showed minimum identity. After detailed fingerprinting analysis of different classes of putative aquaporin, we found that these AQP proteins have a signature motif identical to phosphokinase C, tyrosine kinase and casein kinase II proteins, as well as N-myristoylation site and MIP family signature sequences SGxHxNPA shown in Table 3. Specific signature pattern scans were identified to be PKC_PHOSHO_SITE, N-Myristoylation site, MIP signature and CK2_PHOSPHO_SITE families of 3, 6, 4 and 9 amino acids in length and present in all 4 classes of aquaporin. These families have a more or less significant relationship with regulation and metabolism. Plant protein kinase C (PKC) cascades are likely to be involved in mitogen- activated signaling pathways, cellular regulation and metabolism, gene expression, metabolism, motility, membrane transport, and apoptosis.34 Previous studies have reported that Casein kinase II, a selective protein kinase, is possibly involved in circadian clock regulation, photoperiod sensitivity35 and various regulatory processes of plants. In eukaryotes, N-myristoylation (N-MYR) plays an important role in cell physiology, alters the lipophilicity36 of the target protein and facilitates its interaction with membranes, thereby affecting its subcellular localization. N-MYR in plant cells has a critical role in controlling membrane-signaling pathways that lead to specific plant immunity.37 For instance, in Arabidopsis, N-MYR-related protein mediates plant rescue metabolism to survive damage created by external uneven conditions. This provides evidence of structural and functional correlation of the aquaporin protein class in relation to plant metabolism. We found that functional amino acid sequence motifs are well conserved among members of a subgroup and they are likely to have similar functions. Typical features were revealed by amino acids of the predicted aquaporin proteins such as 6 transmembrane α-helices, NPA box, and homologies with other plant proteins, which provided strong indications that the identified, putative wheat AQPs exhibit water channel activity. All these highly-conserved residues have been shown functional importance for substrate filtering and gating of aquaporin channel proteins.38
Table 3.
Fingerprint analysis result for different aquaporin classes.
| MIP class | MIP subclass | MIP family signature | N-myristoylation site | PKC_PHOSPHO_SITE | CK2_PHOSPHO_SITE |
|---|---|---|---|---|---|
| NIP | NIP1-1 | HFNPAVTFA | [G][A/L/T/C/G][V/A/I/T/][L/V/P/A][G/T/A][S/G/A] | [T][V/I/N][R/K] | TGSD |
| NIP1-3 | HMNPAVTLA | [G][A/L/T/A/C/G][V/A/I/T/G/D][A/V/P/I/N/D][G/T/A/S/N][A/G/S/I/Q] | [T][I/N][K/R] | TGSD | |
| NIP2-1 | HMNPAVTLA | [G][A/L/T/A/C/G][V/A/I/T/G/D][A/V/P/I/N/D][G/T/A/S/N][A/G/S/I/Q] | [T/S][E/N/F][R/K] | [S][I/A][A/H][D] | |
| NIP4-1 | HFNPAVTFA | [G][S/A/L/M/V/G][R/P/A/N/I][G/K/V/I/N/Q][T/A/S/N/G][A/Q/H/T/R/D/S/N] | [T][V/I/N][R/K] | TGSD | |
| PIP | PIP1-1 | HINPAVTFG | [G][G/I/L/A/T][D/A/S/F/M/V/N/H][F/W/G/I/C/K/N/P/Q][A/G/N/T][A/F/H/R/V/T/I/G/L] | SAR | [T/S][K/A/P][G/T/R/Q][D/E] |
| PIP1-3 | HINPAVTFG | [G][N/S/I/L/A/V/N/G][P/K/A/S/F/I/V/N][P/K/A/S/F/I/V/G/N][S/C/W/G/I/C/K/N/P][G/S/A/N][S/T/F/H/R/A/V] | [S][A/E][R] | [T/S][K/A][G/T/R][D] | |
| PIP2-1 | HINPAVTFG | [G][G/I/L/A/T][D/A/S/F/M/V/N/H][F/W/G/I/C/K/N/P/Q][A/G/N/T][A/F/H/R/V/T/I/G/L] | [S/T][A/M][R] | [T/S][A][A/T/R][D] | |
| PIP2-2 | HINPAVTFG | [G][G/I/L/A/T][D/A/S/F/M/V/N/H][F/W/G/I/C/K/N/P/Q][A/G/N/T][A/F/H/R/V/T/I/G/L] | [S][A/F][R] | [S][A][T/R][D] | |
| PIP2-3 | HINPAVTFG | [G][N/S/I/L/A/V/N/G][P/K/A/S/F/I/V/N][P/K/A/S/F/I/V/G/N][S/C/W/G/I/C/K/N/P][G/S/A/N][S/T/F/H/R/A/V] | [S][K/A/F][R] | [S][G/A][P/T][D] | |
| PIP2-4 | HINPAVTFG | [G][A/L/T/C/G][V/A/I/T/G/D][A/V/P/I/N/D][G/T/A/S/N][A/G/S/L/I/Q] | RGRR | TAAD | |
| SIP | SIP1-1 | HINPAVTFG | [G][A/I/G][S/H/V/I][T/Y/G/I][A/G/T][A/L/I/G] | [S/T][I/F/K][K/R] | SLHE |
| SIP2-1 | HINPAVTFG | [G][A][I/A][Y/L][T/A][G/A] | [S/T][F/L][K/R] | – | |
| TIP | TIP4-1 | HLNPAVTVA | [G][V/L/N/G][P/W/F/N/I/A][I/V/F/S/T/A][A/T/G/S/N][Q/G/A/H/G] | [S/T][S/I][P/I][D/E] | – |
Sub-cellular location of the predicted AQPs
AQPs were characterized in this study and a link with AQPs subcellular localization was established. Identified TaPIPs, TaNIPs, TaTIPs and TaSIPs were figured out, to contain a signal peptide localized in various places; ie, mitochondria (TaPIP1-1, TaPIP1-3 and TaPIP2-1), tonoplast (TaTIP4-1), plasma membrane (PM) and mitochondria (TaNIP1-1, TaNIP1- 3, TaNIP2-1, TaNIP4-1, TaPIP2-2, TaPIP2-3 and TaPIP2-4), and endoplasmic reticulum (TaSIP1-1, and TaSIP1-1; Table 1). Proper sub-cellular localization represents a mechanistic regulation of aquaporin activity that possibly relies on its ability to form multimers between members of different subgroups. 39 In consistent with previous reports, TaPIPs proteins were found in PM and mitochondrial subcellular compartments, which are identical to those predicted in ice plants (Mesembryanthemum crystallinum). 9 However, most of the cotton PIPs were also found to localize in PM, and these would be important for movement of water and other nonpolar small molecules.21,40 In rice, sub-cellular localization of all PIP members were predicted to exist in the PM in addition to chloroplast and mitochondria or tonoplast. They could also exist in both PM and tonoplast, while TIPs are localized either to PM or tonoplast or both.11
Phylogenetic relationships of aquaporin family genes in different plant species
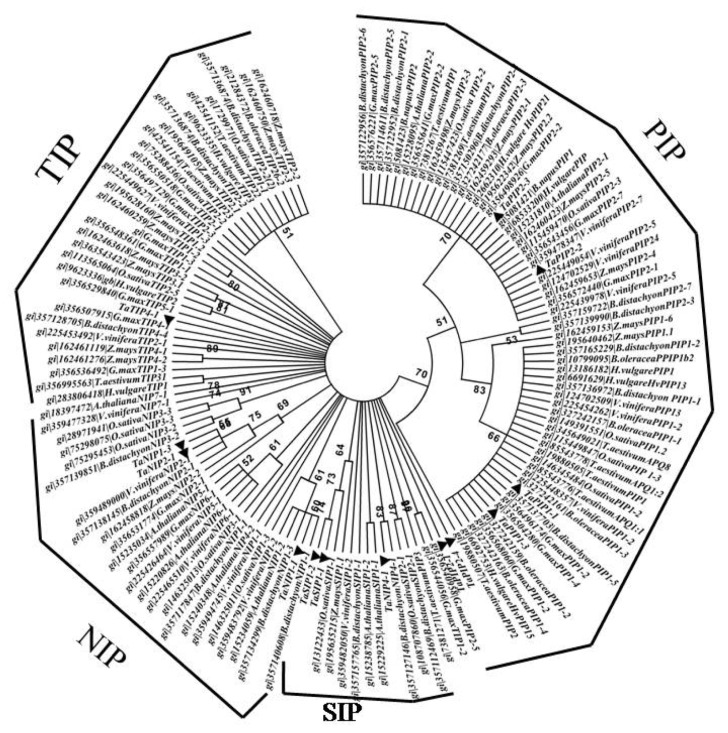
To understand the evolution and conservation of crop species, elucidation of the evolutionary relationships is a crucial step.41 Earlier, Zardoya et al42 established a phylogenetic framework for the aquaporin family in eukaryotes. In order to systematically classify the putative TaAQP, a phylogenetic tree was constructed using bootstrap analysis based on multiple sequence alignments of the proteins sequences of Vitis vinifera, Glycine max, B. distortion, Z. mays, O. sativa, A. thaliana and H. vulgar. Phylogenetic analysis confirmed that the identified wheat AQPs could be classified into 4 large and highly similar orthologous groups of aquaporin subfamilies; ie, PIP, TIP, SIP and NIP (Fig. 2). The NIP subfamily exhibits 3 distinct clusters corresponding to the NIP1, NIP2, NIP4 subgroups. The PIP subfamily is divided into PIP1 and PIP2 subgroups but has slight pair wise-sequence divergence when compared with NIPs, TIPs and SIPs. This may be due to the slower rate of evolution of PIPs compared to other subgroups. There were 6 AQPs from rice, with Arabidopsis and wheat grouped under NIP subfamily, 4 AQPs from wheat, 8 from Arabidopsis and 5 from rice grouped into the TIP subfamily. There were only 2 AQPs from wheat, 2 from rice and 3 from Arabidopsis were grouped under SIP family, which was confirmed to be a smaller subfamily of AQPs. PIP proved to be largest subfamily among all AQPs, with 10 PIPs from wheat, 10 from rice and 12 from Arabidopsis, respectively. PIPs, SIPs, are closely related. As the results indicated, wheat, rice and Arabidopsis show similarity in the number of AQPs in each subgroup. All branches were supported by bootstrap value. Branches corresponding to less than 50% bootstrap replicates are collapsed. Phylogenetic analysis performed based upon AQPs homologous revealed that as many as 13 identified AQP genes were clearly divided into 4 different subfamilies (PIP, SIP, NIP and TIP). Thus, the phylogenetic clustering pattern analysis obtained in this study is similar to the findings reported in other plants previously.8,15
Figure 2.
Phylogenetic tree was constructed using the neighbor-joining method and diagrams drawn with MEGA4. NJ method used the multiple sequence alignment generated by ClustalW to generate the tree. Bootstrap values are indicated against each branch. Phylogenetic tree showing the 4 clusters of PIPs, TIPs, NIPs and SIPs. The 13 wheat AQPs are compared with all the PIPs as well as the TIPs, NIPs and SIPs from A. thaliana, G. max, and B. distachyon, H. vulgare, V. vinifera and Z. mays. For visibility reasons identified wheat aquaporin are indicated by a red triangle. Branch lengths are proportional to evolutionary distance.
Expression profile analysis of aquaporin genes
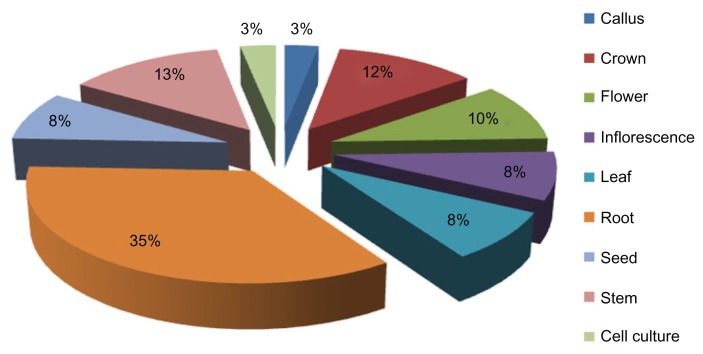
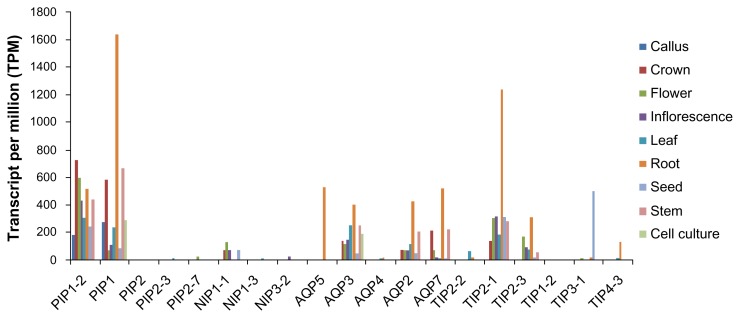
It has been suggested that the aquaporin gene family expression pattern in response to abiotic stress in different plant tissues at various stages has been detected in various plants. To demonstrate the utility of digital expression analysis of numerous genes across various tissues, we performed gene expression analysis of the wEST collection.43 The expression profiles varied with aquaporins subfamilies. 5 genes from PIP (PIP1-1, PIP1, PIP2, PIP2-3, and PIP2-7), 6 genes from TIP (TIP2-2, TIP2-1, TIP2-3, TIP1-2, TIP3-1 and TIP4-3), 3 each from NIP (NIP1-1, NIP1-3, and NIP3-2) and AQPs (AQP5, AQP3, AQP4, AQP2, AQP7) were analyzed to compare the abundance of mRNA transcripts in various tissues. The aquaporin family genes from T. aestivum were found in the callus, crown, flower, inflorescence, leaf, root, seed, sheath and stem. Figure 3 shows aquaporin gene transcripts expressed at relatively high levels in crown and root tissue (36%), followed by stem tissue (13%), crown (12%), inflorescences and leaf (8%) flower (10%), and, least abundantly, in cell culture and callus (3%). We performed gene expression analysis in as many as 9 wheat tissues; ie, callus, cell culture, crown, stem, inflorescence, leaf, flower, seed and root (Fig. 3). Our results showed that PIP1-2, PIP1, TIP2-1 and APQ3 genes were detected in most of the tissues. It is noteworthy that a relatively very high expression level of TIP2-1 and APQ3 was found in the root and PIP1-2, and PIP1 in crown tissues (Fig. 4). However, the level of expression pattern was observed to be low in the majority of tissues examined for PIP2-3, PIP2-7, NIP1-3, NIP3-2, TIP1-2 and TIP4-2. In order to determine the functionality of this new MIP subfamily, advance studies are required to investigate expression pattern, localization and substrate specificity. Understanding expression profiling of aquaporin genes will help to develop T. aestivum cultivars that may be adaptable to drought stress conditions and to support their potential role in the development of the respective tissue or process in these tissues.44
Figure 3.
Distribution of T. aestivum aquaporin family genes in various tissues. The expression profile was determined by analyzing the EST counts of 9 different kinds of tissues.
Figure 4.
Tissue specific expression of the aquaporin genes profile was determined by analyzing the EST counts based on UniGene.
In silico identification and validation of SNP
The availability of huge plant sequence data in the public domain is a rich resource for discovery of high-quality SNPs using bioinformatics pipeline. EST databases are an abundant source of SNP markers.45 Recently, Mondini et al46 identified SNPs involved in drought and salt stress tolerance in durum wheat. In this study, 1381 aquaporin ESTs were assembled into 32 contigs. Assembly of these cleaned ESTs was done with stringent parameters (match size = 40, sequence length = 100, maximum expected coverage = 40 and match percentage = 95). Only contigs containing a minimum of 4 and maximum of 80 members with 4 different cultivars were analyzed further. Not enough information can be gained from contigs < 4 EST and it becomes difficult to view and edit contigs > 80 ESTs. SNPs were declared only when there was no mismatch, no gaps before and after putative SNP site; in addition, the alternative base in the consensus sequence was present at least more than twice in an alignment. 6 SNPs from 9 contigs were taken into consideration with SNP score ≥ 40 and SNPs in the start and end of the alignment were ignored (Table 4). In current investigation, we found only a few SNPs because less EST sequences were available for the aquaporin gene. The allele-specific marker (Supplementary Table 2) was used for amplification of DNA fragment in 38 wheat genotypes (Supplementary Table 3), representing a core set.47 20 genotypes resulted in the presence of a band of ~170 bp fragments (Fig. 5), and the remaining 18 genotypes did not yield any amplification. 1 SNP was found between these genotypes. The primer is amplified mostly in drought tolerant genotypes, based on the reported phenotypic data analysis (BS Tyagi, personal communication). This is the first report of a PIP-derived SNP marker in wheat that can be used by the breeders for improving tolerance to drought and high temperatures in wheat breeding programs.
Table 4.
Details of ESTs and predicted SNPs in aquaporin genes.
| Gene name | No. of EST | Unigene no. | Contigs | Singletons | SNP (>40%) |
|---|---|---|---|---|---|
| PIP1:2 | 886 | Ta.50448 | 6 | – | 4 |
| PIP1 | 336 | Ta.23833 | 3 | – | 2 |
Figure 5.
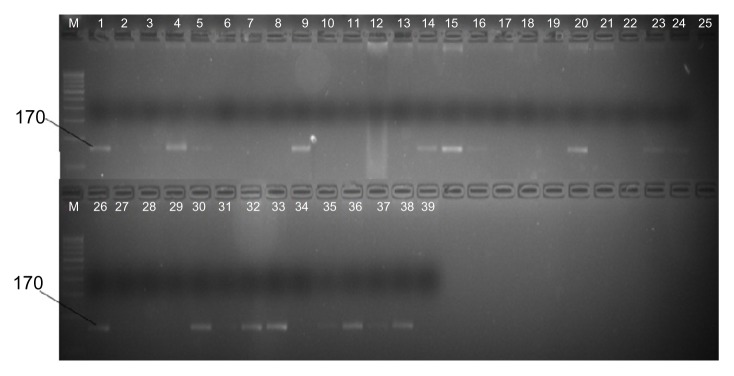
PCR analysis using the SNP marker. List of genotype was mentioned in Supplementary Table 2. The size of the amplification product is shown on the left. Absence of a band indicates the specific sequence is absent in wheat genotype. Lane 39 is a negative control, which used H2O as the template.
3D model prediction and validation
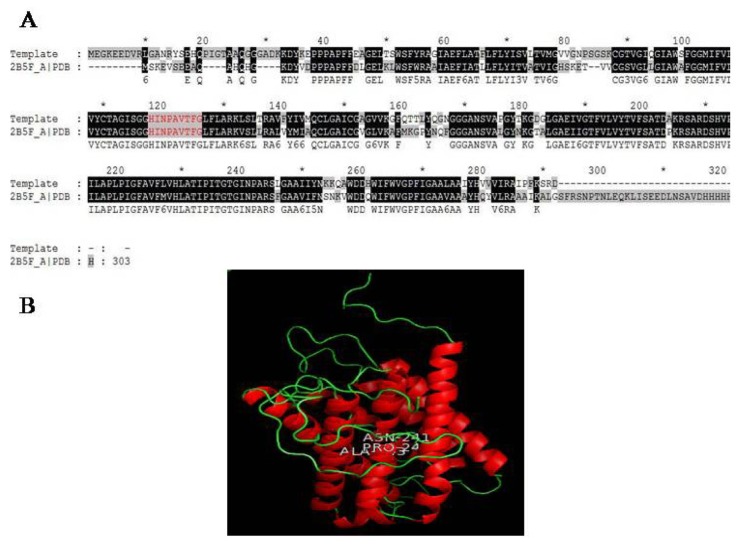
After establishing functional annotation, we have now extended research on the structural background of aquaporin protein in order to gain more insights. Lack of theoretical 3D structure of TaAQP protein motivated us to carry out this study. Therefore, we modeled wheat PIP (Accession no: AAM00368) using BLASTP identified the crystal structure with PDB ID: 2B5F as templates. Query sequences showed 74% sequence identity with the template with an E-value of 1e-59 (Fig. 6A). Only 1 (0.4%) out of 292 residues was present in the disallowed region whereas another 4 (1.7%) residues were present in the generously allowed regions of the Ramachandran plot, respectively (Supplementary Fig. 3). Similarly, despite of having ~74% sequence homology amongst template and modeled proteins, the tertiary structure was also found to be comparable as indicated by a root mean square deviation of 0.60 Å. Holistically, the modeled tertiary structure of T. aestivum PIP is structurally very similar to the spinach aquaporin transport protein. The modeled TaPIP protein comprised of 6 helices, 18 helix-helix interactions, 14 beta turns, and 3 gamma turns were predicted in the 3D structure of aquaporin, implying a helix-rich structure (Fig. 6B). The final protein structure was deposited in PMDB and is available under the Accession ID: PM0078491.
Figure 6.
(A) Pairwise alignment of aquaporin family gene from Triticum aestivum and the template (PDB ID: 1N0J). The dash represents insertion and deletion; conserved residues showed in shaded region, NPA box is labeled and the aquaporin signature is shown in red (B) Aquaporin structure model produced using Modeller9.
We believe that the present findings illustrate more insights into the structure-function role of AQPs protein in molecular terms. In order to understand the function of individual MIPs in maintaining water homeostasis, it is necessary to carry out knock-out experiments and promoter analyses, as well as substrate specificities under various physiological conditions in relation to water balance and nutrient uptake in wheat and other plant systems. Current biotechnology and bioinformatics tools may identify and characterize genes in their respective subclasses. As a model plant, and having a great synteny with the grass family with respect to gene structure, the information generated about the aquaoporin gene family in wheat will also provide a platform for predicting the function of genes of crops whose genome sequences are in their infancy.
Conclusions
The significance of the multigene family of aquaporin transmembrane proteins is emerging from studies aimed at optimizing water and nutrient use efficiency. Complete set of AQPs have been identified and classified in some agriculturally important crops with well-determined genomic sequences. Though the global importance of wheat as a most important cereal grain in world trade is well established, its AQPs remain less studied to date because of the lack of wheat genomic sequence information. The goal of this study was to identify new members of the aquaporin family in the wheat genome. Our combined approach enabled us to identify a total of 13 new aquaporin genes in wheat that showed significant sequence identity (>50% identity) with those from rice. A number of motifs and signature patterns were identified that are related to subcellular localization and functional annotation. Characterization of SNPs in candidate genes for drought tolerance such as aquaporin is a promising approach for identifying alleles that are associated with drought phenotypes. The aquaporin gene obtained in this work thus provides further tools for the physical and genetic mapping of these important genes, for identifying their chromosomal locations or genetic linkage to water homeostasis-related traits, respectively.
Supplementary Materials
Supplementary Figure 1
Transmemebrane α helix from the amino acid sequence of wheat AQPs based on SMART analysis.
Supplementary Figure 2
Multiple sequence alignment of wheat aquaporins. Deduced amino acid sequences were aligned using the ClustalW program. NPA motifs, black box. The MIP family signature sequences are in red box and the consensus phosphorylation site located in the C-terminal region is shaded yellow.
Supplementary Figure 3
Model structure of PIP evaluated by Ramachandran’s plot.
Supplementary Table 1
The ClustalW multiple sequence alignment of identified wheat aquaporin protein sequences.
Supplementary Table 2
A list of the EST based SNP primers designed for aquaporin.
Supplementary Table 3
List of released Indian wheat genotypes used in this study.
Acknowledgments
This study is part of the requirements for BP’s doctoral degree in Biotechnology. The financial support for Agri-Bioinformatics Promotion Program provided by Bioinformatics Initiative Division, Department of Information Technology, Ministry of Communications and Information Technology, Government of India, New Delhi is gratefully acknowledged.
Footnotes
Author Contributions
Conceived and designed the experiments: PS, BP. Analyzed the data: BP. Wrote the first draft of the manuscript: BP, PS. Contributed to the writing of the manuscript: BP, PS. Agree with manuscript results and conclusions: BP, DMP, PS, RC, IS. Jointly developed the structure and arguments for the paper: BP, PS. Made critical revisions and approved final version: BP, PS, DMP, RC, IS. All authors reviewed and approved of the final manuscript.
Competing Interests
Author(s) disclose no potential conflicts of interest.
Disclosures and Ethics
As a requirement of publication the authors have provided signed confirmation of their compliance with ethical and legal obligations including but not limited to compliance with ICMJE authorship and competing interests guidelines, that the article is neither under consideration for publication nor published elsewhere, of their compliance with legal and ethical guidelines concerning human and animal research participants (if applicable), and that permission has been obtained for reproduction of any copyrighted material. This article was subject to blind, independent, expert peer review. The reviewers reported no competing interests.
Funding
This work was partially funded by Indian Council of Agricultural Research (ICAR) Grant-in-Aid DWR/RP/2010-5.3 to PS and support from Agri-Bioinformatics Promotion Program of Ministry of Communications and Information Technology, New Delhi to RC.
References
- 1.William A, Alain B, Maarten V. The world wheat book: A history of wheat breeding, New York. Lavoisier. 2011:2. [Google Scholar]
- 2.Lian HL, Yu X, Lane D, Sun WN, Tang ZC, Su WA. Upland rice and lowland rice exhibited different PIP expression under water deficit and ABA treatment. Cell Res. 2006;16:651–60. doi: 10.1038/sj.cr.7310068. [DOI] [PubMed] [Google Scholar]
- 3.Hachez C, Chaumont F. Aquaporins: a family of highly regulated multifunctional channels. Adv Exp Med Biol. 2010;679:1–17. doi: 10.1007/978-1-4419-6315-4_1. [DOI] [PubMed] [Google Scholar]
- 4.Kaldenhoff R, Ribas-Carbo M, Sans JF, Lovisolo C, Heckwolf M, Uehlein N. Aquaporins and plant water balance. Plant Cell Environ. 2008;31:658–66. doi: 10.1111/j.1365-3040.2008.01792.x. [DOI] [PubMed] [Google Scholar]
- 5.Wudick MM, Luu DT, Maurel C. A look inside: localization patterns and functions of intracellular plant aquaporins. New Phytol. 2009;184(2):289–302. doi: 10.1111/j.1469-8137.2009.02985.x. [DOI] [PubMed] [Google Scholar]
- 6.Gustavsson S, Lebrun A, Norden K, Chaumont F, Johanson U. A novel plant major intrinsic protein in Physcomitrella patens most similar to bacterial glycerol channels. Plant Physiol. 2005;139:287–95. doi: 10.1104/pp.105.063198. [DOI] [PMC free article] [PubMed] [Google Scholar]
- 7.Suga S, Komatsu S, Maeshima M. Aquaporin isoforms responsive to salt and water stresses and phytohormones in radish seedlings. Plant Cell Physiol. 2002;43:1229–37. doi: 10.1093/pcp/pcf148. [DOI] [PubMed] [Google Scholar]
- 8.Aroca R, Amodeo G, Fernandez-Illescas S, Herman EM, Chaumont F, Chrispeels MJ. The role of aquaporins and membrane damage in chilling and hydrogenperoxide induced changes in the hydraulic conductance of maize roots. Plant Physiol. 2005;137(1):341–53. doi: 10.1104/pp.104.051045. [DOI] [PMC free article] [PubMed] [Google Scholar]
- 9.Kirch HH, Vera-Estrella R, Golldack D, et al. Expression of water channel proteins in Mesembryanthemum crystallinum. Plant Physiol. 2000;123(1):111–24. doi: 10.1104/pp.123.1.111. [DOI] [PMC free article] [PubMed] [Google Scholar]
- 10.Alexandersson E, Fraysse L, Sjövall-Larsen S, et al. Whole gene family expression and drought stress regulation of aquaporins. Plant Mol Biol. 2005;59(3):469–84. doi: 10.1007/s11103-005-0352-1. [DOI] [PubMed] [Google Scholar]
- 11.Forrest KL, Bhave M. Major intrinsic proteins (MIPs) in plants: a complex gene family with major impacts on plant phenotype. Funct Integr Genom. 2007;7:263–89. doi: 10.1007/s10142-007-0049-4. [DOI] [PubMed] [Google Scholar]
- 12.Forrest KL, Bhave M. The PIP and TIP aquaporins in wheat form a large and diverse family with unique gene structures and functionally important features. Funct Integr Genomics. 2008;8:115–33. doi: 10.1007/s10142-007-0065-4. [DOI] [PubMed] [Google Scholar]
- 13.DaInes O. Doctoral Dissertation. München: LMU München; 2008. Functional analysis of PIP2 aquaporins in Arabidopsis thaliana. [Google Scholar]
- 14.Quigley F, Rosenberg JM, Shachar-Hill Y, Bohnert HJ. From genome to function: the Arabidopsis aquaporins. Genome Biol. 2002;3(1):RESEARCH0001. doi: 10.1186/gb-2001-3-1-research0001. [DOI] [PMC free article] [PubMed] [Google Scholar]
- 15.Sakurai J, Ishikawa F, Yamaguchi T, Uemura M, Maeshima M. Identification of 33 rice aquaporin genes and analysis of their expression and function. Plant Cell Physiol. 2005;46(9):1568–77. doi: 10.1093/pcp/pci172. [DOI] [PubMed] [Google Scholar]
- 16.Fouquet R, Leon C, Ollat N, Barrieu F. Identification of grapevine aquaporins and expression analysis in developing berries. Plant Cell Rep. 2008;27:1541–50. doi: 10.1007/s00299-008-0566-1. [DOI] [PubMed] [Google Scholar]
- 17.Danielson JA, Johanson U. Unexpected complexity of the aquaporin gene family in the moss Physcomitrella patens. BMC Plant Biol. 2008;8:45. doi: 10.1186/1471-2229-8-45. [DOI] [PMC free article] [PubMed] [Google Scholar]
- 18.Gupta AB, Sankararamakrishnan R. Genome-wide analysis of major intrinsic proteins in the tree plant Populus trichocarpa: characterization of XIP subfamily of aquaporins from evolutionary perspective. BMC Plant Biol. 2009;9:134. doi: 10.1186/1471-2229-9-134. [DOI] [PMC free article] [PubMed] [Google Scholar]
- 19.Chaumont F, Barrieu F, Wojcik E, Chrispeels MJ, Jung R. Aquaporins constitute a large and highly divergent protein family in maize. Plant Physiol. 2001;125(3):1206–15. doi: 10.1104/pp.125.3.1206. [DOI] [PMC free article] [PubMed] [Google Scholar]
- 20.Javot H, Maurel C. The role of aquaporins in root water uptake. Ann Bot. 2003;90:301–13. doi: 10.1093/aob/mcf199. [DOI] [PMC free article] [PubMed] [Google Scholar]
- 21.Fetter K, Van Wilder V, Moshelion M, Chaumont F. Interactions between plasma membrane aquaporins modulate their water channel activity. Plant Cell. 2004;16(1):215–28. doi: 10.1105/tpc.017194. [DOI] [PMC free article] [PubMed] [Google Scholar]
- 22.Morillon R, Lassalles JP. Water deficit during root development: effects on the growth of roots and osmotic water permeability of isolated root protoplasts. Planta. 2002;214(3):392–9. doi: 10.1007/s004250100626. [DOI] [PubMed] [Google Scholar]
- 23.Lian HL, Yu X, Ye Q, et al. The role of aquaporin RWC3 in drought avoidance in rice. Plant Cell Physiol. 2004;45:481–9. doi: 10.1093/pcp/pch058. [DOI] [PubMed] [Google Scholar]
- 24.Houde M, Belcaid M, Ouellet F, et al. Wheat EST resources for functional genomics of abiotic stress. BMC Genomics. 2006;7:149. doi: 10.1186/1471-2164-7-149. [DOI] [PMC free article] [PubMed] [Google Scholar]
- 25.Liu Y, He Z, Appels R, Xia X. Functional markers in wheat: current status and future prospects. Theor Appl Gen. 2012;125:1–10. doi: 10.1007/s00122-012-1829-3. [DOI] [PubMed] [Google Scholar]
- 26.Huang X, Madan A. CAP3: A DNA sequence assembly program. Genome Res. 1999;9(9):868–77. doi: 10.1101/gr.9.9.868. [DOI] [PMC free article] [PubMed] [Google Scholar]
- 27.Tamura K, Dudley J, Nei M, Kumar S. MEGA4: Molecular Evolutionary Genetics Analysis (MEGA) software version 4.0. Mol Bio Evol. 2007;24:1596–9. doi: 10.1093/molbev/msm092. [DOI] [PubMed] [Google Scholar]
- 28.Hess B, Kutzner C, van der Spoel D, Lindahl E. GROMACS 4: algorithms for highly efficient, load-balanced, and scalable molecular simulation. J Chem Theory Comp. 2008;4:435–47. doi: 10.1021/ct700301q. [DOI] [PubMed] [Google Scholar]
- 29.Almeida-Rodriguez AM, Hacke UG, Laur J. Influence of evaporative demand on aquaporin expression and root hydraulics of hybrid poplar. Plant Cell Environ. 2011;34:1318–31. doi: 10.1111/j.1365-3040.2011.02331.x. [DOI] [PubMed] [Google Scholar]
- 30.Ayadi M, Cavez D, Miled N, Chaumont F, Masmoudi K. Identification and characterization of two plasma membrane aquaporins in durum wheat (Triticum turgidum L. subsp. durum) and their role in abiotic stress tolerance. Plant Physiol Biochem. 2011;49:1029–39. doi: 10.1016/j.plaphy.2011.06.002. [DOI] [PubMed] [Google Scholar]
- 31.Park W, Scheffler BE, Bauer PJ, Campbell BT. Identification of the family of aquaporin genes and their expression in upland cotton (Gossypium hirsutum L.) BMC Plant Biol. 2010;10:142. doi: 10.1186/1471-2229-10-142. [DOI] [PMC free article] [PubMed] [Google Scholar]
- 32.Yousif A, Bhave M. Identification of PIP aquaporin genes from wheat. World Aca Sci Eng Tech. 2011;59:2192–6. [Google Scholar]
- 33.Johansson I, Karlsson M, Shukla VK, Chrispeels MJ, Larsson C, Kjellbom P. Water transport activity of the plasma membrane aquaporin PM28A is regulated by phosphorylation. Plant Cell. 1998;10:451–9. doi: 10.1105/tpc.10.3.451. [DOI] [PMC free article] [PubMed] [Google Scholar]
- 34.Stone JM, Walker JC. Plant protein kinase families and signal transduction. Plant Physiol. 1995;108:451–7. doi: 10.1104/pp.108.2.451. [DOI] [PMC free article] [PubMed] [Google Scholar]
- 35.Takahashi Y, Shomura A, Sasaki T, Yano M. Hd6, a rice quantitative trait locus involved in photoperiod sensitivity, encodes the alpha subunit of protein kinase CK2. Proc Natl Acad Sci U S A. 2001;98(14):7922–7. doi: 10.1073/pnas.111136798. [DOI] [PMC free article] [PubMed] [Google Scholar]
- 36.Batistic O, Sorek N, Schültke S, Yalovsky S, Kudla J. Dual fatty acyl modification determines the localization and plasma membrane targeting of CBL/CIPK Ca2+ signaling complexes in Arabidopsis. Plant Cell. 2008;20:1346–62. doi: 10.1105/tpc.108.058123. [DOI] [PMC free article] [PubMed] [Google Scholar]
- 37.Benetka W, Mehlmer N, Maurer-Stroh S, et al. Experimental testing of predicted myristoylation targets involved in asymmetric cell division and calcium-dependent signalling. Cell Cycle. 2008;7(23):3709–19. doi: 10.4161/cc.7.23.7176. [DOI] [PubMed] [Google Scholar]
- 38.Heinen RB, Ye Q, Chaumont F. Role of aquaporins in leaf physiology. J Exp Bot. 2009;60:2971–85. doi: 10.1093/jxb/erp171. [DOI] [PubMed] [Google Scholar]
- 39.Barkla BJ, Vera-Estrella R, Pantoja O, Kirch HH, Bohnert HJ. Aquaporin localization—how valid are the TIP and PIP labels? Trends Plant Sci. 1999;4(3):86–8. doi: 10.1016/s1360-1385(99)01388-6. [DOI] [PubMed] [Google Scholar]
- 40.Zelazny E, Borst JW, Muylaert M, Batoko H, Hemminga MA, Chaumont F. FRET imaging in living maize cells reveals that plasma membrane aquaporins interact to regulate their subcellular localization. Proc Nat Acad Sci U S A. 2007;104:12359–64. doi: 10.1073/pnas.0701180104. [DOI] [PMC free article] [PubMed] [Google Scholar]
- 41.Zardoya R. Phylogeny and evolution of the major intrinsic protein family. Biol Cell. 2005;97:397–414. doi: 10.1042/BC20040134. [DOI] [PubMed] [Google Scholar]
- 42.Zardoya R, Villalba S. A phylogenetic framework for the aquaporin family in eukaryotes. J Mol Evol. 2001;52(5):391–404. doi: 10.1007/s002390010169. [DOI] [PubMed] [Google Scholar]
- 43.Audic S, Claverie JM. The significance of digital gene expression profiles. Genome Res. 1997;7:986–95. doi: 10.1101/gr.7.10.986. [DOI] [PubMed] [Google Scholar]
- 44.Jang JY, Kim DG, Kim YO, Kim JS, Kang H. An expression analysis of a gene family encoding plasma membrane aquaporins in response to abiotic stresses in Arabidopsis thaliana. Plant Mol Bio. 2004;54:713–25. doi: 10.1023/B:PLAN.0000040900.61345.a6. [DOI] [PubMed] [Google Scholar]
- 45.Mammadov J, Aggarwal R, Buyyarapu R, Kumpatla S. SNP markers and their impact on plant breeding. Int J Plant Genomics. 2012;2012:728398. doi: 10.1155/2012/728398. [DOI] [PMC free article] [PubMed] [Google Scholar]
- 46.Mondini L, Nachit M, Porceddu E, Pagnotta MA. Identification of SNP mutations in DREB1, HKT1, and WRKY1 genes involved in drought and salt stress tolerance in durum wheat (Triticum turgidum L. var durum) OMICS. 2012;16(4):178–87. doi: 10.1089/omi.2011.0081. [DOI] [PubMed] [Google Scholar]
- 47.Saini M, Sharma P, Sareen S, Sharma I. Validation of available molecular markers for heat tolerance in diverse bread wheat genotypes. International symposium on Plant Biotechnology Towards Tolerance to Stresses and Enhancing Crop Yield; 2011; BIT, Mesra, Ranchi. p. 91. [Google Scholar]
Associated Data
This section collects any data citations, data availability statements, or supplementary materials included in this article.
Supplementary Materials
Supplementary Figure 1
Transmemebrane α helix from the amino acid sequence of wheat AQPs based on SMART analysis.
Supplementary Figure 2
Multiple sequence alignment of wheat aquaporins. Deduced amino acid sequences were aligned using the ClustalW program. NPA motifs, black box. The MIP family signature sequences are in red box and the consensus phosphorylation site located in the C-terminal region is shaded yellow.
Supplementary Figure 3
Model structure of PIP evaluated by Ramachandran’s plot.
Supplementary Table 1
The ClustalW multiple sequence alignment of identified wheat aquaporin protein sequences.
Supplementary Table 2
A list of the EST based SNP primers designed for aquaporin.
Supplementary Table 3
List of released Indian wheat genotypes used in this study.


