

Abstract
A major challenge facing current mass spectrometry (MS)-based proteomics research is the large concentration range displayed in biological systems, which far exceeds the dynamic range of commonly available mass spectrometers. One approach to overcome this limitation is to improve online reversed-phase liquid chromatography (RP-LC) separation methodologies. LC mobile-phase modifiers are used to improve peak shape and increase sample load tolerance. Trifluoroacetic acid (TFA) is a commonly used mobile-phase modifier, as it produces peptide separations that are far superior to other additives. However, TFA leads to signal suppression when incorporated with electrospray ionization (ESI), and thus, other modifiers, such as formic acid (FA), are used for LC-MS applications. FA exhibits significantly less signal suppression, but is not as effective of a modifier as TFA. An alternative mobile-phase modifier is the combination of FA and ammonium formate (AF), which has been shown to improve peptide separations. The ESI-MS compatibility of this modifier has not been investigated, particularly for proteomic applications. This work compares the separation metrics of mobile phases modified with FA and FA/AF and explores the use of FA/AF for the LC-MS analysis of tryptic digests. Standard tryptic-digest peptides were used for comparative analysis of peak capacity and sample load tolerance. The compatibility of FA/AF in proteomic applications was examined with the analysis of soluble proteins from canine prostate carcinoma tissue. Overall, the use of FA/AF improved online RP-LC separations and led to significant increases in peptide identifications with improved protein sequence coverage.
Keywords: liquid chromatography, mass spectrometry, proteomics, tandem mass spectrometry
INTRODUCTION
A major challenge facing mass spectrometry (MS)-based proteomics is the large concentration range of proteins expressed by biological systems, which far exceeds the dynamic range of any available mass spectrometer.1 For example, the concentration range of human serum proteins exceeds 10 orders of magnitude.2 While there are many techniques available to help improve on this limitation, there is currently no definitive solution to resolve this challenge.3–5 One way to address the dynamic range limitation is to improve separation methodologies. The most common measure of separation capability in gradient elution chromatography is peak capacity, a metric that has shown correlation to peptide identifications in proteomic applications. It has been demonstrated that improvements in peak capacity lead to increased peptide identifications and enhanced protein sequence coverage.6,7 The increase in peptide identifications is a result of the reduction of coeluting components, which decreases the number of peptides that competes for ionization. Improved peak capacity can be achieved with several different approaches.
One manner to improve peak capacity involves the use of high-efficiency, reversed-phase (RP), column-packing materials. Recent developments in HPLC instrumentation and column-packing materials are permitting highly efficient separations with sub-2-μm-diameter particles.8–10 These sub-2-μm particles provide high-peak capacities but generate back pressures requiring ultra-high pressure liquid chromatography (LC) instruments.11 An attractive alternative is superficially porous particles, which show similar separation characteristics as sub-2-μm particles, including small theoretical plate heights and high peak capacities, but columns packed with these particles operate at back pressures (<350 bar) compatible with standard capillary LC instruments.12–14
Another available technique to improve peak capacity is with mobile-phase modifiers. Peptide separations using TFA as a modifier are far superior to those obtained when formic acid (FA) is used as a modifier. However, TFA is not compatible with electrospray ionization (ESI) MS because of signal suppression from ion pairing and spray instability from surface-tensions effects.15–18 For this reason, FA is probably the most common mobile-phase modifier used with LC-MS-based proteomics. Unfortunately, this is a compromise, as TFA is the superior modifier, and chromatograms obtained with FA exhibit significant band-broadening and peak-tailing.10 An explanation of this poor performance is the very low ionic strength exhibited by FA solutions (0.2 M FA; ionic strength=1.9 mM) compared with solutions of TFA (0.0079 M TFA; ionic strength=7.8 mM).19 Consequently, a strategy to improve peptide separations would be the use of a mobile-phase modifier with a higher ionic strength. McCalley19 reported that the addition of 7 mM ammonium formate (AF) to FA mobile phases nearly quadruples (7.4 mM) ionic strength, but only slightly increases the pH (FA=2.7; FA with ammonium formate=3.3). Other investigators have shown that mobile phases modified with FA/AF provide similar separation characteristics to those obtained using mobile phases modified with TFA.10,20,21
The addition of AF to FA mobile phases can also improve sample load tolerance. FA has consistently shown high sensitivity to column overloading, especially true for basic analytes.22,23 Basic analytes, including peptides, exhibit poor peak shape and significant peak tailing as a result of repulsion effects between ions of the same charge.19,24,25 Under RP conditions, including low pH, it has been shown that the overloading of basic peptides occurs at significantly lower sample loads when compared with neutral molecules.26–28 FA/AF has been shown to provide much higher sample load tolerance, similar to TFA, even for basic peptides.10
The resemblance of FA/AF to TFA in terms of separation characteristics makes it a potential candidate for use as a mobile-phase modifier in LC-MS; however, no systematic investigation has been conducted that evaluates the ability of FA/AF to permit the efficient ionization of peptide analytes. Therefore, this work aims to explore the LC-MS/MS compatibility of FA/AF as a mobile-phase modifier and assess its impact on chromatographic metrics, sample load tolerance, protein identification, and protein sequence coverage.
MATERIALS AND METHODS
Data were acquired using an Agilent 1100 capillary LC system (Palo Alto, CA, USA), with a 0.2 × 50-mm or a 0.2 × 150-mm HALO Peptide ES-C18 capillary column packed with 2.7 μm-diameter superficially porous particles (Advanced Materials Technology, Wilmington, DE, USA). Online MS detection used a Thermo Fisher LTQ ion trap mass spectrometer (San Jose, CA, USA) with a captive spray interface (Michrom Bioresources, Auburn, CA, USA). Proteomic sample analysis used the LTQ divert valve fitted with an EXP Stem Trap 2.6 μL cartridge packed with HALO Peptide ES-C18 2.7 μm-diameter superficially porous particles (Optimize Technologies, Oregon City, OR, USA). Mobile phases used FA, AF, and acetonitrile from Sigma-Aldrich (St. Louis, MO, USA).
Mobile-phase modifiers were evaluated using two sets of gradient and column conditions. The short-column/fast-gradient conditions were conducted using a 0.2 × 50-mm HALO Peptide ES-C18 column, operated at a flow rate of 9 μL/min. Gradient conditions increased the concentration of mobile-phase B from 5% to 60% over 12.5 min. Mobile-phase modifiers were also evaluated under long-column/slow-gradient conditions using a 0.2 × 150-mm HALO Peptide ES-C18 column operated at 4 μL/min, increasing mobile-phase B concentration from 5% to 60% over 90 min. For FA mobile-phase modifiers: mobile-phase A consisted of 99.9% water and 0.1% FA, and mobile-phase B contained 99.9% acetonitrile and 0.1% FA; for FA/AF mobile-phase modifiers: mobile-phase A consisted of 99.9% water, 0.1% FA, adjusted to 10 mM AF (by addition of solid), and mobile-phase B consisted of 80% acetonitrile, 0.1% FA, and 10 mM AF. Under FA/AF conditions, the gradient slope was adjusted to account for the change in acetonitrile concentration by increasing mobile-phase B concentration from 6.25% to 75% B over 12.5 or 90 min. The mass spectrometer performed MS/MS analysis on the top five most-abundant ions for the 21-min experiment and top 8 most-abundant ions for the 140-min experiment. All experimental conditions used 1 microscan, with a maximum injection time of 50 ms.
Tryptic peptides from BSA (Michrom Bioresources) were used to evaluate MS and separation metrics. All analysis of separation metrics with BSA tryptic peptides were conducted from duplicate experiments of 1 pmol or 8 pmol sample injections. Peak capacity and peak asymmetry measurements were made without the collection of MS/MS spectra to increase the number of data points collected across each chromatographic peak. Calculation of peak capacity was based on the selection of 14 BSA tryptic peptides listed in Table 1. Theses peptides were selected to provide a wide range of retention for accurate evaluation of both mobile-phase modifiers. Calculations of peak capacities were conducted using two methods, each with a different measurement of time. Equation 1—measured peak capacity (nMpc)—was calculated using the retention times of the first and last eluting peptides (ti and tf, respectively) from Table 1. Equation 2—
theoretical peak capacity (nTpc)—used the actual length of the gradient (Tg) for retention time, independent of actual peptide retention times. The value for Tg was 750 or 5400 s.
Theoretical peak capacity was calculated to provide a measure of peak capacity, independent of sample retention times, to demonstrate the maximum peak capacity obtainable for each mobile-phase/gradient condition. Peak capacity and peak asymmetry measurements were made using Xcalibur software. Peak asymmetry was calculated using peak widths at 10% peak height, and peak capacity calculations were conducted by measurement of peak widths at 50% peak height (W1/2) via manual inspection with the use of extracted ion chromatograms. Signal-intensity measurements were made via extracted ion chromatograms through Xcalibur software.
Table 1.
BSA Tryptic Peptides Used for Chromatographic Analysis and Peak Capacity Calculations
| Sequence | Peptide mass (Da) | Retention time 50 mm column: FA | Retention time 50 mm column: FA/AF | Retention time 150 mm column: FA | Retention time 150 mm column: FA/AF |
|---|---|---|---|---|---|
| CASIQK | 705.82 | 6.62 | 7.27 | 24.92 | 28.01 |
| LVTDLTK | 788.93 | 7.80 | 8.35 | 33.60 | 35.39 |
| QTALVELLK | 1014.22 | 8.92 | 9.06 | 38.95 | 37.86 |
| EACFAVEGPK | 1107.24 | 6.59 | 7.06 | 23.15 | 26.56 |
| KQTALVELLK | 1142.39 | 8.32 | 8.67 | 34.36 | 37.04 |
| SLHTLFGDELCK | 1419.60 | 8.77 | 9.16 | 38.23 | 41.03 |
| YICDNQDTISSK | 1443.54 | 6.53 | 6.88 | 21.51 | 22.54 |
| LGEYGFQNALIVR | 1479.68 | 9.39 | 9.39 | 42.31 | 42.54 |
| MPCTEDYLSLILNR | 1724.00 | 11.12 | 10.72 | 54.60 | 53.00 |
| LFTFHADICTLPDTEK | 1908.14 | 9.52 | 9.59 | 43.08 | 43.80 |
| DAIPENLPPLTADFAEDKDVCK | 2459.68 | 9.63 | 9.47 | 43.78 | 43.22 |
| GLVLIAFSQYLQQCPFDEHVK | 2492.84 | 11.78 | 11.58 | 61.66 | 58.74 |
| QEPERNECFLSHKDDSPDLPK | 2541.70 | 7.01 | 7.65 | 57.11 | 55.38 |
| TVMENFVAFVDKCCAADDKEACFAVEGPK | 3310.71 | 11.20 | 10.78 | 55.72 | 54.56 |
Proteomic analysis was conducted using proteins extracted from canine prostatic carcinoma tissue. Soluble proteins from canine prostate tissue underwent electrophoresis through a NuPAGE 12% Bis-Tris gel (Invitrogen, Carlsbad, CA, USA), with the entire lane removed for composite analysis. This step was aimed to remove undesirable nonprotein containments, with negligible protein separation; hence, the entire lane was treated as a single sample. Each gel lane was cut into 1 × 1-mm squares for digestion. Water was then added to the gel pieces and discarded to waste. Gel pieces were then washed with a mixture of 50% acetonitrile and 50% water, with solution removed as waste after 15 min. Ammonium bicarbonate (100 mM) was then added, and after 15 min, an equal volume of acetonitrile was added to make a 1:1 (v:v) solution. After incubation at room temperature for 15 min, the ammonium bicarbonate/acetonitrile solution was removed to waste. Acetonitrile was added again to the gel slices and incubated at room temperature for 15 min. This solution was then removed as waste. A solution of 10 mM DTT in 100 mM ammonium bicarbonate was then added and incubated in a 65°C water bath for 1 h. The reducing solution was then removed, and a 55-mM iodoacetamide in 100 mM ammonium bicarbonate alkylating solution was added. Samples were incubated at room temperature for 1 h in the dark. The alkylating solution was then removed, and 100 mM ammonium bicarbonate was added. After 5 min, an equal volume of acetonitrile was added to make a 1:1 (v:v) solution. After 15 min of incubation, this solution was removed to waste. A solution of 0.1% sequencing-grade trypsin (Promega, San Luis Obispo, CA, USA) was made in 100 mM ammonium bicarbonate and added to the gel pieces at 1:50 (w:w) enzyme:protein; the resulting mixture was digested overnight at 37°C. The following day, peptides were extracted by collecting the solution from gel pieces, and then a solution of 50% acetonitrile and 0.1% FA was added to the gel pieces. After 15 min, this solution was extracted for pooling with the solution pulled previously from the digested gel slices. Canine proteomic analysis was conducted using 1 μg protein with triplicate analysis for each mobile-phase modifier condition.
Raw tandem mass spectra were converted to mzXML files, then into Mascot generic files (MGF) via the Trans-Proteomic Pipeline (Seattle Proteome Center, Seattle, WA, USA). MGF files were searched using Mascot (Matrix Scientific, Boston, MA, USA) against target and decoy National Center for Biotechnology Information databases for canine proteins. Mascot settings were as follows: tryptic enzymatic cleavages allowing for up to two missed cleavages, peptide tolerance of 1000 parts/million, fragment ion tolerance of 0.6 Da, fixed modification as a result of carboxyamidomethylation of cysteine (+57 Da), and variable modifications of oxidation of methionine (+16 Da) and deamidation of asparagine or glutamine (+0.98 Da). To examine peptide and protein identifications using a 5% false discovery rate, Mascot .dat target and decoy search files were loaded into ProteoIQ (NuSep, Bogart, GA, USA). Protein identifications were confirmed with the application of a 5% protein false discovery rate and inspection of peptide MS/MS data.
RESULTS
Standard Tryptic Peptide Analysis
Peak capacity, the most commonly used assessment of separation power in gradient elution chromatography, was calculated to examine the impact of AF addition on separation efficiency. In all conditions evaluated, AF improved peak capacity. For low-sample load conditions (1 pmol BSA), peak widths at half-height were reduced by 15% with AF compared with FA alone, producing average peak widths of 3.6 and 14 s for 50 mm and 150 mm columns, respectively (Table 2). AF also reduced variability of peak widths, evaluated by the improvements in the sd of the peak widths. The decreased peak widths led to a 30% increase in measured peak capacity for both column lengths analyzed. This reduction in peak width also increased theoretical peak capacity. The 50-mm column obtained a theoretical peak capacity >120 during a 12.5-min gradient, and the 150-mm column produced a theoretical peak capacity of ∼230 during a 90-min gradient. A demonstration of the improved peak shape and reduced peak widths observed with the use of AF is provided in Figs. 1 and 2. Figure 1 displays chromatographic peaks for an early eluting peptide, CASIQK, with and without the presence of AF in the mobile phase, whereas Fig. 2 compares a late eluting peptide, GLVLIAFSQYLQQCPFDEHVK. As shown in both figures, chromatograms obtained with FA/AF-modified mobile phases contain narrower, more symmetrical peaks.
Table 2.
Peak Widths and Peak Capacities Obtained from LC-MS Analysis of 1 pmol Injections of Tryptic BSA Peptides Using Various Chromatographic Conditions with Each Mobile-Phase Modifier
| Column length (mm) | Flow rate (μL/min) | Gradient length (min) | Mobile-phase modifier | Average peak width (s) | sd | Measured peak capacity | Theoretical peak capacity |
|---|---|---|---|---|---|---|---|
| 50 | 9 | 12.5 | 0.1% FA | 4.14 | 0.94 | 35.21 | 106.56 |
| 50 | 9 | 12.5 | 0.1% FA, 10 mM AF | 3.56 | 0.69 | 46.60 | 123.93 |
| 150 | 4 | 90 | 0.1% FA | 16.11 | 2.98 | 76.30 | 197.17 |
| 150 | 4 | 90 | 0.1% FA, 10 mM AF | 13.99 | 2.35 | 99.55 | 227.05 |
Figure 1.

The extracted ion chromatograms of the peptide CASIQK, which eluted early in the 90-min gradient, from LC-MS analysis of 1 pmol tryptic-digested BSA. Data were collected using a 0.2 × 150-mm column. Extracted ion chromatogram (A) was obtained using only FA as the mobile-phase modifier, whereas extracted ion chromatogram (B) was obtained using FA and 10 mM AF as the mobile-phase modifier.
Figure 2.

The extracted ion chromatograms of peptide GLVLIAFSQYLQQCPFDEHVK, which eluted late in the 90-min gradient, from LC-MS analysis of 1 pmol tryptic-digested BSA. Data were collected using a 0.2 × 150-mm column. (A) Extracted ion chromatogram obtained using only FA as the mobile-phase modifier. (B) Extracted ion chromatogram obtained using FA and 10 mM AF as the mobile-phase modifier.
FA is very sensitive to sample overload, particularly for basic analytes, including peptides.22,23 The addition of AF has been shown previously to improve sample load tolerance compared with FA alone.10 To examine sample load tolerance with application to LC-MS, peak capacity experiments were repeated with sample load increased by a factor of 8. Column overload was expected for both mobile-phase conditions at this high sample mass, but FA/AF mobile phases showed significantly higher tolerance to sample overloading as displayed by less peak broadening and improved peak capacity compared with the mobile phases containing only FA (shown in Table 3). In FA mobile phases, the average peak width nearly doubled with the increased sample load, whereas peak widths only increased by ∼25% with FA/AF. Figure 3 displays the chromatographic peaks for peptide CASIQK as the amount of sample is increased and displays the significant improvements in peak widths and peak shape observed with the FA/AF mobile phases. FA/AF again displayed superior peak width variance with sd significantly smaller than those from the FA-only condition. The increased sample load decreased peak capacity for both mobile-phase modifiers, but FA/AF produced significantly higher peak capacities for each column/gradient condition examined. The high sample mass injections decreased peak capacity by ∼40% with FA, whereas FA/AF conditions only experienced an ∼16% reduction in peak capacity. Direct comparison of peak capacities using 8 pmol BSA data showed that FA/AF produced a peak capacity (measured and theoretical) that was nearly double that of FA conditions, regardless of column length. The importance of this observation is significant to the application of proteomics, as typical proteomic samples will display a wide concentration range, with high-abundance peptides routinely overloading typical analytical columns.
Table 3.
Peak Widths and Peak Capacities Obtained from LC-MS Analysis of 8 pmol Injections of Tryptic BSA Peptides Using Various Chromatographic Conditions with Each Mobile-Phase Modifier
| Column length (mm) | Flow rate (μL/min) | Gradient length (min) | Mobile-phase modifier | Average peak width (s) | sd | Peak width changea | Measured peak capacity: 8 pmol | Actual peak capacity changeb | Theoretical peak capacity: 8 pmol | Theoretical peak capacity changeb |
|---|---|---|---|---|---|---|---|---|---|---|
| 50 | 9 | 12.5 | 0.1% FA | 7.78 | 4.57 | +87.9% | 21.19 | −39.8% | 56.71 | −46.8% |
| 50 | 9 | 12.5 | 0.1% FA, 10 mM AF | 4.43 | 1.21 | +24.4% | 38.72 | −16.9% | 99.59 | −19.6% |
| 150 | 4 | 90 | 0.1% FA | 29.1 | 16.11 | +80.6% | 44.18 | −42.1% | 109.16 | −44.6% |
| 150 | 4 | 90 | 0.1% FA, 10 mM AF | 16.82 | 2.64 | +20.2% | 83.54 | −16.0% | 188.85 | −16.8% |
Calculated by taking the difference in average peak width from 1 pmol and 8 pmol BSA tryptic peptide injections and expressing as a percentage of the average peak width observed using 1 pmol BSA injections.
Calculated by taking the difference in peak capacity from 1 pmol and 8 pmol BSA tryptic peptide injections and expressing as a percentage of the peak capacity measured using 1 pmol BSA injections.
Figure 3.
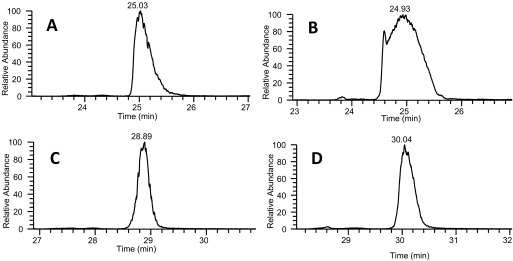
A comparison of extracted ion chromatograms of the peptide CASIQK, as sample load is increased by a factor of eight. Data were collected from LC-MS analysis of tryptic-digested BSA using a 0.2 × 150-mm column. (A) Extracted ion chromatogram from 1 pmol BSA with only FA as the mobile-phase modifier. (B) Extracted ion chromatogram from 8 pmol BSA with only FA as the mobile-phase modifier. (C) Extracted ion chromatogram from 1 pmol BSA with FA and 10 mM AF as the mobile-phase modifier. (D) Extracted ion chromatogram from 8 pmol BSA with FA and 10 mM AF as the mobile-phase modifier.
While peak capacity provides a good assessment of separation power, peak widths are measured at half-height, which does not provide an assessment of peak shape or peak tailing. To evaluate the impact of AF on peak shape/tailing, peak asymmetry factors were calculated. Improved peak shape will improve the separation by reducing the number of peptides that coelute, which in turn, will help overcome the dynamic range limitations with mass spectrometers that use data-dependent acquisition strategies (for example, see Johnson et al.)29 Peak asymmetry factors obtained in the analysis of BSA tryptic peptides are presented in Table 4, with measurements conducted at 10% peak height. FA/AF produced better peak shape and decreased peak tailing as seen in Table 4. At a sample load of 1 pmol, FA/AF produced less peak tailing, as demonstrated from peak asymmetry factors being closer to one when compared with FA conditions. Data also showed improvements in peak asymmetry sd, indicating less variance of peak shape with FA/AF. When high sample mass (8 pmol) was examined, FA/AF improved peak shape significantly, with 150 mm column data showing peak asymmetry factors that were almost three times smaller than those produced with FA alone.
Table 4.
Peak Asymmetry Obtained from LC-MS Analysis of 1 and 8 pmol Injections of Tryptic BSA Peptides Using Various Chromatographic Conditions with Each Mobile-Phase Modifier
| Column length (mm) | Flow rate (μL/min) | Gradient length (min) | Mobile-phase modifier | Peak asymmetry: 1 pmol BSA | sd | Peak asymmetry: 8 pmol BSA | sd |
|---|---|---|---|---|---|---|---|
| 50 | 9 | 12.5 | 0.1% FA | 1.49 | 0.88 | 2.14 | 1.48 |
| 50 | 9 | 12.5 | 0.1% FA, 10 mM AF | 1.22 | 0.43 | 1.63 | 0.82 |
| 150 | 4 | 90 | 0.1% FA | 2.24 | 1.25 | 6.08 | 4.48 |
| 150 | 4 | 90 | 0.1% FA, 10 mM AF | 1.18 | 0.40 | 2.18 | 1.67 |
The impact of AF on ionization efficiency and evaluation of signal suppression were also examined during BSA tryptic peptide samples. AF increases ionic strength of mobile phases, which should increase ion pairing and thus, may lead to ESI signal suppression. Although some degree of signal suppression was expected, decreased peak widths should increase signal intensity as a result of increased peptide concentration because of narrower chromatographic peaks. Initially, 20 mM AF was explored for LC-MS, which showed improved separation metrics, but mass spectral signal intensity was reduced by approximately one order of magnitude for all examined peptides (data not shown). A compromise of 10 mM was chosen, balancing the benefits of improved chromatography without significant sacrifice of mass spectral signal. Extracted ion chromatograms were examined to compare signal intensity between the two mobile-phase modifiers, using the BSA tryptic peptides shown in Table 1. Minor differences in signal intensities were observed, but these were less than one-half an order of magnitude for all peptides examined. For some peptides, AF increased MS signal intensities, whereas in others, the presence of ammonium reduced MS signal intensities. Measured signal intensities of four peptides, each containing different combinations of the basic amino acid residues lysine, arginine, and histidine, are presented in Tables 5 (50 mm column) and 6 (150 mm column). The potential ion pairing would occur at these basic amino acid residue sites as a result of protonation in low mobile-phase pH. As differences in mass spectra signal intensities seemed to even out between the mobile-phase conditions, it was concluded that signal suppression would not be detrimental to MS analysis.
Table 5.
Extracted Ion Chromatogram Signal Intensity from LC-MS Analysis of BSA Tryptic Peptides Using a 0.2 × 50-mm Column
| Sequence | FA: 1 pmol BSA | FA/AF: 1 pmol BSA | Δ%a: 1 pmol BSA | FA: 8 pmol BSA | FA/AF: 8 pmol BSA | Δ%a: 8 pmol BSA |
|---|---|---|---|---|---|---|
| QTALVELLK | 6.03e4 | 2.67e5 | −343 | 3.61e5 | 3.09e5 | 14 |
| SLHTLFGDELCK | 4.78e5 | 6.70e5 | −40 | 6.94e5 | 3.26e5 | 53 |
| MPCTEDYLSLILNR | 9.98e4 | 3.10e4 | 69 | 6.55e5 | 1.80e5 | 73 |
| DAIPENLPPLTADFAEDKDVCK | 5.21e5 | 2.21e5 | 58 | 2.03e6 | 9.95e5 | 51 |
Δ% was calculated according to the following formula: (IFA−IFA/AF/IFA) × 100, where IFA is the intensity observed with FA for the sample load, and IFA/AF is the intensity observed with FA/AF for the same sample load. A negative value indicates that the peak area was greater with FA/AF compared with FA, whereas a positive value indicates that the peak area was greater with FA compared with FA/AF.
Table 6.
Extracted Ion Chromatogram Signal Intensity from LC-MS Analysis of BSA Tryptic Peptides Using a 0.2 × 150-mm Column
| Sequence | FA: 1 pmol BSA | FA/AF: 1 pmol BSA | Δ%a 1 pmol BSA | FA: 8 pmol BSA | FA/AF: 8 pmol BSA | Δ%a 8 pmol BSA |
|---|---|---|---|---|---|---|
| QTALVELLK | 2.64e4 | 4.20e4 | −59 | 2.71e5 | 3.68e5 | −36 |
| SLHTLFGDELCK | 5.54e4 | 4.52e4 | 18 | 3.29e5 | 3.47e5 | −5 |
| MPCTEDYLSLILNR | 5.04e4 | 1.46e4 | 71 | 5.09e5 | 5.33e5 | −5 |
| DAIPENLPPLTADFAEDKDVCK | 1.14e5 | 9.29e4 | 19 | 9.78e5 | 7.22e5 | 26 |
Δ% was calculated according to the following formula: (IFA−IFA/AF/IFA) × 100, where IFA is the intensity observed with FA for the sample load, and IFA/AF is the intensity observed with FA/AF for the same sample load. A negative value indicates that the peak area was greater with FA/AF compared with FA, whereas a positive value indicates that the peak area was greater with FA compared with FA/AF.
Proteomic Sample Analysis
The use of AF for proteomic analysis was examined using soluble proteins from canine prostate carcinoma tissue samples. Proteins underwent gel electrophoresis to remove nonprotein contaminants, but no electrophoretic gel fractionation occurred. This provided a very complex, authentic proteomic sample with which to compare mobile-phase modifiers. The addition of AF led to increased numbers of matched MS/MS spectra and peptide identifications, which resulted in an increase in protein identifications, as shown in Table 7. An ∼35% increase in protein identifications and a >50% increase in the number of matched MS/MS spectra were observed with the 50-mm column using FA/AF mobile phases when compared with FA data. The number of peptide identifications also increased by ∼30% during triplicate sample analysis. Data collected with a 150-mm column displayed similar trends seen with the shorter column. With the longer column, the addition of AF increased the number of protein identifications by almost 70%, and the number of matched MS/MS spectra nearly doubled. The number of peptide identifications also increased by ∼33% with FA/AF mobile phases. This analysis demonstrates the expected correlation between peptide identifications and peak capacity, as improved peak capacity, provided by the use of AF, leads to increased proteomic identifications for both column lengths analyzed. The number of matched MS/MS spectra/peptide identification, as well as the total number of MS/MS spectra acquired, were similar between each mobile-phase modifier condition, also confirming that any signal suppression from AF use was not detrimental to the proteomic sample analysis.
Table 7.
Proteomic Results from Canine Prostate Carcinoma Analysis Under Various Chromatographic Conditions for Each Mobile-Phase Modifier
| Column length (mm) | Flow rate (μL/min) | Experiment time (min) | Mobile-phase modifier | Protein IDsa | Matched MS/MS spectra | Peptide IDsa | Spectra/peptide IDb |
|---|---|---|---|---|---|---|---|
| 50 | 9 | 21 | 0.1% FA | 44 | 455 | 196 | 2.32 |
| 50 | 9 | 21 | 0.1% FA, 10 mM AF | 60 | 697 | 255 | 2.73 |
| 150 | 4 | 140 | 0.1% FA | 70 | 1142 | 359 | 3.18 |
| 150 | 4 | 140 | 0.1% FA, 10 mM AF | 118 | 2028 | 538 | 3.77 |
Results for each mobile-phase modifier generated from duplicate sample analysis with protein and peptide identifications validated using a 5% false discovery rate.
Total number of database-matched MS/MS spectra, divided by the total number of peptide identifications for each condition from triplicate sample analysis.
An evaluation of proteomic identifications was conducted from 150-mm column data, specifically comparing identifications and matched MS/MS spectra for the 61 proteins identified in both mobile-phase modifier conditions. Analysis of these common identifications showed that protein sequence coverage improved with FA/AF, as the average number of peptide identifications/protein increased, as shown in Table 8. The average number of spectral counts/protein identification also increased using FA/AF. Single-spectrum protein identifications were analyzed to determine whether chromatographic improvements enhanced protein coverage. Data from FA conditions included three single-spectrum protein identifications, whereas with FA/AF conditions, these same proteins were identified with multiple peptides and/or multiple MS/MS spectra. FA/AF conditions produced no single-spectrum identifications when comparing proteins identified in both mobile-phase conditions. The improvement in chromatography not only increased proteomic identifications but also improved these identifications as sequence coverage and peptide identifications increased, improving the confidence of these identifications.
Table 8.
Analysis of the 61 Proteins Commonly Identified Using Both Mobile-Phase Modifier Conditions from LC-MS/MS Analysis Canine Prostate Carcinoma Using a 0.2 × 150-mm Column
| Mobile-phase modifier | Average peptide IDs/proteina | Average spectral count/protein IDb | Single-spectrum protein IDsc |
|---|---|---|---|
| 0.1% FA | 6.60 | 20.71 | 3 |
| 0.1% FA, 10 mM AF | 9.64 | 28.56 | 0 |
The number of peptides identified from the 61 common identification proteins, divided by the number of common protein identifications.
The total number of database-matched MS/MS spectra from the 61 common identification proteins, divided by total of common protein identifications.
Protein identifications from only one single MS/MS spectra after application of a 5% false discovery rate.
The amino acid composition of identified peptides was examined, specifically focusing on peptides with multiple basic amino acid residues, as FA has traditionally been reported as a poor mobile-phase modifier for basic analytes. FA/AF conditions identified significantly more peptides with multiple basic amino acid sites, indicating that the improvements achieved in the separation of these peptides resulted in increased proteomic identifications. After application of a 5% peptide false discovery rate, 150 mm column data produced 150 peptides commonly identified using both mobile-phase conditions. Of those common identifications, 48% contained two or more basic amino acid residues. In FA conditions, 209 peptides were uniquely identified with 49% containing two or more basic amino acid residues. FA/AF identified 388 condition-unique peptides, with 72% of those containing multiple basic amino acid residues, shown in Fig. 4. While this increase in peptide identifications can be attributed to multiple factors, it appears that the improved sample load tolerance from increased ionic strength with the AF allowed for better chromatographic behavior and separation of peptides with multiple basic amino acid residues.
Figure 4.

For all peptides not identified in both mobile-phase modifier conditions, the amino acid composition was examined. Peptide identifications unique to FA-only mobile phases are displayed on the left, and peptide identifications unique to FA/AF mobile phases are shown on the right. Peptides containing two or more basic amino acid residues are represented in blue, and peptides containing only one basic amino acid are displayed in red. Data were collected during triplicate LC-MS/MS analysis of canine prostate carcinoma using a 0.2 × 150-mm column.
The increase in ionic strength displayed by FA/AF mobile phases has the potential to increase ion pairing, which in turn, could reduce the peptide-charge state. To examine this, peptide-charge states were analyzed using the charge state provided from Mascot database identifications. Figure 5 displays the charge state of all identified peptides—359 in FA and 538 in FA/AF. As expected, most peptides were identified in a +2 charge state. Only small differences were observed, with FA displaying a slightly higher percentage of peptides identified in a +3 charge state than FA/AF. For a direct comparison, the 150 peptides commonly identified in both mobile-phase conditions were examined, with almost 90% of these peptides identified in the same charge state (Fig. 6). Of the 16 peptides identified in a different charge state between the two mobile-phase modifiers, neither mobile-phase condition consistently produced identification in a higher charge state. Further analysis of these 150 common peptides showed 72 peptides containing two or more basic amino acid residues. Of these 72 peptides, 83% were identified from the same charge state, as shown in Fig. 7. Among the 12 peptides with multiple basic residues, FA produced a higher charge state in eight peptides, whereas FA/AF produced the higher identified charge state in four peptides. Analysis of peptide charge states showed very little difference between the two mobile-phase conditions, indicating that AF did not reduce the charge state significantly in the peptides identified nor was this mobile-phase modifier found to be detrimental to proteomic analysis.
Figure 5.

The charge state of all peptides identified during triplicate analysis of canine prostate carcinoma was investigated. Results display similar charge state identifications between the two mobile-phase modifiers. Peptides identified in the +1 charge state are shown in blue, +2 in red, and +3 in green. Data were collected using a 0.2 × 150-mm column.
Figure 6.

An analysis of peptide charge state was conducted for the 150 peptides identified in both mobile-phase modifier conditions from triplicate analysis of canine prostate carcinoma. Peptides identified in the same charge state are shown in blue. Peptides identified in a higher charge state in FA-only conditions are shown in red, and in a higher charge state in FA/10 mM AF are shown in green. Data were collected using a 0.2 × 150-mm column.
Figure 7.

Comparison of charge state was conducted for the 72 peptides that consisted of two or more basic amino acid residues and were identified in both mobile-phase modifier conditions. Peptides identified in a higher charge state in FA-only conditions are shown in red and in a higher charge state in FA/AF are displayed in green. Peptides identified in the same charge state are shown in blue. Data collected during triplicate analysis of canine prostate carcinoma using a 0.2 × 150-mm column.
DISCUSSION
The use of AF along with FA as a mobile-phase modifier was found to be compatible with LC-MS/MS analysis of peptides. Peak widths were reduced by ∼15%, leading to an increase of ∼30% in peak capacity when compared with FA-modified mobile phases. Significant improvements in peak shape were displayed by FA/AF when peak asymmetry factors were compared. Although some degree of signal suppression occurs with FA/AF, mass spectral signal intensities were comparable, demonstrating that signal suppression was not detrimental for peptide analysis.
Analysis of soluble proteins from canine prostate tissue displayed significant increases in peptide identifications and protein-sequence coverage with AF addition. The increase in peptide identifications can be directly attributed to improvement in separation metrics displayed with BSA peptide analysis. FA/AF showed better retention and separation of basic nature peptides, with improved identifications of peptides composed of multiple basic residues. Analysis of identified charge state showed no difference between FA/AF- and FA-modified mobile phases. An analysis of matched spectra and peptide analysis also confirmed that the degree of signal suppression observed in standard peptide analysis was not detrimental to peptide identifications. The high number of peptide identifications, as well as improved matched spectra/peptide identification, displayed with FA/AF, confirmed similar ionization efficiency between both mobile-phase modifiers.
ACKNOWLEDGMENTS
This work was supported by U.S. National Institutes of Health [GM077688 (J.J. Kirkland, Advanced Materials Technology Inc., Wilmington, DE 19810, USA, principal investigator) and GM093747 to B.B.] and the U.S. National Institutes of Health Integrated Technology Resource for Biomedical Glycomics grant P41 GM0103490 (to R.O.).
REFERENCES
- 1. Domon B, Aebersold R. Mass spectrometry and protein analysis. Science 2006;312:212–217 [DOI] [PubMed] [Google Scholar]
- 2. Anderson NL, Anderson NG. The human plasma proteome. Mol Cell Proteomics 2002;1:845–867 [DOI] [PubMed] [Google Scholar]
- 3. Chen CH. Review of a current role of mass spectrometry for proteome research. Anal Chim Acta 2008;624:16–36 [DOI] [PubMed] [Google Scholar]
- 4. Righetti PG, Castagna A, Herbert B, Reymond F, Rossier JS. Prefractionation techniques in proteome analysis. Proteomics 2003;3:1397–1407 [DOI] [PubMed] [Google Scholar]
- 5. Issaq HJ, Conrads TP, Janini GM, Veenstra TD. Methods for fractionation, separation and profiling of proteins and peptides. Electrophoresis 2002;23:3048–3061 [DOI] [PubMed] [Google Scholar]
- 6. Fairchild JN, Walworth MJ, Horváth K, Guiochon G. Correlation between peak capacity and protein sequence coverage in proteomics analysis by liquid chromatography-mass spectrometry/mass spectrometry. J Chromatogr A 2010;1217:4779–4783 [DOI] [PubMed] [Google Scholar]
- 7. Wang X, Stoll DR, Schellinger AP, Carr PW. Peak capacity optimization of peptide separations in reversed-phase gradient elution chromatography: fixed column format. Anal Chem 2006;78:3406–3416 [DOI] [PMC free article] [PubMed] [Google Scholar]
- 8. Salisbury JJ. Fused-core particles: a practical alternative to sub-2 micron particles. J Chromatogr Sci 2008;46:883–886 [DOI] [PubMed] [Google Scholar]
- 9. Fekete S, Fekete J, Ganzler K.Characterization of new types of stationary phases for fast liquid chromatographic applications. J Pharmaceut Biomed Anal 2009;50:703–709 [DOI] [PubMed] [Google Scholar]
- 10. Schuster SA, Boyes BE, Wagner BM, Kirkland JJ. Fast high performance liquid chromatography separations for proteomic applications using Fused-Core® silica particles. J Chromatogr A 2012;1228:232–241 [DOI] [PMC free article] [PubMed] [Google Scholar]
- 11. Nguyen DT, Guillarme D, Rudaz S, Veuthey JL. Fast analysis in liquid chromatography using small particle size and high pressure. J Separat Sci 2006;29:1836–1848 [DOI] [PubMed] [Google Scholar]
- 12. Schuster S, Wagner B, Boyes B, Kirkland J.Wider pore superficially porous particles for peptide separations by HPLC. J Chromatogr Sci 2010;48:566–571 [DOI] [PubMed] [Google Scholar]
- 13. Marchetti N, Guiochon G. High peak capacity separations of peptides in reversed-phase gradient elution liquid chromatography on columns packed with porous shell particles. J Chromatogr A 2007;1176:206–216 [DOI] [PubMed] [Google Scholar]
- 14. Kirkland JJ, Langlois TJ, DeStefano JJ. Fused core particles for HPLC columns. Am Lab 2007;39:18–21 [Google Scholar]
- 15. Apffel A, Fischer S, Goldberg G, Goodley PC, Kuhlmann FE. Enhanced sensitivity for peptide mapping with electrospray liquid chromatography-mass spectrometry in the presence of signal suppression due to trifluoroacetic acid-containing mobile phases. J Chromatogr A 1995;712:177–190 [DOI] [PubMed] [Google Scholar]
- 16. Gustavsson SÅ, Samskog J, Markides KE, Långström B. Studies of signal suppression in liquid chromatography—electrospray ionization mass spectrometry using volatile ion-pairing reagents. J Chromatogr A 2001;937:41–47 [DOI] [PubMed] [Google Scholar]
- 17. Eshraghi J, Chowdhury SK. Factors affecting electrospray ionization of effluents containing trifluoroacetic acid for high-performance liquid chromatography/mass spectrometry. Anal Chem 1993;65:3528–3533 [DOI] [PubMed] [Google Scholar]
- 18. Mirza UA, Chait BT. Effects of anions on the positive ion electrospray ionization mass spectra of peptides and proteins. Anal Chem 1994;66:2898–2904 [DOI] [PubMed] [Google Scholar]
- 19. McCalley DV. Effect of buffer on peak shape of peptides in reversed-phase high performance liquid chromatography. J Chromatogr A 2004;1038:77–84 [DOI] [PubMed] [Google Scholar]
- 20. McCalley DV. Comparison of peak shapes obtained with volatile (mass spectrometry-compatible) buffers and conventional buffers in reversed-phase high-performance liquid chromatography of bases on particulate and monolithic columns. J Chromatogr A 2003;987:17–28 [DOI] [PubMed] [Google Scholar]
- 21. Huber CG, Premstaller A, Kleindienst G. Evaluation of volatile eluents and electrolytes for high-performance liquid chromatography–electrospray ionization mass spectrometry and capillary electrophoresis–electrospray ionization mass spectrometry of proteins: II. Capillary electrophoresis. J Chromatogr A 1999;849:175–189 [DOI] [PubMed] [Google Scholar]
- 22. McCalley DV. Some practical comparisons of the efficiency and overloading behaviour of sub-2 μm porous and sub-3 μm shell particles in reversed-phase liquid chromatography. J Chromatogr A 2011;1218:2887–2897 [DOI] [PubMed] [Google Scholar]
- 23. McCalley DV. Rationalization of retention and overloading behavior of basic compounds in reversed-phase HPLC using low ionic strength buffers suitable for mass spectrometric detection. Anal Chem 2003;75:3404–3410 [DOI] [PubMed] [Google Scholar]
- 24. Buckenmaier SM, McCalley DV, Euerby MR. Overloading study of bases using polymeric RP-HPLC columns as an aid to rationalization of overloading on silica-ODS phases. Anal Chem 2002;74:4672–4681 [DOI] [PubMed] [Google Scholar]
- 25. McCalley DV. The challenges of the analysis of basic compounds by high performance liquid chromatography: some possible approaches for improved separations. J Chromatogr A 2010;1217:858–880 [DOI] [PubMed] [Google Scholar]
- 26. Cox G, Snyder L. Preparative high-performance liquid chromatography under isocratic conditions: III. The consequences of two adjacent bands having unequal column capacities. J Chromatogr A 1989;483:95–110 [Google Scholar]
- 27. Eble J, Grob R, Antle P, Snyder L. Simplified description of high-performance liquid chromatographic separation under overload conditions, based on the Craig distribution model: II. Effect of isotherm type, and experimental verification of computer simulations for a single band . J Chromatogr A 1987;384:45–79 [Google Scholar]
- 28. Snyder L, Cox G, Antle P. A simplified description of HPLC separation under overload conditions. A synthesis and extension of two recent approaches Chromatographia 1987;24:82–96 [Google Scholar]
- 29. Johnson D, Boyes B, Fields T, Kopkin R, Orlando R.Optimization of data-dependent acquisition parameters for coupling high-speed separations with LC-MS/MS for protein identifications. J Biomol Tech 2013;24:62–72 [DOI] [PMC free article] [PubMed] [Google Scholar]