Abstract
An increasing number of studies indicate that there exists greater diversity of cortical neurons than previously appreciated. In the present report, we use a combination of physiological and morphological methods to characterize cortical neurons in infragranular layers with apical dendrites pointing toward the white-matter compared to those neurons with apical dendrites pointing toward the pia in both mouse and rat neocortex. Several features of the dendritic morphology and intrinsic and synaptic physiology of these “inverted” neurons revealed numerous differences among this cell type between species. We also found differences between the different cell types within the same species. These data reveal that similar cell types in the rat and mouse may not always share similar physiological and morphological properties. These data are relevant to models of information processing through micro- and larger neocortical circuits and indicate that different cell types found within similar lamina can have different functional properties.
INTRODUCTION
Complex cortical functions emerge from the diversity of cortical neurons and the dynamic and plastic properties of their synaptic connections (reviewed in Jones 1984; White 1989). Not surprisingly, deficits in cortical function due to developmental disruption, injury, or genetic mutation underlie many neurological disorders such as epilepsy and cognitive impairment. Greater knowledge of cortical neurons and their connections is therefore critical toward the understanding of the mechanisms of cortical function in the normal and diseased brain.
Recent years have seen an explosion of anatomical and physiological studies detailing the diversity of cortical cell-types including GABAergic interneurons (Ascoli et al., 2008; Ma et al., 2006; Xu et al., 2006) and pyramidal cells (Brumberg et al., 2003; Hattox and Nelson, 2007; Ramos et al., 2008; Staiger el al., 2004). Gene and protein expression studies have also revealed previously unknown cell-types (Hevner et al., 2003; Hevner, 2007; Nelson et al., 2006; Watakabe et al., 2007; Yamamori and Rockland, 2006). Continued discovery of novel cortical cell populations and subpopulations emphasizes the need for further quantitative studies examining individual cortical cells and their interconnected neuronal circuits.
Radially-oriented apical dendrites pointing toward the pial surface are a characteristic feature of nearly all pyramidal neurons. However, cortical pyramidal neurons with atypically-oriented apical dendrites pointing toward the cortical white matter have been recognized since the time of Cajal and in every mammalian species examined. Nevertheless the physiology and anatomy of these “inverted” pyramidal cells (IPCs) remains poorly understood (reviewed in Mendizabal-Zubiaga et al., 2007). Found almost exclusively in the infragranular layers (V and VI) of the cortex, IPCs are known to form intracortical and callosal projections but lack the corticofugal projections to subcortical targets such as those made by other infragranular cells (Bueno-López et al., 1999; Reblet et al., 1992; reviewed in Mendizabal-Zubiaga et al., 2007). Thus, despite only representing a small percentage of cells in the cortex (depending on species and area examined: 1–8.5%; Globus and Scheibel, 1967; Parnavelas et al., 1977; Bueno-Lopez et al., 1991, Qi et al., 1999), IPCs are capable of participating in important cortical functions via local as well as interhemispheric projections.
In the present report we quantitatively examined the intrinsic electrophysiological properties of IPCs and pyramidal neurons with dendrites pointing toward the pia whose somata were found in infragranular layers of the mouse and rat somatosensory cortex. Additionally, we utilized biocytin reconstructions in order to quantitatively analyze and compare the dendritic morphology of IPCs. Finally, we used perfusion of artificial cerebral spinal fluid lacking extracellular magnesium in order to test the role of IPC during periods of increased spontaneous synaptic activity. We observed both morphological and intrinsic physiological differences in IPCs between species as well as differences indicative that IPCs are integrated in distinct synaptic networks in rat versus mouse. Our results provide important data on the intrinsic properties of IPCs, reveal novel species differences in IPCs previously assumed to be homogeneous, and are relevant to models of information processing through micro- and larger neocortical circuits.
MATERIALS AND METHODS
Preparation of slices
Coronal slices of primary somatosensory cortex (300 µm thick) were prepared from postnatal day (P)14–21, CD1 mice or Sprague-Dawley rats (Charles River Laboratories) of either sex on a vibratome (VT1000S, Leica) in accordance with Queens College of the City University of New York and the National Institutes of Health guidelines for the use of laboratory animals and as described previously (Brumberg et al., 2003, Ramos et al., 2008). Animals were anesthetized with an intraperitoneal injection of Euthasol (Virbac AH Inc) until unresponsive to noxious stimulation (toe-pinch). Following decapitation, the brain was quickly removed, blocked, and placed into ice-cold (4°C) oxygenated artificial cerebral spinal fluid (ACSF). ACSF contained (in mM) 125 NaCl, 2.5 KCl, 1 MgCl2, 1.25 NaH2PO4, 2 CaCl2, 25 NaHCO3, and 25 dglucose and was aerated with 95% O2–5%CO2 to a final pH of 7.4. Where indicated, slices were perfused with modified ASCF containing zero extracellular Mg in order to elicit spontaneous bursting according to the protocol of Flint and colleagues (Flint and Connors, 1996; Flint et al., 1997).
Electrophysiological recordings
Neurons were visualized with infra-red differential interference contrast (IR-DIC) microscopy (Olympus BX51WI). Patch pipettes (4–7 MΩ tip resistance) were pulled on a Flaming/Brown microelectrode puller (P-97, Sutter Instruments). Pipettes were filled with (in mM) 120 KGlu, 10 NaCl, 20 KCl, 10 HEPES, 2 Mg-ATP, 0.3 Na-GTP, 0.5 EGTA, and 0.3–1% biocytin (wt/vol) for subsequent visualization of the neurons (see following text). Once a stable recording was obtained (resting Vm of <-55 mV, overshooting action potentials, ability to generate repetitive action potentials to a depolarizing current pulse), neurons were classified according to discharge pattern in response to a constant depolarizing current pulse (1000 ms) as intrinsically bursting, regular spiking, etc. (McCormick et al., 1985; Brumberg et al., 2000, Ramos et al., 2008). Injection of depolarizing and hyperpolarizing current steps of increasing amplitudes (10pA increments) were used to measure intrinsic membrane properties. Off-line analysis of action potential and passive membrane properties was performed using Clampfit9 (Molecular Devices).
Histology and Neuronal Reconstruction
Following recordings slices were placed in cold fixative (4% paraformaldehyde in 0.1 M phosphate buffer) and kept at 4°C for no more than 2 weeks. Biotin-avidin-HRP histochemistry was preformed as described previously (Ramos et al., 2008). Slices were not re-sectioned. For three-dimensional morphological reconstructions, the Neurolucida system (MicroBrightfield Inc) was used in conjunction with an Olympus BX51 microscope using 4× (0.1 numerical aperture (NA)), 10× (0.4 NA) and 60× (1.4 NA, oil) objectives. Digital images were taken using an Optronics Microfire camera attached to a dedicated PC. Morphological measurements of neuronal dendrites and somata were made using the associated NeuroExplorer software package (MicroBrightfield Inc). Cells were classified as inverted if its principle dendrite was descending towards the cortical white matter. The principle dendrite was determined for both upright and inverted cells by examining dendrite diameter. The thickest dendrite to emerge from the soma was considered to be the principle, or apical, dendrite. These measurements were made by using the “quick measure line” tool within the Neurolucida program and placing a line across the dendrite as it emerged from the soma, values for the four cell types were averaged for subsequent analyses (see Table 1).
Table 1.
Summary of somatic and dendritic characteristics of mouse and rat inverted and upright pyramidal cells. All data are reported as means ± standard error of the mean (SEM).
| Soma | Basilar Dendrites | Apical Dendrites | ||||||||
|---|---|---|---|---|---|---|---|---|---|---|
| Perimeter ( m) |
Aspect ratio |
Nodes | Length (m) | Mean branch length (m) |
Surface area (m2) |
Diameter (m) |
Nodes | Length (m) |
Surface area (m2) |
|
| Mouse IPC | 44.7±1.27 | 1.53±0.05 | 4.36±0.46 | 496.04±54.95 * | 134.18±14.85* | 1684.45±153.17*† | 2.33± 0.19 | 3.86±0.57 | 400.14±62.40 * | 1540.54±220.98*† |
| Mouse UPC | 41.86±3.59 | 1.33±0.06 | 3.7±0.67 | 425.19±59.45 | 97.63±9.95 | 838.70±126.15 | 2.57± 0.10 | 3.90±0.92 | 325.30±41.07 | 728.91±91.98† |
| Rat IPC | 49.11±1.58† | 1.59±0.07 | 7.39±1.02 | 1037.97±117.28*† | 249.72±28.83*† | 3513.20±379.88*† | 2.54± 0.14 | 6.17±1.15 | 840.07±149.81*† | 2738.70±409.18*† |
| Rat UPC | 43.02±0.59† | 1.40±0.05 | 5.38±0.91 | 521.41±59.29 † | 137.09±19.66† | 950.94±88.70† | 2.47± 0.11 | 4.88±0.58 | 420.34±54.62 † | 928.07±118.31† |
The symbol (*) indicates statistical significance (p<0.05) between cell types and the symbol
indicates significance between species.
Golgi Staining and Quantification of Dendritic Spines
Animals (CD1 mice, N = 13) of either sex at p80–90 were randomly selected. Brains were immediately removed and rinsed in 0.1 M phosphate buffer (pH 7.13) for 3 minutes. After the rinse, retrieved brains were immersed in a Golgi-Cox solution (FD Rapid Golgi Stain Kit, FD Neurotechnologies Inc.) comprising potassium dichromate, mercuric chloride, and potassium chromate. This mixture of solutions was replaced once after 12 hours of initial immersion, with storage at room temperature in darkness for 2–3 weeks.
After the immersion period in the Golgi-Cox solution, the embedded brains were transferred to a cryoprotectant solution (FD Rapid Golgi Stain Kit) and stored at 4°C for at least 1 week in the dark before cutting. The brain slices were sectioned in the coronal plane at approximately 200–250 µm thickness on a freezing cryostat (approximately −25°C). To prevent ice crystal damage, tissues were rapidly frozen with dry ice and quickly embedded in optimal cutting temperature (OCT) medium. Sliced tissues were transferred onto triple-dipped gelatin slides and were coated with additional cryoprotectant solution. Cut sections were air dried at room temperature in the dark for at least 2–3 weeks before further processing. After drying, sections were rinsed with distilled water and were subsequently stained in a developing solution (FD Rapid Golgi Stain Kit) and dehydrated with 50%, 75%, 95%, and 100% ethanol. Finally, the sections were defatted in xylene substitute and coverslipped with either Permount (Fisher Scientific, Fair Lawn, NJ) or SHUR/Mount (Triangle Biomedical Sciences, Inc.).
Neurons were reconstructed using the Neurolucida software (see above) and only the cells that exhibited complete Golgi impregnation with a limited amount of staining artifacts were traced. The number of spines per dendrite were quantified using a 100x oil immersion lens (NA=1.40) and the length of the apical and basilar dendrites were measured. Spine density was determined by dividing spine number by dendritic length in microns and multiplying by 100 to present the data as spines/100 µm.
Sholl Analysis
A Sholl analysis was performed in order to determine if there were differences in apical and basal dendritic branching patterns between inverted and upright mouse and rat pyramidal cells. Neuroexplorer (Micorbrightfield inc.) was utilized to conduct the analysis. Dendrites were analyzed in increasing distances (at 10µm intervals) from the soma using concentric rings centered on the soma. Quantitative measurements were taken including dendritic branch length, branching points (nodes), intersections and endings.
Quantitative Analyses
Statistics were computed using the Statistica software package (StatSoft) for within-group and between-group analyses. One-way and repeated measures ANOVAs were conducted and Tukey's HSD post hoc test was used to determine the source of the variance, if any. Specific comparisons were made between different cell types found in the same species (i.e. rat IPCs vs. rat UPC) as well as similar cell types found between the two species (i.e. rat IPCs vs. mouse IPCs). Statistical significance was set at p < 0.05. All data are reported as means ± standard error of the mean (SEM) unless otherwise noted.
RESULTS
Intrinsic properties of IPCs in infragranular layers of rat and mouse cortex
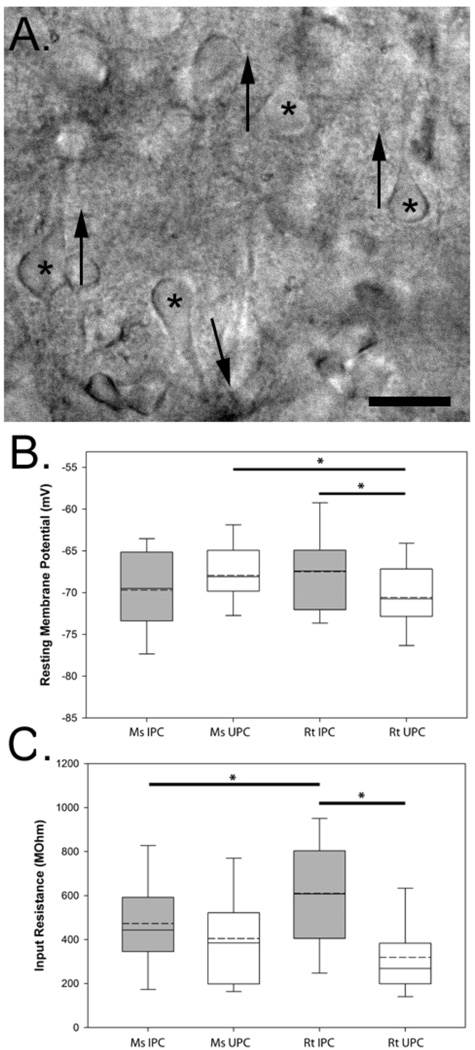
IPCs in both rat and mouse cortical slices were readily identifiable using IR-DIC (Figure 1A) and could be unequivocally confirmed following 3D morphological reconstruction of biocytin-filled neurons (see below). A representative photomicrograph of an IPC in a mouse cortical slice is shown in Figure 1A. We recorded from a total of 40 and 24 IPCs in the mouse and rat neocortex (respectively) and for comparison 38 and 46 upright pyramidal cells (UPCs) in the mouse and rat neocortex (respectively).
Figure 1.
Visualization and recording of inverted pyramidal neurons. (A) IR-DIC photomicrograph of a mouse slice maintained in vitro where the somata (asterisks) and apical dendrites of numerous UPCs (up arrows) can be seen as well as an IPC (down arrow). Measurements of the resting membrane potential (B) and input resistance (C) of the recorded neurons grouped by species and cell-type. Asterisks denote significant differences between groups (p<0.05). The boundary of the box closest to zero indicates the 25th percentile while the boundary of the box farthest from zero indicates the 75th percentile. Solid lines within the boxes mark the median while dashed lines mark the population mean. Error bars above and below the box indicate the 90th and 10th percentiles. Scale bar in A: 30µm.
A number of intrinsic membrane properties of these cells were examined such as the resting membrane potential, which was determined soon after whole-cell configuration was achieved. Resting membrane potential data for all cell types are shown in Figure 1B. Mouse IPCs exhibited an average resting membrane potential of −69.68±0.89 mV, which was similar to that observed in rat IPCs (−67.48±1.04 mV) and mouse UPCs (−67.94±0.67 mV). A one-way ANOVA revealed no significant difference between the resting membrane potential of mouse and rat IPCs nor where there differences between mouse IPCs and UPCs, or between mouse and rat UPCs (−69.99±0.83 mV). Significant differences in resting membrane potential were found between IPCs and UPCs in rats (p < 0.04) as well as between mouse and rat UPCs (p < 0.02) suggestive of differences in conductances that typically regulate resting membrane potential such as those mediated by K+ ions (reviewed in Lesage, 2003).
The input resistance of all recorded neurons was calculated by the slope of a line fitted to the current vs. voltage relationship for small amplitude hyperpolarizing currents steps (25pA increments). Calculations were derived from peak voltage responses. As shown in Figure 1C, the average input resistance calculated for mouse IPCs was 454.95±35.98 MΩ, whereas the average input resistance for rat IPCs was 609.85±57.15 MΩ. A one-way ANOVA revealed no significant difference between the input resistance of mouse and rat IPCs nor where there differences between mouse IPCs and UPCs (388.98.83±35.73), or differences between mouse and rat UPCs (289.73±26.64). Significant differences in input resistance were found between rat IPCs and UPCs (p < 0.001) and between mouse and rat IPCs (p < 0.04). Thus, both input resistance and resting membrane potential are different between rat IPCs and UPCs.
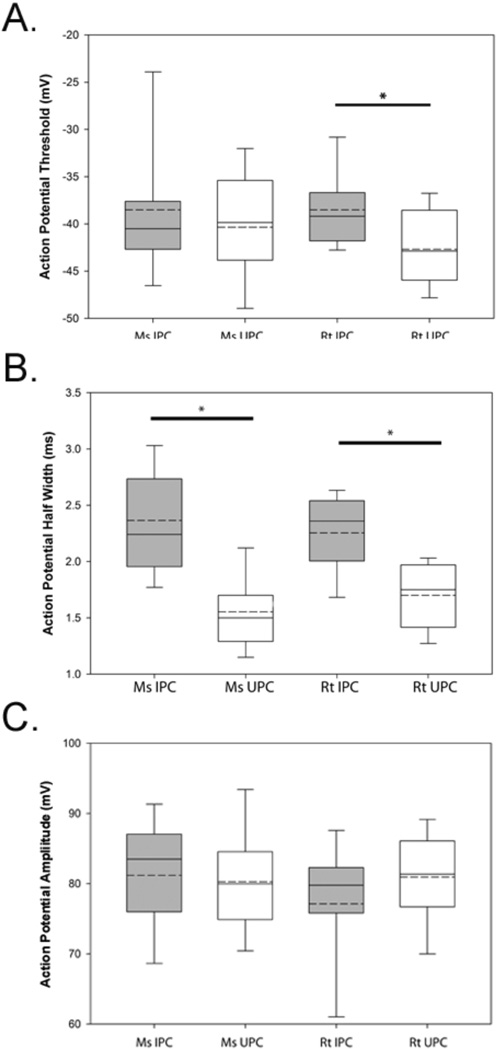
A number of suprathreshold response properties were investigated in IPCs in both rat and mouse cortex in response to depolarizing current steps including action potential threshold, halfwidth, and amplitude. As shown in Figure 2A, IPCs in mouse displayed an average action potential threshold of −38.60±1.41mV while IPCs in rat displayed a similar average threshold of −38.51±0.84mV. These data were not significantly different nor were comparisons made between rat UPCs (−42.69±0.85mV) and mouse UPCs (−42.64±1.13mV). In contrast, significant differences were only observed when comparisons were made between rat IPCs and UPCs (p < 0.001). The finding that rat IPCs displayed more depolarized action potential thresholds are indicative of differences in cellular excitability (see below).
Figure 2.
Measures of active membrane physiology to electrical stimulation. Comparisons of action potential threshold (A), half-width (B), and amplitude (C) reveal differences among the groups. Asterisks denote significant differences between groups (p<0.05). The boundary of the box closest to zero indicates the 25th percentile while the boundary of the box farthest from zero indicates the 75th percentile. Solid lines within the boxes mark the median while dashed lines mark the population mean. Error bars above and below the box indicate the 90th and 10th percentiles.
The average action potential width at half-amplitude was computed for all cell types (Figure 2B). Action potential widths of mouse IPCs (recordings done at ~22°C) was 2.36±0.09 ms compared to 2.25±0.09 ms which was observed for rat IPCs. Significant differences were observed between mouse UPCs (1.56±0.06 ms) and IPCs (p < 0.001) as well as comparisons between rat UPCs (1.79±0.06 ms) and IPCs (p < 0.001). We did not find differences between rat and mouse IPCs or comparisons between rat and mouse UPCs. Thus, both action potential threshold and width were found to be different in both species based on cell-type.
As shown in Figure 2C, action potential amplitude was also measured and in mouse (82.57±1.44 mV) and rat (77.13±1.92 mV) IPCs as well as in mouse (82.40±0.90 mV) and rat (80.16±1.04 mV) UPCs. Comparisons between all groups revealed no significant differences.
Action potential rise times were calculated for the first action potential generated in response to a depolarizing current pulse that just exceeded threshold in mouse (0.95±0.02 ms) and rat (0.94±0.01 ms) IPCs as well as in mouse (0.97±0.02 ms) and rat (0.93±0.08 ms) UPCs. Comparisons between all groups revealed no significant differences. In contrast, significant differences were observed in comparisons of action potential fall times. In particular, the fall times of rat IPC fall times (0.5±0.04 ms) were faster and differed significantly (p<0.01) from mouse IPCs (0.75±0.04 ms). In addition, the fall times of rat UPCs (0.52±0.06 ms) were faster and differed significantly (p<0.02) from mouse UPCs (0.81±0.09 ms). All other comparisons were not significantly different. Similar to the findings from our analysis of resting membrane potential, observed differences among the cell-types were present for conductances that are typically carried by the potassium ion.
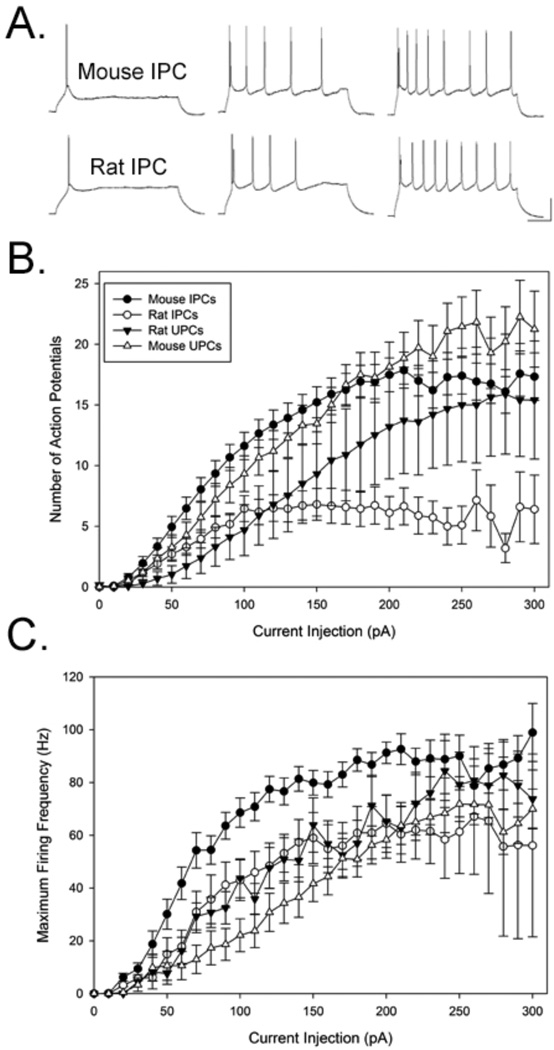
To assess potential differences in excitability, the number of action potentials elicited by suprathreshold current steps was measured in all cell types. Examples of repetitive spiking in response to increasing stimulation in a mouse and rat IPC is shown in Figure 3A. All cell-types displayed a regular spiking phenotype in both species. As shown in Figure 3B, all cell types exhibited increases in the number of spikes elicited by increasing current injection. Repeated measures ANOVA indicated that all cell-types displayed significant increases in action potential number with increasing current steps (all comparisons: p < 0.001) and a significant interaction was observed current injection amplitude vs. cell-type (p < 0.001). Interestingly, as shown in Figure 3B, rat IPCs displayed asymptotic levels of firing to current steps >100pA while all other groups continued to display increases in action potential number up to ~200pA. Mouse IPCs discharged more action potentials than rat IPCs and a repeated-measures ANOVA revealed a significant difference in the number of spikes elicited to increasing current steps between rat and mouse IPCs (F(31,33)=3.60,p <0.001) as well as a significant interaction between current injection amplitude vs. cell-type (p < 0.001). Similar significant differences were found between rat UPCs and rat IPCs ((F(31,38)=2,68, p < 0.01), with UPCs discharging more action potentials than IPCs. Significant differences were also observed between rat UPCs and mouse UPCs (F(31,65)=4.28,p<.0001). In contrast, no differences were observed between mouse IPCs and UPCs. Moreover, rat IPCs emitted the fewest numbers of action potentials even in response to strong stimulation intensities.
Figure 3.
Response properties of neurons to increasing electrical stimulation. (A) Representative example of repetitive firing to increasing 1 sec depolarizing current steps (left-right: +80, +110, +150 in pA) in a mouse and rat IPC (baseline membrane voltage = −70mV and −72mV for mouse and rat, respectively). (B) Measures of increasing action potential discharge and maximal firing frequency (C) of recorded neurons, means, and one standard error of the mean are shown. Calibration in A: 200ms, 40mV.
The maximum firing frequency (Hz) recorded in all cells was compared in response to increasing current steps. For each cell, the maximum firing frequency was always observed at the beginning of each response (i.e. the first inter-spike interval that was recorded). As shown in Figure 3C, increases in the maximum firing rate were exhibited by all cells in response to increasing current injection. A repeated measure ANOVA performed on these data indicated significant increases in firing with increasing current intensity for all groups (p < 0.001) as well as a difference between cell types (p < 0.01). Moreover, a significant interaction was observed between current injection amplitude vs. cell-type (p < 0.001). We examined these differences further and performed analyses comparing specific pairs of cell types. These analyses revealed significantly greater frequency firing displayed by mouse IPCs compared to UPCs (F(29.49)=7.7, p<0.001). Similar differences were observed between mouse IPCs vs. rat IPCs (F(29,34)=1.910, p<0.001). Significant differences were also observed between the maximum firing frequency between rat IPCs and UPCs (F(29,63)=3.465, p<0.001). No significant differences were found in comparisons of mouse UPCs with rat UPCs (F(29,78)=1.022, p=0.45). Overall, mouse IPCs had the highest maximum firing frequency and thus were capable of firing faster frequency action potentials compared to all other cell-types.
Synaptic properties of IPCs in 0[Mg2+] ACSF studies
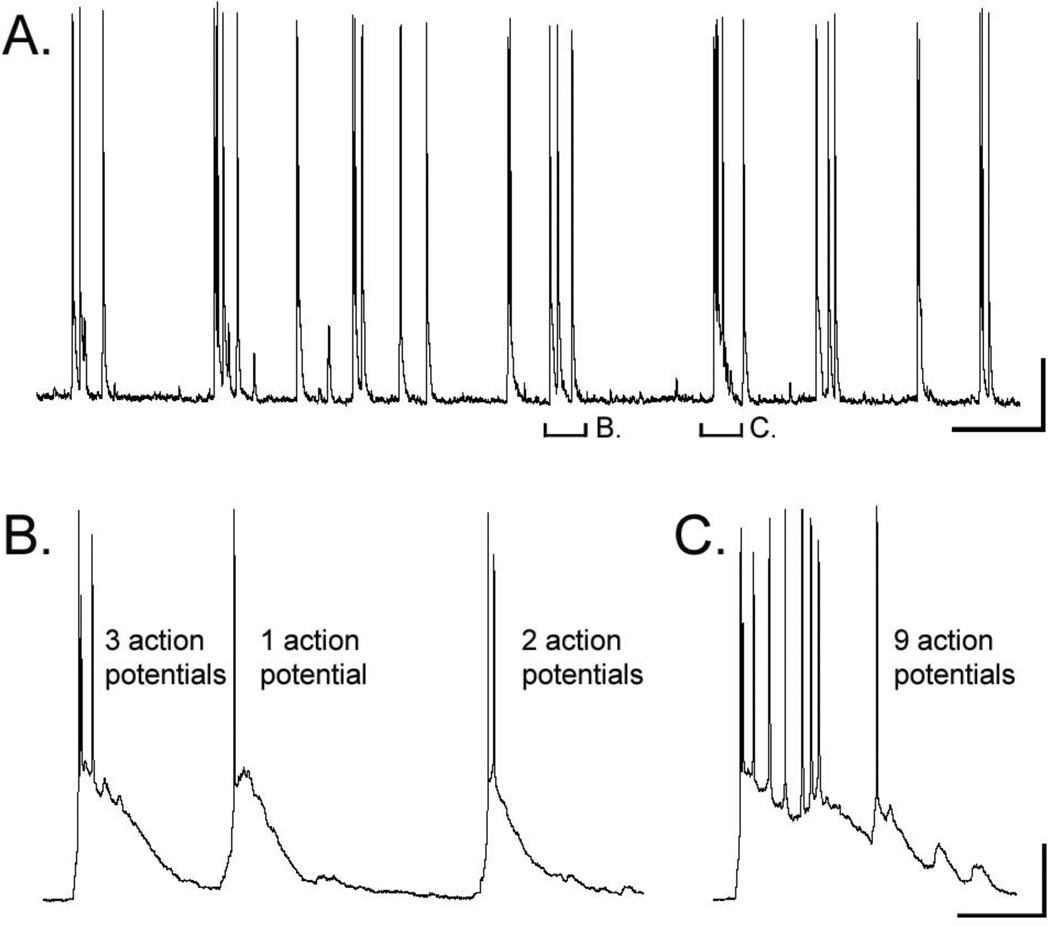
We used 0mM Mg2+ in the extracellular ACSF in order to induce spontaneous activity in cortical slices as was first described by Connors and colleagues (Flint and Connors 1996; Silva et al., 1991) and has been shown to increase glutamatergic transmission via NMDA receptors that would be otherwise blocked by Mg2+ ions. While often used as an in vitro model of epilepsy, we used 0mM Mg2+ as a tool to assess cortical activity in all cell types under periods of increased synaptic activity. Under control conditions, all recorded neurons from both species did not exhibit spontaneous action potential discharge. Furthermore, spontaneous subthreshold postsynaptic potentials were not of sufficient frequency for quantitative analysis. However, following the perfusion of slices with 0mM Mg2+ ACSF, we observed action potential bursting in a subset of neurons from both cell types and both species despite a lack of change in the resting membrane potential indicative of a synaptic mechanism underlying bursting (Flint and Connors, 1996; Flint et al., 1997). Figure 4 contains a representative example of bursting in a mouse IPC with varied numbers of action potentials during 0Mg2+ ACSF bath perfusion. We observed bursting in 8 of 23 (34.78%) mouse IPCs, 7 of 21 (33.33%) rat IPCs, 4 of 16 (25%) mouse UPCs, and 8 of 30 (26.67%) rat UPCs. Chi-square analyses of the number of cells that showed bursting in each group revealed no significant differences.
Figure 4.
Burst firing in response to removal Mg2+ from the ACSF. (A) Representative example of burst firing in a mouse IPC following perfusion of 0mM Mg2+ ACSF (Baseline membrane voltage = −71mV). (B-C) High magnification of two segments shown in A, which reveal different numbers of action potentials present during burst events. Calibration: A = 10secs, 50mV; B = 500ms, 50mV.
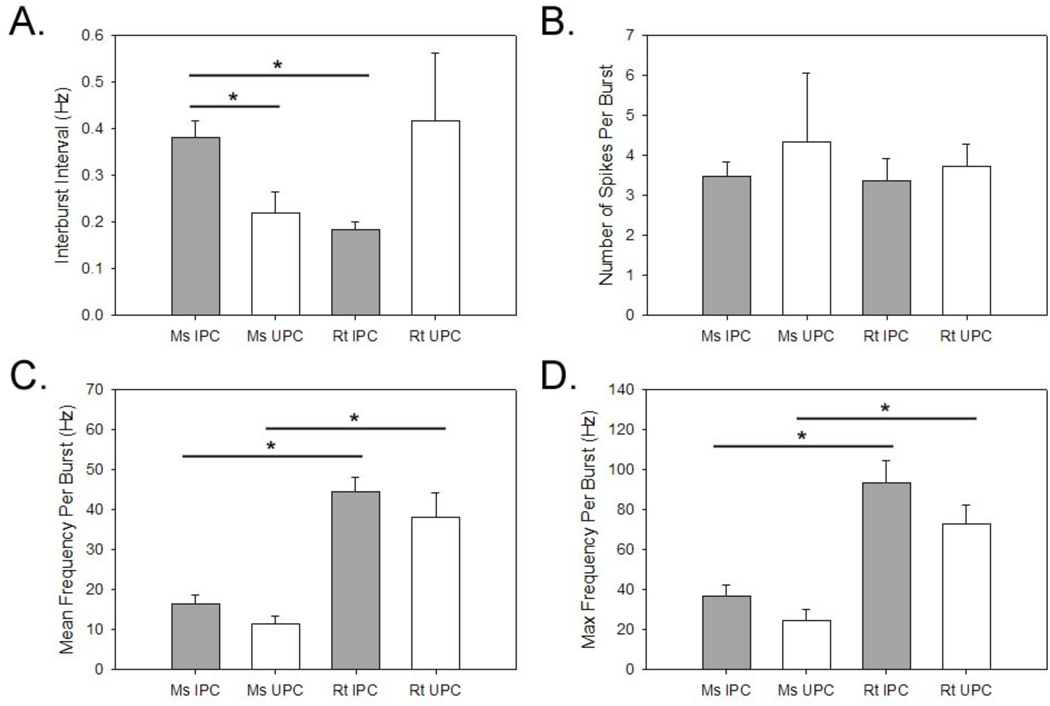
The frequency between bursts containing action potentials was calculated and is shown in Figure 5A. Although all groups revealed average inter-burst intervals (IBI) below 1Hz, significant differences in average IBI were observed between mouse IPCs and UPCs (p<0.05; one-way ANOVA) with mouse IPCs (0.38±0.04 Hz) bursting less frequently than mouse UPCs (0.22±0.04). We also found significant differences between mouse IPCs and rat IPCs (p<0.001; one-way ANOVA) with rat IPCs (0.18±0.02 Hz) bursting more frequently than mouse IPCs. Thus, under conditions of increased synaptic activity, action potential bursting varied according to cell-type and species which may indicate differences in the network configurations in which these respective cells are embedded.
Figure 5.
Properties of burst firing during 0mM Mg2+ ACSF experiments. Average time between bursts (A), average number of action potential during bursts (B), average firing (C), and maximum firing (D) frequency during bursts. Asterisks denote significant differences between groups (p<0.05). Plots represent population means and error bars indicate standard error of the mean.
The number of action potentials observed during bursting also varied widely between the different cell types. A representative example of a mouse IPC that exhibited from two up to nine action potentials per burst is shown in Figure 4. The average number of action potentials observed during bursting for all cell types is shown in Figure 5B. Mouse UPCs displayed an average of slightly more than 4 action potentials per burst (4.35±1.71) compared to all other cell types which displayed less than 4 action potentials per burst (mouse IPCs=3.47±0.37; rat IPCs 3.38±0.55; rat UPCs=3.72±0.56). However, comparisons between groups did not reveal any significant differences in the number of action potentials per burst. We also examined the average and maximum frequency of action potential discharge during bursts (F(3,22)=0.29, p=0.83). These data are shown in Figure 5C and 5D, respectively. Both types of cells in the rat displayed greater average and maximum action potential discharge during bursts compared to both mouse cell types. However significant differences were found for comparisons of average (F(3,22)=13.28, p<0.0001) and maximum frequency(F(3,22)=11.46, p<0.0001) discharge bursts. Tukey’s HSD was used to evaluate post hoc differences. Rat and mouse IPCs revealed significant differences for both average (p<0.001) and maximum (p<0.01) frequency discharge during bursts. Similar differences were found for comparisons between rat and mouse UPCs for measures of average (p<0.01; One-way ANOVA) and maximum (p<0.01; One-way ANOVA) frequency discharge during bursts. No differences were observed for comparisons between rat UPCs and rat IPCs or for comparisons between mouse IPCs and mouse UPCs. These data indicate that regardless of cell-type, rat neurons emit faster frequency action potentials during bursting compared to mouse cells even though all cell-types in both species have similar numbers of action potentials per burst.
Morphological properties of biocytin-reconstructed IPCs in rat and mouse cortex
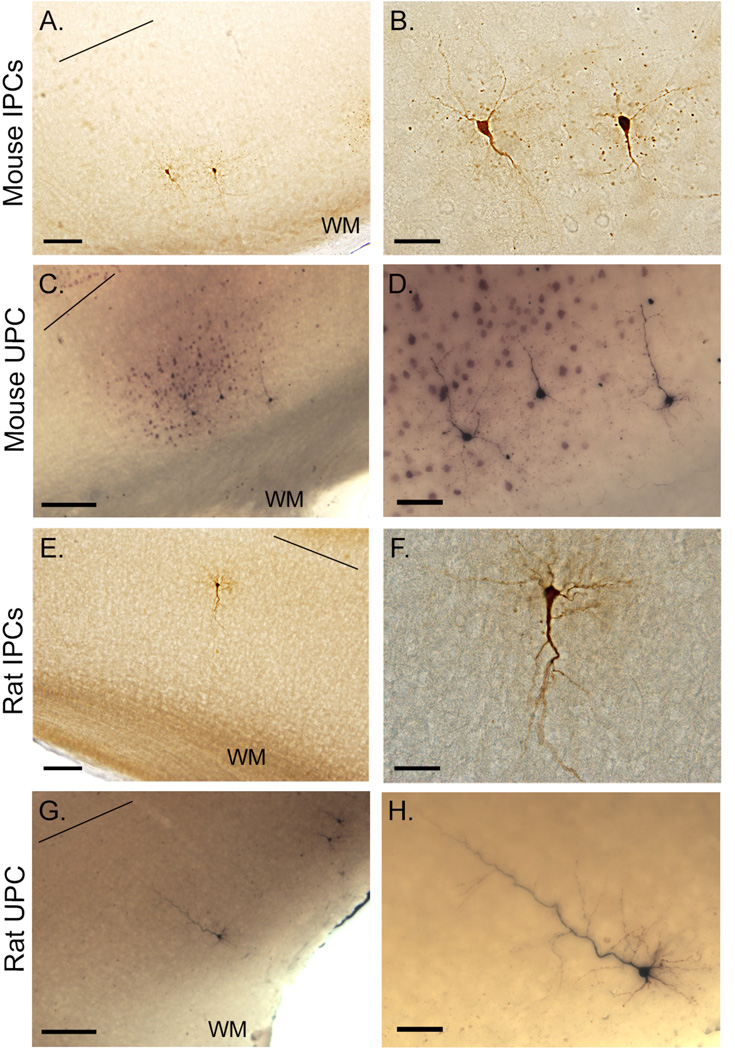
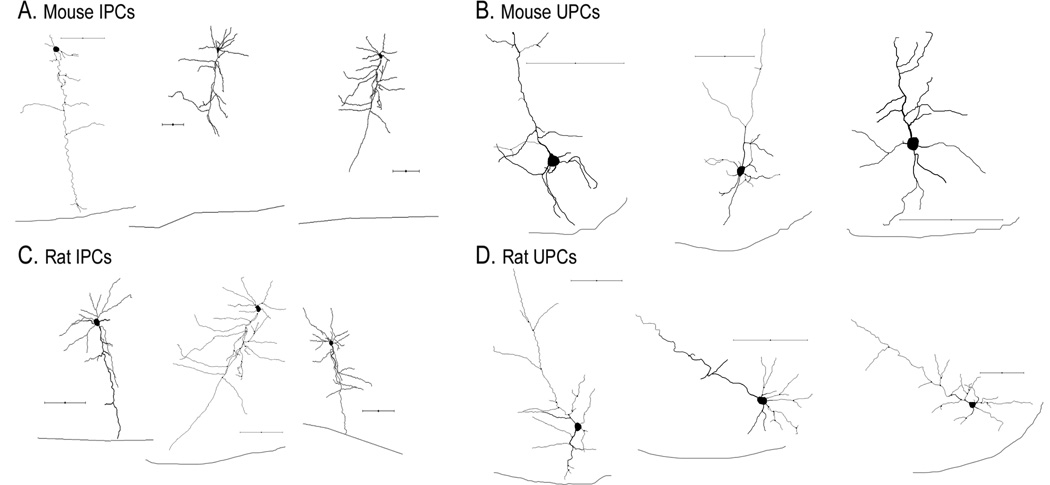
Three-dimensional reconstruction of biocytin-filled neurons was used in order to determine more detailed morphological characteristics of physiologically-identified IPCs in rat (n = 17) and mouse (n = 21) as well as upright pyramidal cells in rat (n=16) and mouse (n=10). Representative examples of biocytin-filled and reconstructed mouse and rat cells are shown in Figure 6 and 7, respectively. As multiple cells were recorded from a single slice prior to fixing the tissue, our biocytin-filled cells were such that they did not allow us to quantify dendritic spines, but previous work (Chen et al. 2009) has shown that these cell types do possess dendritic spines and are assumed to be excitatory. Other anatomical studies have also confirmed the presence of spines on IPCs in rat (Parvenalas et al., 1997), rabbit (Mendizabel-Zubiaga et al., 2007) and chimpanzee (Qi et al., 1999). Perhaps due to not immediately fixing slices following recordings, several cells may have incomplete dendritic trees. However, all cells were recorded similarly and processed in identical fashions and still morphological differences were observed despite this limitation. We examined a number of morphological metrics related to somatic and dendritic compartments including both apical and basilar dendrites and those features found to be significantly different are shown in Table 1. In order to determine whether a pyramidal cell was upright or inverted, we examined the diameter of the dendrite emerging from the apical shaft. Apical dendrites are thicker than basal dendrites and their thickness can vary from a diameter of 1 µm (Larkamn and Mason 1990; Lederberger and Larkum 2010) to greater than 10 µm (White and Hersch 1982). IPCs had an average diameter of 2.33±0.19 µm and 2.54±0.14 µm for the mouse and rat, respectively. Similar results were found for mouse UPCs (2.67±0.1 µm) and rat UPCs (2.47± 0.11). Statistical analysis showed no significant differences between groups (Oneway ANOVA; F(3,39)=0.620, p=0.6).
Figure 6.
Representative photomicrographs of biocytin-filled IPCs and UPCs. Flled neurons following physiological experiments in the mouse (IPC: A–B; UPC: C–D) and rat (IPC:E–F; UPC: G–H) cortex. Black line above neurons indicated layer V/VI border. Micrographs are taken at single focal plane. Scale bars in A, C, E, G = 250; B, F = 60; D, H = 30 (all in µm).
Figure 7.
Morphological reconstructions of inverted and upright pyramidal neurons following biocytin histochemistry. Representative reconstructions of mouse (A) and rat (C) IPCs. Representative reconstructions of mouse (B) and rat (D) UPCs. Black line below cells indicates layer VI-white matter border. All scalebars = 100µm.
We observed significant differences in the somatic perimeter measurements between rat and mouse cells (One-way ANOVA; F(3,63)=4.469, p<0.01). Reconstructed rat IPCs had larger somatic perimeters (49.11±1.58 µm) compared to that seen in mouse (44.70±1.27 µm) IPCs. However, post hoc analysis (tukey’s HSD) revealed this was not a significant difference. There were also no significant differences between the mouse (41.86±1.14 µm) and rat (43.02±1.49 µm) UPCs or between mouse IPCs and UPCs. However, rat IPCs had larger soma perimeters as compared to rat UPCs (p<0.03) as well as compared to mouse UPCs (p<0.05). Interestingly, comparing somatic area of rat (152.61±9.21) and mouse (138.44±8.46) IPCs and UPCs yielded no significant differences (F(3,65)=1.95, p=0.13).
Qualitatively, rat IPCs appeared to have more numerous and elaborate dendritic processes in both apical and basilar dendrites which was confirmed by quantitative analyses. Specifically, we observed a greater number of dendritic nodes (branches) on apical dendrites (6.17±1.15) as well as basilar dendrites (7.39±1.02) in rat IPCs and UPCs (apical: 4.88±0.56; basilar: 5.38±0.91) than in mouse IPCs (apical: 3.86±0.55; basilar: 4.36±0.46) and UPCs (apical: 3.9±0.92; basilar: 3.7± 0.67). Statistical comparisons (one-way ANOVA) of these metrics between rat and mouse revealed no significant differences for number of nodes in basilar dendrites (F(3,70=2.35, p=0.08) or in apical dendrites(F(3,62)=1.66, p=0.18). We also observed greater total length of apical (840.07±149.81 µm) and basilar dendrites (1037.97±117.28 µm) in rat IPCs than in mouse (apical: 400.14±61.03 µm; basilar: 496.04±54.95 µm) as well as in rat UPCs (apical: 420.35±54.62; basilar: 521.41±59.29) and mouse IPCs (apical: 325.30±41.07; basilar: 425.19±59.45). Statistical comparisons (One-way ANOVA) of these metrics between rat and mouse cells revealed significant differences for total length of apical (F(3,62)=5.40, p<0.01).) and basilar dendrites (F(3,70)=6.42,p<0.001). Post hoc analysis (Tukey’s HSD) revealed both greater apical and basilar dendrite length in rat IPCs as compared to all other groups. Similar significant differences were found for comparisons of mean length of basilar dendrites (F(3,70)=7.39, p<0.01) which were longer in rat (249.72±28.83) than mouse (134.18±14.95) IPCs as well as compared to rat (137.09±19.66) and mouse (97.63±9.94) UPCs. In contrast no significant differences were found between mouse and rat UPCs nor between the IPCs and UPCs of the mouse. Finally, total dendritic surface area was also significant(F(3,70)=9.45, p<0.0001).Post hoc comparisons (Tukey’s HSD) revealed rat IPC dendrites (3513.20±379.88) was significantly greater than that in mouse IPCs (1684.45±153.17; p<0.05) and rat (950.94±88.70; p<0.001) and mouse (838.70±126.14; p<0.001) UPCs. Once again, no significant differences were found between rat and mouse UPCs. Thus, as was observed in analyses physiological properties, rat and mouse IPCs display differences in morphological parameters. Overall, rat cells appeared to have larger somata as well as longer and more branched dendrites.
Sholl analysis
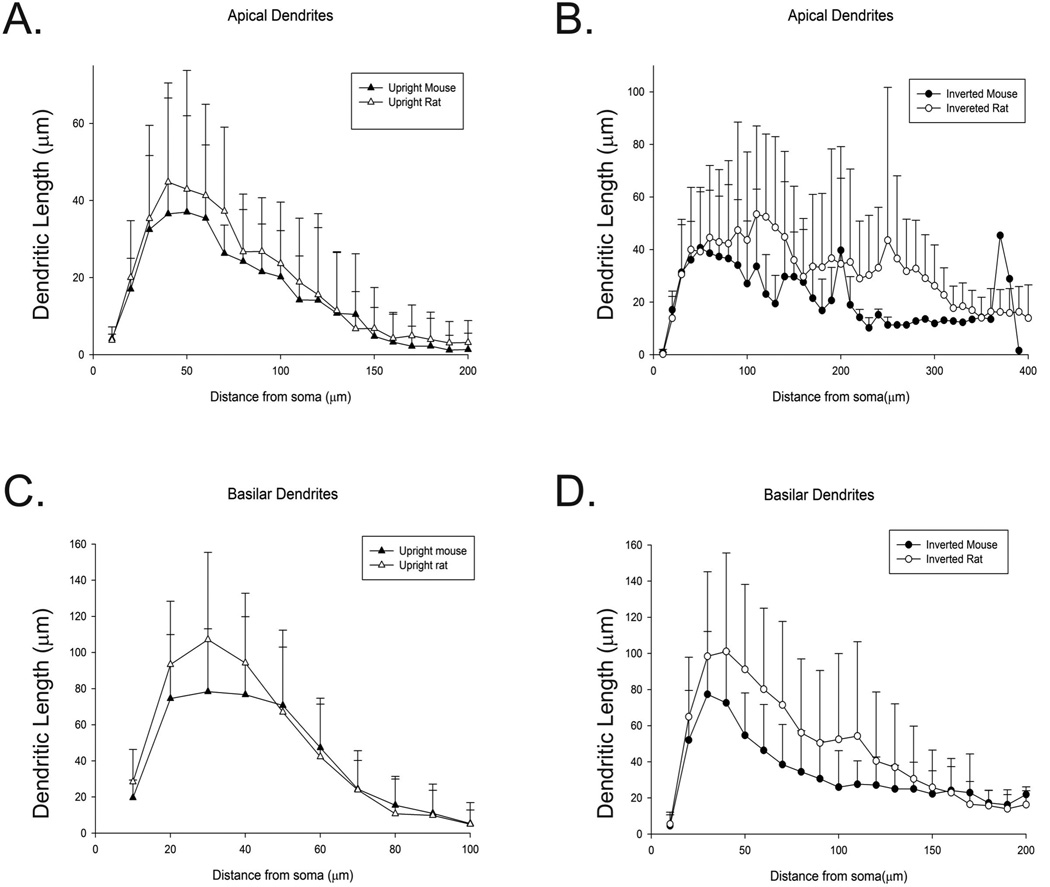
Sholl analysis was utilized to determine the complexity of the reconstructed dendrites. The number of intersections and dendritic length in 10 µm radii away from the soma were calculated as described in Materials and Methods. Figure 8 illustrates the differences in dendritic length between the mouse and rat as a function of distance from the soma. We compared the results of the Sholl analysis on 22 rat IPCs and 26 mouse UPCs cells using a one way repeated measures analysis of variance (ANOVA) in order to evaluate dendritic complexity. Comparisons were also conducted on 16 rat UPCs and 10 mouse UPCs. We found that there were a significant difference between rat and mice cells in terms of the number of intersections for their apical (F(90,114.61)=1.55, p< 0.05) as well as basilar dendrites (F(87,126.55)=1.58 p<0.01). Tukey's HSD revealed that both apical and basilar dendrites from mouse IPCs differed significantly from mouse UPCs (apical: p<0.01; basilar: p<0.01). Similarly the apical and basilar dendrites of rat IPCs and rat UPCs were significantly different (apical: p<0.001; basilar: p<0.001). However, mouse and rat IPCs did not differ from each other significantly (apical: p=0.25; basilar: p=0.9) nor did mouse and rat UPCs (apical: p=0.98; basilar p=0.12). However, both IPCs and UPCs had similar branching patterns with apical and basilar dendrites showing no significant differences (apical: F(57,140.96)=0.91, p=.65), p=0.58; basilar: F(54,158.74)=0.94, p=0.60). There were also no significant differences in the number of dendritic endings, as function of distance from the soma, of either the apical (F(93,111.64)=0.88, p=0.73) or basilar dendrites (F(84,129.52)=1.03, p=0.43). However, while total dendritic length was also not significantly different for the apical dendrites for comparisons involving UPCs and IPCs (F(102,102.71)=0.1.33, p=0.08), significance was found examining the total length of basilar dendrites (F(105,252.45)=2.24, p<0.001). Mouse IPCs did not differ from rat IPCs (p=0.98), but mouse UPCs were significantly different from rat UPCs (p<0.05). Mouse IPCs also differed from mouse UPCs (p<0.001) and rat IPCs differed significantly from rat UPCs (p<.001).The lack of differences in dendrite morphology may be considered unsurprising as these similarities also exist in UPCs. While the rat brain is bigger than the mouse, dendritic morphology may be conserved across species (Routh et. al. 2009).
Figure 8.
Sholl analysis. Graph representing average dendritic length of the apical and basilar dendrites of mouse and rat UPCs (A and C) and IPCs (B and D) as a function of distance from the soma (in µm). Error bars represent standard deviation.
Comparison of spine density between Golgi labeled IPCs and UPCs in the mouse
Many studies have found evidence for dendritic spines on both IPCs and UPCs across species including rat, rabbit and chimpanzee (Parvenalas et al., 1997; Mendizabel-Zubiaga et al., 2007; Qi et al., 1999). Using out Golgi impregnated tissue, we found that mouse IPCs have dendritic spines as well (figure 9A) Here, we have now compared spine density of IPCs to that of UPCs in the mouse (figure 9B). To best quantify the number of spines, 5 IPCs and 8 UPCs were reconstructed from the somatosensory cortex of Golgi stained tissue. An independent measures t-test was used to evaluate any differences between the two cell types. The spine density of basilar dendrites of mouse UPCs were on average 8.64±3.09 spines per 100 µm of dendritic length whereas the density of basilar dendrites on IPCs was 12.34±2.60 spines per 100 µm. However, this difference was not statistically significant (p = 0.42). Similar results are reported for the apical dendrites with UPCs having on average 14.26±4.20 spines per 100 µm and IPCs having an average of 13.33±3.29 spines per 100 µm. Once again, there were no statistical differences between the two cell types (p = 0.88). Finally, the mean total spine density (apical+basilar spines) for UPCs was 11.15±3.68 spines per 100 µm and 11.64±6.90 spines per 100 µm for IPCs. Once again, these differences were not statistically significant (p = 0.77). This further confirms that mouse IPCs have spines as previously seen in the rat and other species (Parvenalas et al., 1997; Mendizabel-Zubiaga et al., 2007; Qi et al., 1999). Furthermore, it was found that spine density is also similar between IPCs and UPCs (figure 9C). It was also found that neither apical nor basilar dendritic length of UPCs (883.35±212.95) in our Golgi sample was not significantly different from that of IPCs (825.92±157.44; p=0.85) which is similar to our findings from our biocytin filled neurons (see above).
Figure 9.
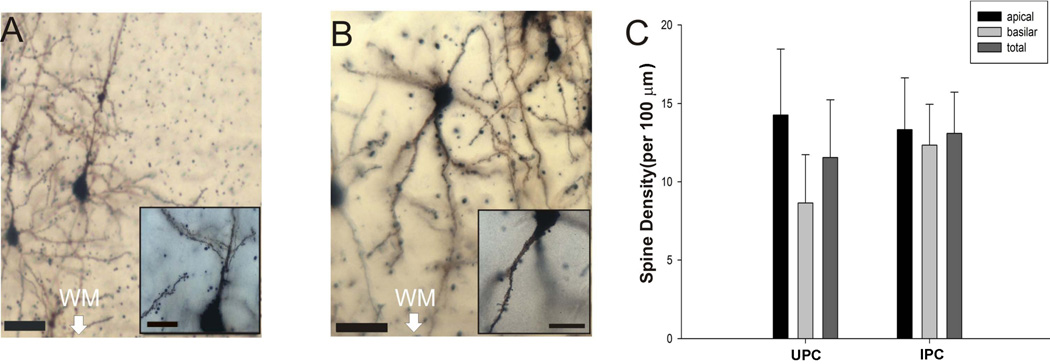
Golgi labeled images of UPCs and IPCs. Representative dendrites and spines of labeled UPCs at low magnification (A; scalebar = 50 µm) and high magnification (insert scalebar = 25 µm) and IPCs at low magnification (B; scalebar = 25 µm) and high magnification (insert scalebar = 25 µm). The graph (C) illustrates the spine density of mouse UPCs and IPCs in the apical and basilar dendrites as well as the density for apical+basilar (total) dendrites. WM = cortical white matter.
DISCUSSION
Intrinsic properties of IPCs
In the present report, we describe the physiology and morphology of pyramidal neurons in infragranular layers with apical dendrites pointing toward the white-matter (IPCs) versus those pointing toward the pia (UPCs) in both rat and mouse neocortex. Numerous differences were observed between IPCs and UPCs within species for sub- and suprathreshold measures. For example, resting membrane potential and input resistance were different between IPCs and UPCs in the rat, suggesting that potential differences in the ion channels regulating this intrinsic membrane physiology exists such as so-called “leak” K+ channels (reviewed in Lesage, 2003). In addition, action potential thresholds were higher in IPCs compared to UPCs in both rats and mice. These results suggest possible differences in the activation voltages (Colbert and Pan, 2002) and/or spatial configuration (Grubb and Burrone, 2010) of ion channels which contribute to action potential initiation such as voltage-gated Na+ channels. Consistent with potential differences in ion channel expression such as K+ channels among the different species, both rat cell-types exhibited faster action potential fall times compared to both mouse cell-types. There were also differences found between cell-types found in the same species.
Measures of repetitive firing revealed differences between cell-types found in the same species, as well as species differences for similar cell-types. For example, among all cell-types examined, rat IPCs generated the fewest action potentials to levels of current injection that strongly excited both mouse cell-types as well as rat UPCs. In contrast, we observed that mouse IPCs were capable of greater maximum firing frequencies compared to rat IPCs but were similar to mouse and rat UPCs. These data suggest possible limitations in the integrative properties of rat IPCs to encode high frequency and/or high intensity stimuli (Brumberg, 2002) compared to mouse IPCs. These data are relevant given the fact that IPCs in both species are found in both sensory and motor cortices and likely participate in sensory and motor functions via connection within and between hemispheres.
Bursting properties of IPCs
ACSF with 0mM Mg2+ was used as a tool to assess synaptic activity in all cell types under periods of increased activity and as an indirect measure of the cortical circuits in which these cell-types are embedded. We found that a subset of neurons of both cell-types and in both species displayed rhythmic bursts of action potentials. Although all cell-types discharged similar numbers of action potentials per burst, we found differences in the time between bursts and in the frequency of action potential discharge during bursts among different cell-types. These data suggest that the different cell-types are part of distinct intracortical synaptic networks that are differentially activated by perfusion with 0mM Mg2+. Further studies will be necessary to reveal whether IPC and UPC networks vary within infragranular layers as well as across neocortical lamina. Given that IPCs make interhemispheric projections (reviewed in Mendizabal-Zubiaga et al., 2007), these data are also relevant toward greater understanding of information processing via callosal connections.
Morphological differences of IPCs and UPCs
We examined the morphology of IPCs in both rat and mouse following biocytin reconstruction which confirmed that we indeed recorded from IPCs. While several filled cells may have incomplete dendritic branching, all cells were recorded similarly and several differences were found between cell-type as well as species. These analyses revealed that rat IPCs are larger in only some dendritic and somatic measures. However, the differences in these morphological features are not to scale with differences in cortical thickness between rats and mice which is ~2:1. Larger dendritic architecture and more complex branching likely relate to the number and spatial extent of synaptic inputs that each cell type receives. Therefore, one interpretation of our morphological analyses is that IPCs from the different species have different complement of synaptic afferents, a finding that is supported by the differences we observed in spontaneous bursting recordings where we observed more frequent bursting and faster firing within bursts in rat IPCs. Furthermore, the smaller size of the mouse IPCs may allow for faster membrane discharge accounting for the increased firing frequency exhibited by these cells. Thus, as their function relates to sensory and motor processing, rat and mouse IPCs may have different neocortical processing domains within and between sensorimotor circuits.
Despite decades of intense investigation, the diversity of cortical neurons continues to be revealed and has been recently aided by novel molecular, genetic, and physiological methods. Comparison of pyramidal cell-types within and across cortical lamina has revealed numerous similarities and important differences between physiological and/or anatomical measures. For example, layer V neurons in the somatosensory cortex that project to subcortical targets (spinal cord, brainstem, tectum), have thick apical dendrites with large dendritic tufts that reach the pial surface and display burst-type electrophysiological properties (Hattox and Nelson, 2007; Kasper et al., 1994; Rumberger et al., 1998). In contrast, layer V neurons that lack subcortical projections have thin apical dendrites with small-medium dendritic tufts and display a regularspiking phenotype (Kasper et al., 1994; Rumberger et al., 1998). Thus, neurons within the same lamina can have different morphologies, afferent projection targets, and physiological properties. Conversely, neurons found in different lamina that share similar afferent projection targets can display similar physiology and morphology. Such is the case with callosal projection neurons found in supragranular (II–III) vs. callosal neurons in infragranular (V–VI) layers of the somatosensory cortex (Ramos et al., 2008). Results from the present study add to our understanding of cortical neurons and suggest greater diversity among neurons in infragranular layers in both the rat and mouse (Chen et al., 2009).
Only recently have studies specifically sought to compare similar cell types in both rats and mice. Of particular relevance to our present findings, was a study comparing the physiology and morphology of pyramidal neurons in the CA1 region of the hippocampus (Routh et al., 2009). In this study which compared rats to two different strains of mice, surprisingly few morphological and electrophysiological differences were observed between species. Similar to our results, total dendritic surface area was found to differ between rats and mice (larger in rats) as well as action potential threshold (more hyperpolarized in rats). Unlike our findings, action potential amplitude was found to differ between the species and total dendritic length was not different between the species and (Routh et al., 2009). Taken together, these data emphasize the need for additional studies that compare important cell-types found in both rats and mice and highlight the care that should be used when extrapolating results from one species to the other.
Highlights.
Inverted pyramidal neurons can be targeted for in vitro electrophysiology.
Inverted neurons are different from neighboring upright neurons.
Inverted neurons in the mouse neocortex differ from those found in rat.
Acknowledgments
We thank the members of the Brumberg lab for assistance and helpful discussion. This work was supported by NS058758 to J.C.B.
Footnotes
Publisher's Disclaimer: This is a PDF file of an unedited manuscript that has been accepted for publication. As a service to our customers we are providing this early version of the manuscript. The manuscript will undergo copyediting, typesetting, and review of the resulting proof before it is published in its final citable form. Please note that during the production process errors may be discovered which could affect the content, and all legal disclaimers that apply to the journal pertain.
REFERENCES
- Ascoli GA, Alonso-Nanclares L, Anderson SA, Barrionuevo G, Benavides-Piccione R, Burkhalter A, Buzsáki G, Cauli B, Defelipe J, Fairén A, Feldmeyer D, Fishell G, Fregnac Y, Freund TF, Gardner D, Gardner EP, Goldberg JH, Helmstaedter M, Hestrin S, Karube F, Kisvárday ZF, Lambolez B, Lewis DA, Marin O, Markram H, Muñoz A, Packer A, Petersen CC, Rockland KS, Rossier J, Rudy B, Somogyi P, Staiger JF, Tamas G, Thomson AM, Toledo-Rodriguez M, Wang Y, West DC, Yuste R. Petilla terminology: nomenclature of features of GABAergic interneurons of the cerebral cortex. Nat Rev Neurosci. 2008;9(7):557–568. doi: 10.1038/nrn2402. [DOI] [PMC free article] [PubMed] [Google Scholar]
- Brumberg JC. Firing pattern modulation by oscillatory input in supragranular pyramidal neurons. Neurosci. 2002;114(1):239–246. doi: 10.1016/s0306-4522(02)00252-x. [DOI] [PubMed] [Google Scholar]
- Brumberg JC, Hamzei-Sichani F, Yuste R. Morphological and Physiological Characterization of Layer VI Corticofugal Neurons of Mouse Primary Visual Cortex. J Neurophysiol. 2003;89(5):2854–2867. doi: 10.1152/jn.01051.2002. [DOI] [PubMed] [Google Scholar]
- Brumberg JC, Nowak LG, McCormick DA. Ionic mechanisms underlying repetitive high frequency burst firing in cortical neurons. J Neurosci. 2000;20:4829–4843. doi: 10.1523/JNEUROSCI.20-13-04829.2000. [DOI] [PMC free article] [PubMed] [Google Scholar]
- Bueno-López JL, Reblet C, López-Medina A, Gómez-Urquijo SM, Grandes P, Gondra J, Hennequet L. Targets and Laminar Distribution of Projection Neurons with 'Inverted' Morphology in Rabbit Cortex. Eur J Neurosci. 1991;3(5):415–430. doi: 10.1111/j.1460-9568.1991.tb00829.x. [DOI] [PubMed] [Google Scholar]
- Chen CC, Abrams S, Pinhas A, Brumberg JC. Morphological heterogeneity of layer VI neurons in mouse barrel cortex. J Comp Neurol. 2009;512(6):726–746. doi: 10.1002/cne.21926. [DOI] [PMC free article] [PubMed] [Google Scholar]
- Colbert CM, Pan E. Ion channel properties underlying axonal action potential initiation in pyramidal neurons. Nat Neurosci. 2002;5(6):533–538. doi: 10.1038/nn0602-857. [DOI] [PubMed] [Google Scholar]
- Flint AC, Connors BW. Two types of network oscillations in neocortex mediated by distinct glutamate receptor subtypes and neuronal populations. J Neurophysiol. 1996;75(2):951–957. doi: 10.1152/jn.1996.75.2.951. [DOI] [PubMed] [Google Scholar]
- Flint AC, Maisch US, Kriegstein AR. Postnatal development of low [Mg2+] oscillations in the neocortex. J Neurophysiol. 1997;78(4):1990–1996. doi: 10.1152/jn.1997.78.4.1990. [DOI] [PubMed] [Google Scholar]
- Globus A, Scheibel AB. Pattern and field in cortical structure: The rabbit. J Comp Neurol. 1967;131:155–172. doi: 10.1002/cne.901310207. [DOI] [PubMed] [Google Scholar]
- Grubb MS, Burrone J. Activity-dependent relocation of the axon initial segment finetunes neuronal excitability. Nature. 2010;465(7301):1070–1074. doi: 10.1038/nature09160. [DOI] [PMC free article] [PubMed] [Google Scholar]
- Hattox AM, Nelson SB. Layer V neurons in mouse cortex projecting to different targets have distinct physiological properties. J Neurophysiol. 2007;98(6):3330–3340. doi: 10.1152/jn.00397.2007. [DOI] [PubMed] [Google Scholar]
- Hevner RF. Layer-specific markers as probes for neuron type identity in human neocortex and malformations of cortical development. J Neuropathol Exp Neurol. 2007;66(2):101–109. doi: 10.1097/nen.0b013e3180301c06. [DOI] [PubMed] [Google Scholar]
- Hevner RF, Daza RA, Rubenstein JL, Stunnenberg H, Olavarria JF, Englund C. Beyond laminar fate: toward a molecular classification of cortical projection/pyramidal neurons. Dev Neurosciv. 2003;25(2–4):139–151. doi: 10.1159/000072263. [DOI] [PubMed] [Google Scholar]
- Jones EG. Laminar distribution of cortical efferent cells. In: Peters A, Jones EG, editors. Cerebral Cortex, Cellular Components of the Cerebral Cortex. Vol. 1. New York: Plenum; 1984. pp. 521–553. [Google Scholar]
- Kasper EM, Larkman AU, Lubke J, Blakemore C. Pyramidal neurons in layer 5 of the rat visual cortexICorrelation among cell morphology, intrinsic electrophysiological properties, and axon targets. J Comp Neurol. 1994;339(4):459–474. doi: 10.1002/cne.903390402. [DOI] [PubMed] [Google Scholar]
- Larkman A, Mason A. Correlations between morphology and electrophysiology of pyramidal neurons in slices of rat visual cortex. I. Establishment of cell classes. The Journal of Neuroscience. 1990;10(5):1407–1414. doi: 10.1523/JNEUROSCI.10-05-01407.1990. [DOI] [PMC free article] [PubMed] [Google Scholar]
- Ledergerber D, Larkum ME. Properties of Layer 6 Pyramidal Neuron Apical Dendrites. The Journal of Neuroscience. 2010;30(39):13031–13044. doi: 10.1523/JNEUROSCI.2254-10.2010. [DOI] [PMC free article] [PubMed] [Google Scholar]
- Lesage F. Physiology of neuronal background potassium channels. Neuropharmacol. 2003;44(1):1–7. doi: 10.1016/s0028-3908(02)00339-8. [DOI] [PubMed] [Google Scholar]
- Parnavelas JG, Lieberman AR, Webster KE. Organization of neurons in the visual cortex, area 17, of the rat. J Anat. 1977;124:305–322. [PMC free article] [PubMed] [Google Scholar]
- Qi HX, Jain N, Preuss TM, Kass JH. Inverted pyramidal neurons in chimpanzee sensorimotor cortex are revealed by immunostaining with monoclonal antibody SMI-32. Somatosens Mot Res. 1999;16:49–56. doi: 10.1080/08990229970645. [DOI] [PubMed] [Google Scholar]
- Ramos RL, Tam DM, Brumberg JC. Physiology and morphology of callosal projection neurons in mouse. Neurosci. 2008;153(3):654–663. doi: 10.1016/j.neuroscience.2008.02.069. [DOI] [PMC free article] [PubMed] [Google Scholar]
- Reblet C, López-Medina A, Gómez-Urquijo SM, Bueno-López JL. Widespread Horizontal Connections Arising from Layer 5/6 Border Inverted Cells in Rabbit Visual Cortex. Eur J Neurosci. 1992;4(3):221–234. doi: 10.1111/j.1460-9568.1992.tb00870.x. [DOI] [PubMed] [Google Scholar]
- Reblet C, Perez-Samartin A, Caballero A, Marín I, Bueno-Lopez JL. Identified inverted cells in the cortico-cortical projections from extrastriate to striate visual cortex of cats. Eur J Neurosci. 1993;6:13S. [Google Scholar]
- Reblet C, Blanco-Santiago I, Mendizabal-Zubiaga JL, Gutierrez-Ibarluzea I, Bueno-Lopez JL. Development of inverted cells in infragranular layers of the rabbit visual cortex. Int J Dev Biol. 1996;1:145S–146S. [PubMed] [Google Scholar]
- Routh BN, Johnston D, Harris K, Chitwood RA. Anatomical and electrophysiological comparison of CA1 pyramidal neurons of the rat and mouse. J Neurophysiol. 2009;102(4):2288–2302. doi: 10.1152/jn.00082.2009. [DOI] [PMC free article] [PubMed] [Google Scholar]
- Rumberger A, Schmidt M, Lohmann H, Hoffmann KP. Correlation of electrophysiology, morphology, and functions in corticotectal and corticopretectal projection neurons in rat visual cortex. Exp Brain Res. 1998;119(3):375–390. doi: 10.1007/s002210050353. [DOI] [PubMed] [Google Scholar]
- Silva LR, Amitai Y, Connors BW. Intrinsic oscillations of necortex generated by layer 5 pyramidal neurons. Science. 1991;251(4992):432–435. doi: 10.1126/science.1824881. [DOI] [PubMed] [Google Scholar]
- Staiger JF, Flagmeyer I, Schubert D, Zilles K, Kotter R, Luhmann HJ. Functional diversity of layer IV spiny neurons in rat somatosensory cortex: quantitative morphology of electrophysiologically characterized and biocytin labeled cells. Cereb Cortex. 2004;14(6):690–701. doi: 10.1093/cercor/bhh029. [DOI] [PubMed] [Google Scholar]
- Ma Y, Hu H, Berrebi AS, Mathers PH, Agmon A. Distinct subtypes of somatostatin-containing neocortical interneurons revealed in transgenic mice. J Neurosci. 2006;26(19):5069–5082. doi: 10.1523/JNEUROSCI.0661-06.2006. [DOI] [PMC free article] [PubMed] [Google Scholar]
- McCormick DA, Connors BW, Lighthall JW, Prince DA. Comparative electrophysiology of pyramidal and sparsely spiny stellate neurons of the neocortex. J Neurophysiol. 1985;54:782–806. doi: 10.1152/jn.1985.54.4.782. [DOI] [PubMed] [Google Scholar]
- Mendizabal-Zubiaga JL, Reblet C, Bueno-Lopez JL. The underside of the cerebral cortex: layer V/VI spiny inverted neurons. J Anat. 2007;211(2):223–236. doi: 10.1111/j.1469-7580.2007.00779.x. [DOI] [PMC free article] [PubMed] [Google Scholar]
- Nelson SB, Sugino K, Hempel CM. The problem of neuronal cell types: a physiological genomics approach. Trends Neurosci. 2006;29(6):339–345. doi: 10.1016/j.tins.2006.05.004. [DOI] [PubMed] [Google Scholar]
- Watakabe A, Ichinohe N, Ohsawa S, Hashikawa T, Komatsu Y, Rockland KS, Yamamori T. Comparative analysis of layer-specific genes in Mammalian neocortex. Cereb Cortex. 2007;17(8):1918–1933. doi: 10.1093/cercor/bhl102. [DOI] [PubMed] [Google Scholar]
- White EL. Cortical Circuits, Synaptic Organization of the Cerebral Cortex, Structure, Function, and Theory. Boston: Birkhauser; 1989. [Google Scholar]
- White E, Hersch S. A quantitative study of thalamocortical and other synapses involving the apical dendrites of corticothalamic projection cells in mouse SmI cortex. Journal of Neurocytology. 1982;11(1):137–157. doi: 10.1007/BF01258009. [DOI] [PubMed] [Google Scholar]
- Yamamori T, Rockland KS. Neocortical areas, layers, connections, and gene expression. Neurosci Res. 2006;55(1):11–27. doi: 10.1016/j.neures.2006.02.006. [DOI] [PubMed] [Google Scholar]


