

Abstract
A novel method for the direct evaluation of the equimolarity of the compounds contained in a mixture is presented. We applied the method toward calculating isokinetic ratios for the reaction between the amine termini of a resin bound peptide fragment and a sulfonyl chloride in order to produce equal molar mixtures of sulfonamides. The results of this study and the application of the method to the synthesis of two new positional scanning synthetic combinatorial libraries (PS-SCL) are discussed.
Keywords: positional scanning library, isokinetic ratios, combinatorial libraries, harmonic mean, piperazine, sulfonamide, guanidine
Introduction
Combinatorial chemistry is a valuable tool in the rapid production of compound libraries for biological evaluation {REF 1, REF 2}. Specifically, positional scanning synthetic combinatorial libraries (PS-SCL) enable the systematic screening of thousands to trillions of compounds through the use of only hundreds of samples {REF 2, REF 3}. This exponential reduction in sample size enables many endeavors; such as: the evaluation of nearly 4 million small molecules through a direct in vivo screening in order to identify two novel potent, low-liability antinociceptive compounds {REF 4} and the multiclonal evaluation of trillions of 10-mer peptides in order to identify immunoprevalent antigens recognized by human CD4+ T cells {REF 5}. None of these efforts could have been currently conducted without the use of PS-SCL.
A key component of PS-SCL involves the ability to produce near equimolar amounts of each individual compound in each mixture sample. Two methods for accomplishing equimolar mixtures are the use of physical mixtures (“split and mix”) {REF 6, REF 7, REF 8} or chemical mixtures {REF 9}. While the use of physical mixtures has the advantage of assuring near equimolar incorporation of each individual compound in the mixture samples, it is limited in that as the number of R groups increases around the scaffold the corresponding number of split and mixes required increases exponentially, quickly rendering the technique less valuable. The use of chemical mixtures where “isokinetic mixtures” are applied to produce equimolar mixtures does not have the same limitations of the split and mix method; however, in order to utilize chemical mixtures in the production of PS-SCL one needs to determine the isokinetic ratios for the reagents used.
Several methods have been reported for determining the isokinetic ratio for a variety of different reagent classes such as amino acids, carboxylic acids, and aldehydes {REF 9, REF 10, REF 11, REF 12, REF 13}. These methods include the use of amino acid analysis as well as binary and iterative HPLC analysis, and MALDI-TOF. In this publication we introduce a novel method for the comparison of LCMS UV spectra which allows direct relative evaluation of the equimolarity of the compounds contained in that mixture; further, this method is applicable in cases more complex than would be feasible by simply using a reference compound. We applied it to the reaction between the amine termini of a resin bound peptide fragment and a sulfonyl chloride in order to produce a sulfonamide. The isokinetic ratio was determined and the effect of the on-resin peptide fragment was evaluated. Two novel PS-SCLs were synthesized based on the calculated ratios. Furthermore the two PS-SCLs were each screened in two opioid (mu and kappa) binding assays in part to determine the synthetic integrity.
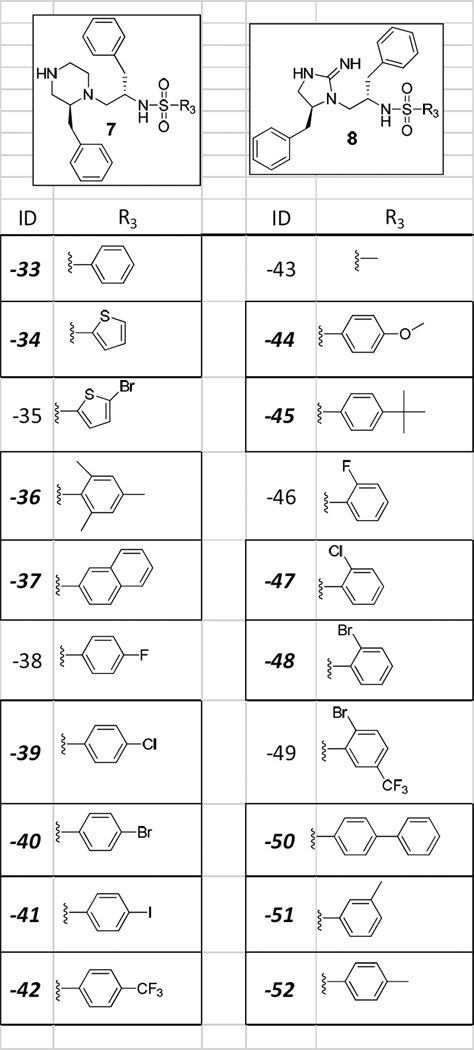
The two novel PS-SCLs were designed around two separate scaffolds 1) a piperazine linked to a sulfonamide (Scheme 1 Structure 7) and 2) a cyclic guanidine linked to a sulfonamide (Scheme 1 Structure 8). A number of approved pharmaceuticals contain piperazines, such as imatinib (cancer treatment), quetiapine (antipsychotic), and eszopiclone (treatment of insomnia), sulfonamides such as sulfamethoxazole (antibiotic), xipamide (hypertension and oedema), and darunavir (HIV), and guanidines such as guanadrel (antihypertensive) and guanethidine (antihypertensive). The synthesis (Scheme 1) utilizes our libraries from libraries approach {REF 14} where multiple libraries are synthesized from the same core in this case the peptide linked sulfonamide (Scheme 1 Structure 3). In fact we could have made separate libraries or libraries from libraries of both 3 and 4. Additionally we could expand the diversity of our collection by utilizing different cyclization conditions on 5 to produce additional “libraries from libraries” such as cyclic urea linked sulfonamides and cyclic thiourea linked sulfonamides utilizing carbonyldiimidazole and thiocarbonyldiimidazole to name just a couple {REF 15}.
Scheme 1.

a) Boc-AA/DIC/HOBt (6ex) in DMF b) 1) 55%TFA/DCM, 2) 5%DIEA/DCM c) Sulfonyl chloride/DIEA (8ex) in DMF d) HF 0°C 1.5hr e) 1) Borane-THF 60°C 96hrs 2) piperidine 60°C 24hrs f) Bromoacetic acid/DIC/DIEA (5ex/5ex/2.5ex) g) HF 0°C 7hr h) cyanogen bromide/DMF (5ex). A) mBHA resin-(L-Phenylalanine)-(L-Phenylalanine). B) mBHA resin-(equal molar mixture of amino acids; Ls, Ds, and unusuals)-(equal molar mixture of amino acids; Ls, Ds, and unusuals). C) A mixture sample defined with L-Phenylalanine (R1), L-Phenylalanine (R2), and a mixture of different sulfonly chlorides at R3. D) Compound derived from using L-Phenylalanine (R1), L-Phenylalanine (R2), and any one sulfonyl chloride (R3). D-45) Compound derived from using L-Phenylalanine (R1), L-Phenylalanine (R2), and 4-tert-butylbenzene-1-sulfonyl chloride (R3).
Determination of Proper Reagent Ratio
We have previously calculated, utilized, and reported the reagent ratios for amino acids competitively coupled to solid supported free amines {REF 9}. These ratios are utilized in the generation of Library 7 and 8. However, until now we had not determined the proper reagent ratios for sulfonyl chlorides reacting with solid supported free amines. In order to synthesize an equimolar mixture of sulfonamides, ratios must be determined to adjust for the fact that steric and electronic hindrance will vary amongst the different sulfonyl chlorides used in the mixture.
Initially, in order to test the robustness of different amino acids and sulfonyl chlorides to the reaction conditions described in Scheme 1, 104 individual compounds (52 of 7 and 52 of 8) were synthesized and analyzed by LCMS (see Table S1 in Supplementary Information). Of the 104 compounds, 40 tested the robustness of the R3 position, 20 for 7 and 20 for 8 (see Table 1). Of these 40, 30 (15 for 7 and 15 for 8) were shown to have final UV purities greater than >75%. Therefore the 15 sulfonyl chlorides that provided these 30 compounds (with >75% purity) were selected to determine isokinetic ratios. It may be noted that compounds in the R3 position which contained fluorine substitution yielded low product purity. This may be due to fluorine reacting with the piperazine during the reduction step (Scheme 1 step e2); however, this side reaction was not explored and these sulfonyl chlorides were eliminated from further study.
Table 1.
40 different individual compounds (20 of type 7 and 20 of type 8) were made to test the robustness of the R3 position. The boxed functionalities are the functionalities that provided the desired compounds in purities sufficient enough to be included in the final library syntheses.
 |
Having tested the robustness of the reaction conditions to different reagents, it is then necessary to determine a correction factor for each compound to account for differences in UV absorbance. Applying the tea bag method {REF 16}, 15 individual compounds where Boc-L-Phenylalanine was utilized in the R1 and R2 position were synthesized according to scheme 1. The 15 sulfonyl chlorides of interest were coupled to this sequence separately (Scheme 1 compound 3) providing 15 separate compounds that differ at only the R3 position (Scheme 1 compound D). L-Phenylalanine in the R1 and R2 position was chosen because of its strong UV absorbance properties at 214nm and non-reactive side chain. All individual compounds were analyzed using reverse phase HPLC-MS (See Table 2). The UV component of the HPLC-MS is used in the study in order to quantify the relative ratios while the MS component is used to aid in the identification of the compounds. A compound, obtained from using 4-tert-butylbenzene-1-sulfonyl chloride at the R3 position (Scheme 1 Compound D-45), with a sufficiently distinct retention time was selected as the control to which all other compounds were compared. Each compound was then physically mixed with the control to create an equal molar mixture. These samples were analyzed using HPLC-MS. The integration parameters were set to allow the best integration possible for the UV peaks 214nm, and all data sets were analyzed using these same integration parameters. Since the concentration of each compound is known to be equal, any differences in peak area can be attributed to differences in molar absorbance. A correction factor is therefore calculated for each compound as the ratio of the control compound’s peak area to the peak area of that compound:
Table 2.
Calculated values for the various synthesized compounds with L-Phenylalanine in the first two positions and a sulfonyl chloride in the third position
| Sulfonyl Chloride | Compound | Molecular Weight |
Retention Time |
UV Absorptivity Correction Factor Relative to Control |
Ratio Relative to Control |
Final Reagent Ratio Relative to Control |
|---|---|---|---|---|---|---|
| thiophene-2-sulfonyl chloride | D-34 | 458.10 | 17.00 | 1.30 | 4.08 | 3.15 |
| benzenesulfonyl chloride | D-35 | 451.90 | 17.23 | 0.89 | 0.60 | 0.67 |
| 2,4,6-trimethylbenzene-1-sulfonyl chloride | D-36 | 494.05 | 19.50 | 0.81 | 0.37 | 0.45 |
| naphthalence-2-sulfonyl chloride | D-37 | 502.00 | 18.66 | 0.51 | 0.26 | 0.52 |
| 4-chlorobenzene-1-sulfonyl chloride | D-39 | 486.10 | 18.38 | 0.97 | 0.49 | 0.51 |
| 4-bromobenzene-1-sulfonyl chloride | D-40 | 531.90 | 18.58 | 1.03 | 0.51 | 0.50 |
| 4-iodobenzene-1-sulfonyl chloride | D-41 | 578.00 | 18.83 | 1.10 | 0.48 | 0.44 |
| 4-(trifluoromethyl)benzene-1-sulfonyl chloride | D-42 | 519.90 | 18.91 | 1.02 | 0.41 | 0.40 |
| 4-methoxybenzene-1-sulfonyl chloride | D-44 | 481.95 | 17.31 | 1.06 | 1.11 | 1.04 |
| 4-tert-butylbenzene-1-sulfonyl chloride (control) | D-45 | 508.15 | 20.01 | 1.00 | 1.00 | 1.00 |
| 2-chlorobenzene-1-sulfonyl chloride | D-47 | 485.80 | 17.91 | 0.88 | 0.77 | 0.87 |
| 2-bromobenzene-1-sulfonyl chloride | D-48 | 532.00 | 18.09 | 0.87 | 0.69 | 0.79 |
| Biphenyl-4-sulfonyl chloride | D-50 | 528.15 | 19.46 | 0.84 | 0.72 | 0.85 |
| 3-methylbenzene-1-sulfonyl chloride | D-51 | 466.20 | 17.96 | 0.78 | 0.63 | 0.81 |
| 4-methylbenzene-1-sulfonyl chloride | D-52 | 465.95 | 17.89 | 0.96 | 0.70 | 0.73 |
This definition insures that by multiplying the peak area of the nth compound by its corresponding control factor, an area equal to peak area of the control is obtained. This process was performed in duplicate to confirm the correction factors and to minimize experimental error. See Table 2.
The rate at which each sulfonyl chloride reacts will vary based on steric and electronic hindrance. In order to synthesize an equimolar mixture, a ratio of each component of the sulfonyl chloride mixture must be calculated in order to compensate for the reaction rate differences. Each test mixture C was synthesized using a 1:1 mixture of the test sulfonyl chloride and the control sulfonyl chloride (Scheme 1 step c), each at a 4-fold excess over the resin (for a combined 8-fold excess total). The resulting on-resin synthetic mixtures were then cleaved from the solid support and analyzed by HPLC-MS using the same method and integration parameters as were used to calculate the correction factor. The UV 214nm peak area under the curve is used to calculate the reaction rate ratio:
The ratios obtained are thus the rate at which the nth sulfonyl chloride reacts relative to the control compound, with the differences in absorptivity accounted for via multiplication by the control factor. See Table 2.
Differences in Reaction Rate Caused by Multiple Simultaneous Reactions
The above calculations were done as individual comparisons between a given sulfonyl chloride and the control sulfonyl chloride. To determine if the presence of additional (more than two at a time) sulfonyl chlorides simultaneously would change the reaction rate of each sulfonyl chloride, these ratios were then tested in the presence of multiple sulfonyl chlorides including the control. A mixture of all the sulfonyl chlorides would yield a final mixture that would not allow for the analysis of individual peaks due to some final compounds D (i.e. D-52 rt 17.89min and D-47 rt 17.91min) having similar retention times and/or same molecular weights, and therefore individual changes in reaction rates would not be determinable. Because of this, multiple sample sets were set up to maximize the amount of compounds present that would still be distinguishable by HPLC-MS analysis. The control compound, D-45, was present in every sample set. Each designed mixture of sulfonyl chlorides was competitively coupled to L-Phenylalanine, L-Phenylalanine – MBHA resin (Scheme 1 Compound A) using an 8-fold excess (meaning the total excess of the sulfonyl chlorides) over the resin. The experiment was done so that every compound was analyzed in duplicate. The HPLC-MS 214nm UV peaks were analyzed using the same integration parameters that were used to obtain the ratios in the previous experiments. The correction factor for each compound was used to compare the amount of that compound to the amount of the control compound. No compound deviates in amount by more than 20% from that of the control (see Figure 1). This is well within experimental error and shows that there is no substantial effect on the reaction rates of the individual sulfonyl chlorides from the presence of other sulfonyl chlorides.
Figure 1.

An example of two UV spectra (red and green) which are not directly comparable because of differences in attenuation and concentration, and the result (blue) of finding the optimal overlap between them. The difference in the spectra is now apparent and quantifiable.
Differences in Reaction Rate Caused by Different On-Resin Amino Acids
It has been demonstrated that differences in the on-resin amino acid onto which the reagents couple will cause differences in the reaction rates of the individual reagents {REF 9, REF 17}. To explore the extent to which this is the case, we have developed a novel technique to quantify the overall difference between two mixtures containing multiple compounds. In general, direct comparison between two different HPLC-MS 214nm UV spectra is complicated by differences in concentration and attenuation from run to run. Further, use of a reference compound cannot quantify differences in peak shape that may result when multiple compounds with similar retention times are present, and can only be used to adjust relative peak heights. However, working under the assumption that two identical samples will have geometrically similar 214nm UV spectra, it is posited that through appropriate shifting and scaling two 214nm UV spectra may be compared directly for similarity. In particular, given two samples, first the HPLC-MS was used to determine the initial retention time of the first peak of interest, ti, and the final retention time of the final peak of interest, tf, of both samples. Then, the baseline was assumed to be linear and was removed from both samples via the equation:
It was assumed that for two identical samples there exist parameters A, b, h, and k such that
In other words, it was assumed that there exists appropriate vertical and horizontal scaling parameters (A and b, respectively) and vertical and horizontal shifting parameters (k and h, respectively) so that the UV spectra of identical samples can be made to “overlap” one another. Furthermore, for two samples that are not identical it may be thought to have the relationship
where integration of the difference term D(t) corresponds to the area between the two spectra after overlapping has occurred, and therefore quantifies differences in the relative makeups of the two samples. To this end, given two 214nm UV spectra, a variant of the Accelerated Random Search Algorithm {REF 18} can be used to find the optimal overlap parameters A, b, h, and k which minimize the area between the two spectra; this minimum area serves as a measure of the “difference” between the two samples (See Figure 1). The Accelerated Random Search Algorithm is an optimization algorithm shown in {REF 18} to have excellent rapid convergence properties while maintaining consistency and requiring minimal parameter manipulation to achieve optimal results.
In order to test the resolution of the above method a synthetic mixture of 15 compounds (type C scheme 1) (termed “stock solution” from here on out) was made using L-Phenylalanine (R1), L-Phenylalanine (R2) and X3 (where X3 represents a mixture of the 15 sulfonyl chlorides of interest using the prescribed ratios calculated as in Table 2). Multiple aliquots of this stock solution were made and spiked with one of three different individual compounds (D-34, D-37, D-45) at one of three different percentage increases, 25%, 50%, and 100%. The samples were then analyzed using the HPLC-MS 214nm UV spectra, with each sample compared to the un-spiked stock solution. Optimal overlapping was performed as described above, and the area between the resulting curves was calculated (See Figures 2 and 3, and Table 3). The spectra after overlapping clearly show differences even when only 25% additional compound is added, and the area difference between the curves scales linearly with the amount of compound added. Unsurprisingly, the compound with the lowest correction factor (and therefore highest UV absorptivity), D-37 (correction factor of 0.51, Table 2), also had the greatest slope; the compound with the highest correction factor (and therefore lowest UV absorptivity), D-34, had the lowest slope.
Figure 2.

214nm UV spectra of stock solution spiked with specific compounds, as compared to the stock solution alone, after optimal overlap correction.
Figure 3.

Errors are between 214nm UV spectra of stock solution spiked with specific compounds, as compared to the stock solution alone, after optimal overlap correction. The relationship between the percentage errors and amount of compounded added is clearly linear, with all R2 values exceeding 0.99. Steeper slopes correspond to higher UV absorptivity.
Table 3.
Percentage error between 214nm UV spectra of stock solution spiked with specific compounds, as compared to the stock solution alone.
| Test Sample | Comparison to Stock Solution |
|---|---|
| Stock Solution | 0.61% |
| Stock Solution + 25% D-34 | 2.22% |
| Stock Solution + 50% D-34 | 3.48% |
| Stock Solution + 100% D-34 | 5.97% |
| Stock Solution + 25% D-37 | 5.09% |
| Stock Solution + 50% D-37 | 8.24% |
| Stock Solution + 100% D-37 | 16.79% |
| Stock Solution + 25% D-45 | 2.77% |
| Stock Solution + 50% D-45 | 4.62% |
| Stock Solution + 100% D-45 | 8.22% |
With the ability to compare UV spectra directly, the following experiment was devised to determine the impact of differing on-resin amino acids to the reaction rates of the sulfonyl chlorides. Ideally, in order for the above ratios to produce as equimolar a mixture as possible, the group of all on-resin functionalities should react at approximately the same average rate as the specific functionality used to calculate the ratios (L-Phenylalanine). Two different on-resin starting materials were prepared; one with L-Phenylalanine used in the R1 and R2 positions (Scheme 1 Compound A) and one with an equal molar mixture of 66 amino acids (including L, D, and unusuals) in the R1 and R2 positions (Scheme 1 Compound B). The two reaction vessels were set up. In the first reaction vessel two “tea bags” {REF 16} were added, one containing compound A and the other containing compound B. In the second reaction vessel two tea bags both containing compound A were added. To each vessel an equal molar mixture of the 15 sulfonyl chlorides was added. It was added so as to provide only a 1 equivalent amount of sulfonyl chloride to available free amine (note this differs from the 8 fold excess used above). The assumption is that in the presence of Compound B, if Compound B has an average reaction rate to any of the sulfonyl chlorides that differs drastically from that of Compound A, it will disrupt the equimolarity of the reagents reacting with Compound A and cause an unequal distribution of products. The final mixture products (of the form Compound C Scheme 1) from Compound A reacted in the presence of Compound B and in the absence of Compound B were analyzed using HPLC-MS 214nm UV, and their spectra were compared both to each other and to the aforementioned stock solution (done using the corrected ratios with an eight fold excess). (See Figure 4).
Figure 4.

214nm UV spectra after optimal overlap correction of 8-fold stock solution and 1-fold reactions. The differences between the samples are not substantial.
The largest difference between spectra for the stock solution (using the 8 fold excess) and the spectra from the mixture products derived from Compound A using the 1 fold excess in the presence and absence of Compound B occurs at an approximate retention time of 17.0 minutes. This corresponds to Compound D-34, L-Phenylalanine (R1), L-Phenylalanine (R2), Thiophene-2-sulfonyl chloride (R3); this difference is unsurprising since D-34 has such a slow reaction rate (Table 2). Most importantly, the spectra for both the 1 fold excess Compound C samples do not differ substantially from one another, with an overall difference of 7.01%. There are slight differences between the spectra at all retention times, but the largest difference occurs at an approximate retention time of 18.85 minutes. This peak corresponds to Compound D-41, L-Phenylalanine (R1), L-Phenylalanine (R2), 4-iodobenzene-1-sulfonyl chloride (R3) and Compound D-42, L-Phenylalanine (R1), L-Phenylalanine (R1), 4-(trifluoromethyl)benzene-1-sulfonyl chloride (R3), both of which have similar correction factors to the control D-45, L-Phenylalanine (R1), L-Phenylalanine (R2), 4-tert-butylbenzene-1-sulfonyl chloride (R3) (See Table 2). In the spiking experiment described early, it was determined that a mixture which contained two-fold the amount of D-45 corresponded to a difference in spectra of 8.22%, therefore we posit that no single compound molarity in the mixture obtained from reacting Compound A in the presence of Compound B differs more than two-fold from that of the mixture obtained from reacting Compound A in the absence of Compound B. In fact, since the 7.01% error is distributed amongst multiple peaks, and multiple compounds are present in certain peaks, it is likely that the difference in relative constituency is far less than 2-fold. This means that the average reaction rate of all on-resin functionalities is only marginally different from the reaction rates used to calculate the ratios for this specific reaction.
The Robustness of Combinatorial Libraries to Errors in Equimolarity
Although the possibility of differing reaction rates resulting in a 2-fold error in equimolarity may seem to preclude usefulness for this library for meaningful screening data, this is in fact not the case. To demonstrate this, hypothetical mixtures containing various percentages of 10 nM IC50 active compounds and 1,000 nM IC50 inactive compounds were considered in association with a simple competitive binding assay. The IC50 of such a mixture as a function of its percentage of active compounds may be calculated directly using the harmonic mean {REF 19}. To determine the effect of n-fold error in the equimolarity of compounds in this setting, for each percentage of active compounds a Monte Carlo simulation was performed, generating a uniform error in relative abundance of at most n-fold, for n = 2, 5, and 10. The upper and lower bounds of the middle 95% of simulations is plotted in Figure 5 as a function of the percentage of active compounds; as is evident, even a 10-fold maximal error in equimolarity did not result in even a 2-fold error in mixture IC50 at any percentage of active compounds. The maximal errors in equimolarity presented herein are therefore well within the acceptable range for use in screening.
Figure 5.

The results of a Monte Carlo simulation demonstrating the robustness of mixtures to errors in equimolarity when tested in simple competitive binding assays.
The values 10 nM and 1,000 nM are representative of the harmonic mean of the “active” individual compounds versus the “inactive” individual compounds within the mixture. This does not mean to imply that the mixture will always contain a compound 100-fold better than the current best, but rather that the mixture contains some compounds that bind well, and others that do not bind at all. In our experience, a 100-fold difference in activity amongst the thousands of compounds in the library is a reasonable assumption.
Application to the Design of Two New Positional Scanning Libraries
The correction factors obtained for the sulfonyl chlorides were then applied to synthesize two heterocyclic positional scanning libraries. A linear sulfonamide precursor is synthesized using the “tea bag” method. Two different cyclizations are applied to form either a 2-piperazine sulfonamide library or a 2-guanidine sulfonamide library (See scheme 1 structure 7 and 8). As mentioned earlier and reported in Table S1 in the supplementary information, 104 individual compounds were synthesized and analyzed in order to test the robustness of different functionalities at the three diversity positions. The results of the sulfonyl chlorides analyzed and the resulting 15 chosen for ratio determination are shown in Table 1. These 15 sulfonyl chlorides were all used in the synthesis of the two new positional scanning libraries (7 and 8). In Table S1 in the supplementary information we also report the results obtained from testing different functionalities at the R1 and R2 positions. From these results 34 amino acids (L, D and unusual) were selected for the libraries. Each library therefore contains 17,340 compounds (34 × 34 × 15). A list of the amino acids used in the libraries as well as their associated ratios can be found in the Supplementary Information (Table S2).
Evaluation of Two New Positional Scanning Libraries in Mu and Kappa Binding Assays
The two new libraries 7 and 8 were both screened in two different opioid binding assays, a mu binding assay and a kappa binding assay (Complete results can be found in the supplementary information - See Table S3 supplementary information). The screening was done in part to confirm the integrity of the synthesis of the libraries. The harmonic mean offers an excellent method of using such positional scan data to assess the integrity of the synthesis process {REF 19}. In particular, since each position subdivides the entire library, if the individual compounds are equimolar in all mixtures then the harmonic mean of the IC50s of the mixtures in each position should be the same, and that value should also be the IC50 of the All X mixture. On the other hand, if there is substantial difference in the constituents of the mixtures by position, then the harmonic means at each position may be drastically different. In Table 4 we see the harmonic means of the IC50s of the mixtures at each position, for both targets and both libraries. For mixtures that did not show substantial activity at high doses, IC50s were extrapolated using single-point percent inhibition. The All X was also treated in this manner. As is evident, the resulting harmonic means do not vary substantially, with a maximal deviation of 1.55-fold and most values quite a bit more similar. This is well within the resolution of the assay, and we can therefore be further confident that there is not substantial difference in the constituencies of the mixtures at the different positions.
Table 4.
The harmonic mean values for Library 7 and 8 in mu and kappa binding assays.
| Experimental IC50, Untested Extrapolated from %Inh (nM) | ||||
|---|---|---|---|---|
| Library 7 | Library 8 | |||
| MU | KAPPA | MU | KAPPA | |
| R1 | 11147 | 10971 | 4444 | 15357 |
| R2 | 8864 | 9019 | 4992 | 15792 |
| R3 | 9508 | 9345 | 5249 | 13343 |
| All X | 8134 | 7416 | 6884 | 14337 |
Discussion Regarding Use of Detection Methods in Determining Isokinetic Ratios
It should be noted that we initially assessed the validity of utilizing the MS portion of the HPLC-MS in determining the ratios for the reaction studied in this manuscript. However it quickly became apparent that correction factors would be needed for MS as equal molar mixtures of two compounds did not produce equal ratios of ions and the MS signal does not scale linearly with molarity. Additionally we determined that the MS was less consistent than the UV component at providing reproducible data. For example if we injected the same equal molar mixture of two components into the HPLC-MS over multiple runs the run to run variation in UV absorption was significantly lower than the variation in the MS ionization. Therefore the MS did not provide any advantage over the UV component in determining our isokinetic ratios.
At the time of this study we did not have reasonable access to an NMR for use in determining the ratios of this reaction. This in of itself is one advantage of the method we report in our manuscript as a researcher would theoretically only need use of an HPLC to determine relative ratios. The MS component is only used as confirmation of compound identity. Since an HPLC is more affordable and likely more available to a wider number of researchers than either HPLC-MS or NMR we felt our reported approach would be more applicable. It should be noted that we now do have reasonable access to an NMR and are currently working out a method for calculating ratios with the NMR. However at this time we are finding that one limiting factor is the non-consistent confounding influence of the solvent peak which strongly biases attempts for direct overlap. We are hoping to resolve this problem and soon report our findings on the use of NMR for the determination of isokinetic ratios.
Conclusion
We have demonstrated the utility of a new method for determining the isokinetic ratios of reactant species. We then applied it in order to calculate the ratios for mixtures of sulfonyl chlorides reacted with on-resin amines. In doing so we also demonstrated a new method to access the effect of the on-resin amines toward the relative reaction rates of mixtures of sulfonyl chlorides and shown that our calculated ratios are not substantially effected by the on-resin amines. These new methodologies can be applied to study a wide variety of isokinetic ratios and the only instrument of analysis needed is an HPLC.
Additionally the determination of ratios for the formation of a sulfonamide bond enables us to expand the diversity of current positional scanning libraries. The two specific libraries described in this publication have been added to our current collection of positional scanning libraries that are available for use through collaborative efforts.
Experimental Procedure
General procedure for individual compounds 5 (as outlined in Scheme 1). A tea bag filled with mBHA resin is neutralized with 3 washes of 5% DIEA in DCM. The tea bag filled with neutralized resin is added to a reaction vessel that has been allowed to preactivate for 15 minutes with a Boc-AA [6eq, 0.1M dimethylformamide (DMF)], DIC (6eq, 0.1M DMF) and HOBT (6eq, 0.1M DMF) for 2 hours at room temperature, followed by washes DMF (2×) and dichloromethane, DCM (2 ×). The Boc was removed using 55% trifluoroacetic acid in DCM for 30 minutes, followed by washes with DCM (2×), IPA (2×), and DCM (3×). Then the resin was neutralized using 5% DIEA in DCM (3×) followed by washes of DCM (3×). This was repeated so that a compound 2 was obtained. Sulfonyl chloride (8eq, 0.1M anhydrous DCM) was coupled to 2 using DIEA (8eq) overnight producing compound 3. Each coupling reaction was monitored by the use of the ninhydrin test to ensure the coupling was complete. The tea bag containing 3 was added to a reaction vessel containing a 40 fold excess of BH3-THF and heated at 60°C for 96hr after which the solution was poured off and the resin filled tea bag was treated with piperidine at 60°C for 24hr.
General procedure for individual compounds 7. A tea bag containing compound 5 is added to a reaction vessel containing bromoacetic acid (5eq, 0.1M anhydrous DCM), DIC (5eq), and DIEA (2.5eq) and shaken overnight. The solution is poured off and excess reagents are washed off by successive washes with DMF and DCM. The resulting products 6a and 6b are then added to a reaction vessel containing a 40 fold excess of BH3-THF and heated at 60°C for 96hr after which the solution was poured off and the resin filled tea bag was treated with piperidine at 60°C for 24hr. The resin is allowed to dry prior to cleavage with HF/anisole at 0°C for 7hrs. The final product 7 is extracted from the resin using 95% Acetic acid frozen and lyophilized. After which it is dissolved in a solution of 50% acetonitrile and 50% water, frozen, and lyophilized before the dry powder is then analyzed. (note: It should be noted that several other methods for transforming compounds of type 5 to compounds of type 7 were attempted including treatment with oxalyldiimidazole followed by reduction as well as several different conditions involving the use of 1,2-dibromoethane in order to circumvent the need for the second reduction. However none of the tested conditions produced the desired test compounds in the yields and quality that the method described here did. The results of the 1,2-dibromoethane experiments are the subject matter of previous publication { REF 20} and will also be addressed in future publications.) H1NMR of 7–33 N-((S)-1-((S)-2-benzylpiperazin-1-yl)-3-(4-hydroxyphenyl)propan-2-yl)benzenesulfonamide (500MHz, DMSO-d6): δ 8.30 (1H,s), 7.67 (2H, d, J=5.0 Hz), 7.54 (1H, t) 7.45 (2H, t), 7.27- 7.02 (10H, m), 3.33 (2H, s), 2.78 (1H, q), 2.64-2.53 (6H, m), 2.39 (2H, s), 2.31 (2H, q), 2.24 (1H, q), 1.23 (1H, s).
General procedure for individual compounds 8. A tea bag containing compound 5 is added to a reaction vessel containing cyanogen bromide (5eq, 0.1M anhydrous DMF) and shaken overnight. The solution is poured off and excess reagents are washed off by successive washes with DMF and DCM. The resin is allowed to dry prior to cleavage with HF/anisole at 0°C for 1.5hrs. The final product 8 is extracted from the resin using 95% Acetic acid frozen and lyophilized. After which it is dissolved in a solution of 50% acetonitrile and 50% water, frozen, and lyophilized before the dry powder is then analyzed. H1NMR of 8–40 N-((S)-1-((S)-5-benzyl-2-iminoimidazolidin-1-yl)-3-phenylpropan-2-yl)-4-bromobenzenesulfonamide (500 MHz, DMSO-d6): δ 8.45 (1H, s), 7.50 (1H, d, J=1.7 Hz), 7.49 (4H, d, J=1.8 Hz), 7.37 – 7.22 (5H, m), 7.09- 7.01 (6H, m), 3.68 (2H, quin), 3.32 (1H, t), 3.22 (1H, t), 3.22 (1H,q), 2.96- 2.93 (2H, m) 2.67- 2.62 (3H, m).
General procedure for μ Receptor binding assay: Rat cortices were homogenized using 50 mM Tris, pH 7.4, and centrifuged at 16,500 rpm for 10 min. The pellets were resuspended in fresh buffer and incubated at 37°C for 30 min. Following incubation, the suspensions were centrifuged as before, the resulting pellets resuspended in 100 volumes of buffer A plus 2 mg/ml bovine serum albumin (membrane buffer) and the suspensions combined. Each assay tube contained 0.5 ml of membrane suspension, 2 nM [3H]-DAMGO, and 0.02 mg/ml mixture in a total volume of 0.65 ml. Assay tubes were incubated for 1 h at 25°C. The reaction was terminated by filtration through GF/B filters, soaked in 5 mg/ml bovine serum albumin, 50 mM Tris, pH 7.4, on a Tomtec Mach II Harvester 96. The filters were subsequently washed with 6 ml of assay buffer. Unlabeled DAMGO was used as a competitor to generate a standard curve and determine nonspecific binding. Bound radioactivity was counted on a Wallac Betaplate Liquid Scintillation Counter.
General procedure for κ Receptor binding assay: Guinea pig cortices and cerebella were homogenized using 50 mM Tris, pH 7.4, 10 mM MgCl2-6H2O, 200 µM PMSF (assay buffer) and centrifuged at 16,500 rpm for 10 min. The pellets were resuspended in fresh buffer and incubated at 37°C for 30 min. Following incubation, the suspensions were centrifuged as before, the resulting pellets resuspended in 100 volumes of buffer A plus 2 mg/ml bovine serum albumin (membrane buffer) and the suspensions combined. Each assay tube contained 0.5 ml of membrane suspension, 2 nM [3H]U69,593, and 0.02 mg/ml mixture in a total volume of 0.65 ml. Assay tubes were incubated for 2 h at 25°C. The reaction was terminated by filtration through GF/B filters, soaked in 5 mg/ml bovine serum albumin, 50 mM Tris, pH 7.4, on a Tomtec Mach II Harvester 96. The filters were subsequently washed with 6 ml of assay buffer. Unlabeled U50,488 was used as a competitor to generate a standard curve and determine nonspecific binding. Bound radioactivity was counted on a Wallac Betaplate Liquid Scintillation Counter.
Supplementary Material
Acknowledgments
The authors are grateful for the support of the National Institute on Drug Abuse (DA031370) and the State of Florida, Executive Office of the Governor’s Office of Tourism, Trade, and Economic Development. The authors would also like to thank Jon Appel for his editorial assistance and excellent critiques.
References
- REF 1.Dolle RE, Bourdonnex BL, Worm K, Morales GA, Thomas CJ, Zhang W. Comprehensive Survey of Chemical Libraries for Drug Discovery and Chemical Biology: 2009. J. Comb. Chem. 2010;12:765–806. doi: 10.1021/cc100128w. [DOI] [PMC free article] [PubMed] [Google Scholar]
- REF 2.Houghten RA, Pinilla C, Giulianotti MA, Appel JR, Dooley CT, Ostresh JM, Yu Y, Maggiora GM, Medina-Franco JL, Brunner D, Schneider J. Strategies for the Use of Mixture-Based Synthetic Combinatorial Libraries: Scaffold Ranking, Direct Testing In Vivo, and Enhanced Deconvolution by Computational Methods. J. Comb. Chem. 2008;10:3–19. doi: 10.1021/cc7001205. [DOI] [PubMed] [Google Scholar]
- REF 3.Pinilla C, Appel JR, Borràs E, Houghten RA. Advances in the use of synthetic combinatorial chemistry: Mixture-based libraries. Nature Medicine. 2003;9:118–122. doi: 10.1038/nm0103-118. [DOI] [PubMed] [Google Scholar]
- REF 4.Reilley KJ, Giulianotti M, Dooley CT, Nefzi A, McLaughlin JP, Houghten RH. Identification of Two Novel, Potent, Low-Liability Antinociceptive Compounds from the Direct In Vivo Screening of a Large Mixture-Based Combinatorial Library. The AAPS Journal. 2010;12:318–329. doi: 10.1208/s12248-010-9191-3. [DOI] [PMC free article] [PubMed] [Google Scholar]
- REF 5.Judkowski V, Bunying A, Ge F, Appel JR, Law K, Sharma A, Raja-Gabaglia C, Norori P, Santos RG, Giulianotti MA, Slifka MK, Douek DC, Graham BS, Pinilla C. GM-CSF Production Allows the Identification of Immunoprevalent Antigens Recognized by Human CD4 + T Cells Following Smallpox Vaccination. PLoS ONE. 2011;6(9):e24091. doi: 10.1371/journal.pone.0024091. [DOI] [PMC free article] [PubMed] [Google Scholar]
- REF 6.Houghten RA, Pinilla C, Blondelle SE, Appel JR, Dooley CT, Cuervo JH. Generation and use of synthetic peptide combinatorial libraries for basic research and drug discovery. Nature. 1991;354:84–86. doi: 10.1038/354084a0. [DOI] [PubMed] [Google Scholar]
- REF 7.Lam KS, Salmon SE, Hersh EM, Hruby VJ, Kazmierski WM, Knapp RJ. A new type of synthetic peptide library for identifying ligand-binding activity. Nature. 1991;354:82–84. doi: 10.1038/354082a0. [DOI] [PubMed] [Google Scholar]
- REF 8.Furka A, Sebestyėn F, Asgedom M, Dibó G. General Method for rapid synthesis of multicomponent peptide mixtures. Int. J.Peptide Protein Res. 1991;37:487–493. doi: 10.1111/j.1399-3011.1991.tb00765.x. [DOI] [PubMed] [Google Scholar]
- REF 9.Ostresh JM, Winkle JH, Hamashin VT, Houghten RA. Peptide Libraries: Determination of Relative Reaction Rates of Protected Amino Acids in Competitive Couplings. Biopolymers. 1994;34:1681–1689. doi: 10.1002/bip.360341212. [DOI] [PubMed] [Google Scholar]
- REF 10.Ljungdahl T, Veide-Vilg J, Wallner F, Tamas MJ, Grøtli M. Positional Scanning Peptide Libraries for Kinase Substrate Specificity Determinations: Straightforward and Reproducible Synthesis Using Pentafluorophenyl Esters. J. Comb. Chem. 2010;12:733–742. doi: 10.1021/cc100095y. [DOI] [PubMed] [Google Scholar]
- REF 11.Acharya AN, Ostresh JM, Houghten RA. Determination of Isokinetic Ratios Necessary for Equimolar Incorporation of Carboxylic Acids in the Solid-Phase Synthesis of Mixture-Based Combinatorial Libraries. Biopolymers. 2002;65:32–39. doi: 10.1002/bip.10206. [DOI] [PubMed] [Google Scholar]
- REF 12.Dombi KL, Steiner UE, Richert C. Rapidly Measuring Reactivities of Carboxylic Acids to Generate Equireactive Building Block Mixtures: A Spectrometric Assay. J. Comb. Chem. 2003;5:45–60. doi: 10.1021/cc020069y. [DOI] [PubMed] [Google Scholar]
- REF 13.Ostresh JM, Schoner C, Giulianotti M, Kurth M, Dörner B, Houghten R. Combinatorial libraries: Equimolar incorporation of benzaldehyde mixtures in reductive alkylation reactions. Peptides Frontiers of Peptide Science. American Peptide Symposia. 2002;5:57–58. [Google Scholar]
- REF 14.Nefzi A, Ostresh JM, Yu J, Houghten RA. Combinatorial Chemistry: Libraries from Libraries, the Art of the Diversity-Oriented Transformation of Resin-Bound Peptides and Chiral Polyamides to Low Molecular Weight Acyclic and Heterocyclic Compounds. J. Org. Chem. 2004;69:3603–3609. doi: 10.1021/jo040114j. [DOI] [PubMed] [Google Scholar]
- REF 15.Nefzi A, Ostresh JM, Meyer J-P, Houghten RA. Solid Phase Synthesis of Heterocyclic Compounds From Linear Peptides: Cyclic Ureas and Thioureas. Tetrahedron Letters. 1997;38:931–914. [Google Scholar]
- REF 16.Houghten RA. General method for the rapid solid-phase synthesis of large numbers of peptides: Specificity of antigen-antibody interaction at the level of individual amino acids. Proc. Natl. Acad. Sci. USA. 1985;82:5131–5135. doi: 10.1073/pnas.82.15.5131. [DOI] [PMC free article] [PubMed] [Google Scholar]
- REF 17.Boutin JA, Gesson I, Menlin J-M, Bertin S, Lambert P-H, Volland J-P, Fauchėre J-L. Limitations of the coupling of amino acid mixtures for the preparation of equimolar peptide libraries. Molecular Diversity. 1997;3:43–60. doi: 10.1023/a:1009602707067. [DOI] [PubMed] [Google Scholar]
- REF 18.Appel MJ, LaBarre R, Radulović D. On Accelerated Random Search, SIAM. J. Optim. 2003;14:708–731. [Google Scholar]
- REF 19.Santos RG, Giulianotti MA, Dooley CT, Pinilla C, Appel JR, Houghten RA. Use and Implications of the Harmonic Mean Model on Mixtures for Basic Research and Drug Discovery. ACS Comb. Sci. 2011;13:337–344. doi: 10.1021/co100065a. [DOI] [PMC free article] [PubMed] [Google Scholar]
- REF 20.Nefzi A, Mimna RA, Houghten RA. Parallel Solid-Phase Synthesis of Disubstituted 1,6-Piperazine-2-ones. J. Comb. Chem. 2002;4:542–545. doi: 10.1021/cc0200235. [DOI] [PubMed] [Google Scholar]
Associated Data
This section collects any data citations, data availability statements, or supplementary materials included in this article.