

Abstract
Introduction
Burn injury leads to vast changes in both metabolic and inflammatory responses and is associated with increased morbidity and mortality. Insulin resistance (IR) and hyperglycemia are major components of the hypermetabolic response found in burn-injured patients and subsequently contribute to adverse outcomes. Studies have shown that increased systemic retinol binding protein (RBP) levels are associated with IR and hyperinflammation in diabetic and obese patients. The aim of this study was to determine RBP profiles and to test the hypothesis that elevated RBP levels are associated with both IR and the inflammatory response in burned patients.
Methods
RBP was measured in 372 patients during the acute stay postburn. Patients’ demographics, glucose levels, and insulin administration were recorded. Cytokines, hormones, plasma proteins, and organ markers were measured. The average of all measurements of RBP (2.1 mg/dL) was used to divide patients into high and low groups. Statistical analysis was performed by Student t test. Statistical significance was accepted at P < .05.
Results
Fifty-one patients (high group) had elevated RBP levels during acute hospitalization and demonstrated a significant higher incidence of multiorgan failure, sepsis, and mortality (P < .05). Moreover, in the high group, a significant increase of IR, inflammatory cytokines, and catabolic and organ-specific markers were detected (P < .05).
Conclusions
Increased RBP levels postburn correlate with increased IR, inflammatory and catabolic responses, incidence of multiorgan failure, and mortality. RBP may be a novel biomarker to monitor these detrimental responses postburn.
Keywords: insulin resistance, burn injury, retinol binding protein (RBP), renal function, inflammation, catabolism
Clinical Relevancy Statement
Posttraumatic, stress-induced insulin resistance (IR) is a major complication following burn injury that is associated with several clinical complications. The study investigates the use of retinol binding protein (RBP) as a possible target of monitoring the hyperglycemic response and inflammatory processes postinjury. Moreover, the findings of molecular biological studies are put into a clinical context depicting possible relationships of RBP levels and organ-specific complications. The relevance of our study is that we were able to show that RBP plays a more important role than previously thought and may predict IR and hyperglycemia in trauma or severely injured patients.
Introduction
Retinol binding protein (RBP), mainly expressed by liver cells and adipocytes, not only is the only known carrier for the important antioxidant vitamin A (retinol)1 but has also been shown to be involved in the pathways of insulin resistance found in type 2 diabetes.1,2 This is supported by evidence that knockout rodents deficient for GLUT 4 receptors in adipocytes exhibit increased systemic levels of RBP.3 It has been shown that injection of RBP impairs the insulin signaling pathway and induces the gluconeo-genic pathway of phosphoenolpyruvate decarboxylase in the liver, leading to enhanced insulin resistance (IR).3
Insulin resistance is commonly found postburn.4–7 Impaired insulin sensitivity results in reduced glucose uptake into the cells and subsequent hyperglycemia postburn.8,9 Although discussion of IR and hyperglycemia in critically ill patients has been controversial, studies in burn patients have frequently shown that hyperglycemia is associated with increased morbidity and mortality.4,5,10–14
A study conducted by Graham et al2 showed a positive correlation between IR and serum RBP levels in diabetic patients. In addition, studies are providing further evidence that RBP plays an important role in glucose metabolism.3,15 It has been shown that systemic RBP4 expression in humans is associated with inflammatory processes.16,17
However, to date, no large studies have examined the involvement of RBP in a stress-induced IR scenario. We chose to examine the relationship between RBP, clinical parameters, and outcomes in our pediatric burn population. The various underlying cellular mechanisms and the involved pathways of trauma-induced IR are currently the subject of several investigations.18–20 On a cellular level, current research is focused on the insulin receptor, insulin receptor substrates, and phosphotidylinositol 3-kinase/Akt pathways.21,22 The complete mechanisms in burns are unknown, and it is suspected that different underlying mechanisms exist.18 However, using the fact that stressinduced IR in burn patients is a predominant factor in hyperinflammatory and hypermetabolic processes, this patient population is ideal to examine a possible correlation between systemic RBP levels, IR, metabolic response, and inflammation.23 We hypothesize that elevated systemic RBP levels reflect insulin resistance and inflammation and might serve as a surrogate marker for IR and inflammation in severely burned patients.
Patients and Methods
Patients were resuscitated according to the Galveston formula with 5000 cc/m2 total body surface area (TBSA) burned + 2000 cc/m2 TBSA lactated Ringer’s solution given in increments over the first 24 hours. Within 48 hours of admission, all patients underwent total burn wound excision, and the wounds were covered with autograft. Any remaining open areas were covered with homograft. After the first operative procedure, patients were taken back to the operation theater when donor sites were healed. This procedure was repeated until all open wound areas were covered with autologous skin.
All patients underwent the same nutrition treatment according to a standardized protocol. The intake was calculated as 1500 kcal/m2 body surface + 1500 kcal/m2 area burn as previously published.24 The nutrition route of choice in our patient population was enteral nutrition via a duodenal (Dobhof) or nasogastric tube.
Patient demographics (age, date of burn and admission, sex, burn size, and depth of burn) and concomitant injuries such as inhalation injury, sepsis, morbidity, and mortality were recorded. Sepsis was defined as a positive blood culture or pathologic tissue identifying a causative pathogen during hospitalization or at autopsy, in combination with at least 3 of the following: leucocytosis or leucopenia (>12,000 or <4000), hyperthermia or hypothermia (>38.5°C or <36.5°C), tachycardia (>150 bpm in children), refractory hypotension (systolic blood pressure <90 mm Hg), thrombocytopenia (platelets <50,000/mm3), hyperglycemia (serum glucose >240 mg/dL), and enteral feeding intolerance (residuals >200 cc/h or diarrhea >1 L/d) as previously published.25 Multiorgan failure was assessed continuously during the length of stay using the DENVER2 score.26
Cytokines and Proteins
Blood and/or urine were collected from burn patients at admission, preoperatively, and consecutively up to 60 days postinjury for serum protein and cytokine analysis. Blood was drawn in a serum separator collection tube and centrifuged for 10 minutes at 1320 rpm; the serum was removed and stored at −70°C until assayed.
Serum proteins C-reactive protein (CRP), osteocalcin, RBP, and prealbumin were determined using high-performance liquid chromatography, nephelometry (BNII; Plasma Protein Analyzer, Dade Behring, Bowie, MD), and enzyme-linked immunosorbent assay techniques. The Bio-Plex Human Cytokine 17-Plex panel was used with the Bio-Plex Suspension Array System (Bio-Rad, Hercules, CA) to profile expression of 17 inflammatory cytokines (interleukin [IL]−1β, IL-2, IL-4, IL-5, IL-6, IL-7, IL-8, IL-10, IL-12p70, IL-13, IL-17), monocyte chemoattractant protein-1 (MCP-1), and tumor necrosis factor α. The assay was performed according to the manufacturer’s instructions. Briefly, serum samples were thawed and then centrifuged at 4500 rpm for 3 minutes at 4°C. Serum samples were then incubated with microbeads labeled with specific antibodies to one of the aforementioned cytokines for 30 minutes. Following a wash step, the beads were incubated with the detection antibody cocktail, each antibody specific to a single cytokine. After another wash step, the beads were incubated with streptavidin-phycoerythrin for 10 minutes and washed, and the concentrations of each cytokine were determined using the array reader.
Body Mass Index
Body mass index (BMI) was calculated according to the formula recommended by the World Health Organization (WHO): BMI = weight (kg)/ height2 (m). To validate these results for age, we used percentile ranks for stratification.27
Ethics and Statistics
The study was reviewed and approved by the Institutional Review Board of the University of Texas Medical Branch, Galveston, Texas. Prior to the study, each patient, parent, or child’s legal guardian had to sign a written informed consent form. Data collection and analysis were performed using Microsoft Excel (Microsoft, Redmond, WA) and SigmaStat version 3.5 and SigmaPlot (Systat Software, San Jose, CA). Analysis of variance with post hoc Bonferroni correction, paired and unpaired Student t test, and χ2 analysis were used where appropriate. Correlations between patient characteristics were analyzed by using multiple linear regression analysis. Data are expressed as means ± SD or SEM, where appropriate. Significance was accepted at P < .05.
Results
Three-hundred seventy-two patients were included in the study. Patients were divided in 2 groups according to their average RBP levels over the length of stay in the intensive care unit. To date, no landmark for the predictive value of RBP exists. The average systemic RBP level of 2.1 mg/dL for all patients was chosen to serve as a cutoff level and then to assign the patients to high (H) and low (L) RBP according to their average RBP levels during the first 10 days. Stratification of the individuals resulted in 321 patients to the low group and 51 patients to the high group.
Patient Demographics and Outcomes
Patient demographics in both gender and ethnicity were similar in both groups. Patients with RBP high levels had a significantly older average age of 10.3 years (P < .05) than patients in the low group (7.8 years). Regarding injury characteristics, patients with high RBP levels had a slightly higher incidence of inhalation injury (RBP low, 45%; RBP high, 47%) combined with a larger burn size (third-degree TBSA: RBP low, 48%; RBP high, 51%; Table 1). Patients with high RBP showed an increased incidence of mortality (RBP low, 7%; RBP high, 29%; P < .001), multiorgan failure (RBP low, 17%; RBP high, 51%; P < .05), maximum DENVER2 score (RBP low, 3.5; RBP high, 5.1; P < .05), and sepsis (RBP low, 10%; RBP high, 39%; P < .001; Table 2). The length of stay per TBSA was higher in the patients with high RBP than in patients with low RBP (RBP low, 0.6 days; RBP high, 1.1 days; P < .05; Table 2).
Table 1.
Patient Characteristics of the Stratified Groups
| All | RBP Low | RBP High | P Value | |
|---|---|---|---|---|
| No. | 372 | 321 | 51 | |
| Gender, No. | ||||
| Male | 247 | 214 | 33 | |
| Female | 125 | 107 | 18 | |
| Ethnicity, No. | ||||
| African American | 23 | 21 | 2 | |
| White | 55 | 46 | 9 | |
| Hispanic | 292 | 252 | 40 | |
| Other | 2 | 2 | 0 | |
| Age at admittance, y | 8.1 ± 5.3 | 7.8 ± 5.1 | 10.3 ± 5.9 | <.05 |
| Inhalation injury, No. (%) | 169 (45.4) | 145 (45.2) | 24 (47.1) | NS |
| Type of burn, No. (%) | ||||
| Flame | 306 (82.3) | 263 (81.9) | 43 (84.3) | |
| Scald | 41 (11.0) | 38 (11.8) | 3 (5.9) | |
| Other | 25 (6.7) | 20 (6.2) | 5 (9.8) | |
| TBSA burn, second and third degree, % | 59.5 ± 17.7 | 59.3 ± 16.8 | 60.4 ± 23.1 | NS |
| TBSA, second degree, % | 11.5 ± 15.8 | 11.9 ± 16.2 | 9.1 ± 13.0 | NS |
| TBSA, third degree, % | 48.0 ± 24.4 | 47.5 ± 23.5 | 51.2 ± 29.9 | NS |
| Time, burn to admission, d | 2.6 ± 2.3 | 2.5 ± 2.0 | 3.0 ± 3.7 | NS |
Both groups showed similar characteristics in demographics and severity of injury.
NS, not significant; RBP, retinol binding protein; TBSA, total body surface area.
Table 2.
Patients’ Clinical Outcome Parameters
| All | RBP Low | RBP High | P Value | |
|---|---|---|---|---|
| No. | 372 | 321 | 51 | |
| Number OR | 5.1 ± 3.3 | 5.1 ± 3.4 | 5.2 ± 3.0 | NS |
| Time between OR | 5.3 ± 1.7 | 5.3 ± 1.7 | 5.1 ± 2.0 | NS |
| LOS ICU, d | 37.8 ± 27.1 | 36.1 ± 24.0 | 38.8 ± 29.2 | NS |
| LOS/TBSA | 0.7 ± 0.8 | 0.6 ± 0.3 | 1.1 ± 2.2 | <.05 |
| Died, No. (%) | 38 (10.2) | 23 (7.2) | 15 (29.4) | <.001 |
| Max DENVER2 | 3.7 ± 1.8 | 3.5 ± 1.5 | 5.1 ± 2.4 | <.05 |
| MOF, No. (%) | 81 (21.8) | 55 (17.1) | 26 (51.0) | <.05 |
| Sepsis, No. (%) | 54 (14.5) | 34 (10.6) | 20 (39.2) | <.001 |
| No. infections | 2.7 ± 2.5 | 2.6 ± 2.4 | 3.1 ± 3.1 | NS |
Data presented as mean ± SD unless otherwise indicated. Patients with low RBP levels showed a significantly lower incidence of clinical complications (MOF, sepsis) and mortality.
ICU, intensive care unit; LOS, length of stay; MOF, multiorgan failure; NS, not significant; OR, operations; RBP, retinol binding protein; TBSA, total body surface area.
Multiple linear regression analysis revealed a significant positive relationship between the severity of injury and systemic RBP levels during the first 10 days after burn injury. Third-degree TBSA burn showed positive correlation with systemic RBP levels (r = 0.205, P < .05). Total burn size and the incidence of inhalation injury failed to predict RBP levels in this model and therefore did not correlate significantly (Table 3). An independently conducted analysis exposed a positive correlation for age and systemic RBP levels (r = 0.173, P < .05).
Table 3.
Logistic Regression Analysis of RBP Levels, Injury Characteristics, and Age
| Coefficient | Standard Error | t | P Value | VIF | |
|---|---|---|---|---|---|
| Injury severity | 0.657 | 0.18 | 3.654 | <.001 | |
| Inhalation injury | −0.12 | 0.0941 | −1.276 | .203 | 1.049 |
| TBSA burn | 0.00171 | 0.00395 | 0.434 | .665 | 2.235 |
| TBSA third degree | 0.00596 | 0.00288 | 2.068 | .039 | 2.302 |
| Age and systemic RBP levels | 1.221 | 0.083 | 14.705 | <.001 | |
| Age at admittance | 0.0289 | 0.00855 | 3.377 | <.001 | 1 |
The analysis revealed a significant positive relationship between injury severity (inhalation injury, TBSA third-degree burn), and systemic RBP levels during the hospital stay. Increasing age has a positive correlation to systemic RBP levels.
RBP, retinol binding protein; TBSA, total body surface area; VIF, variance inflation factor.
RBP Cutoff Value and Profile
The distribution of the individual RBP levels among the groups is shown in the box plot (Figure 1). The low group showed an equally distributed pattern among the quartiles, whereas patients in the high group skewed toward the upper quartile with maximum values around 4 mg/dL and 5 outliers above the 98th percentile.
Figure 1.
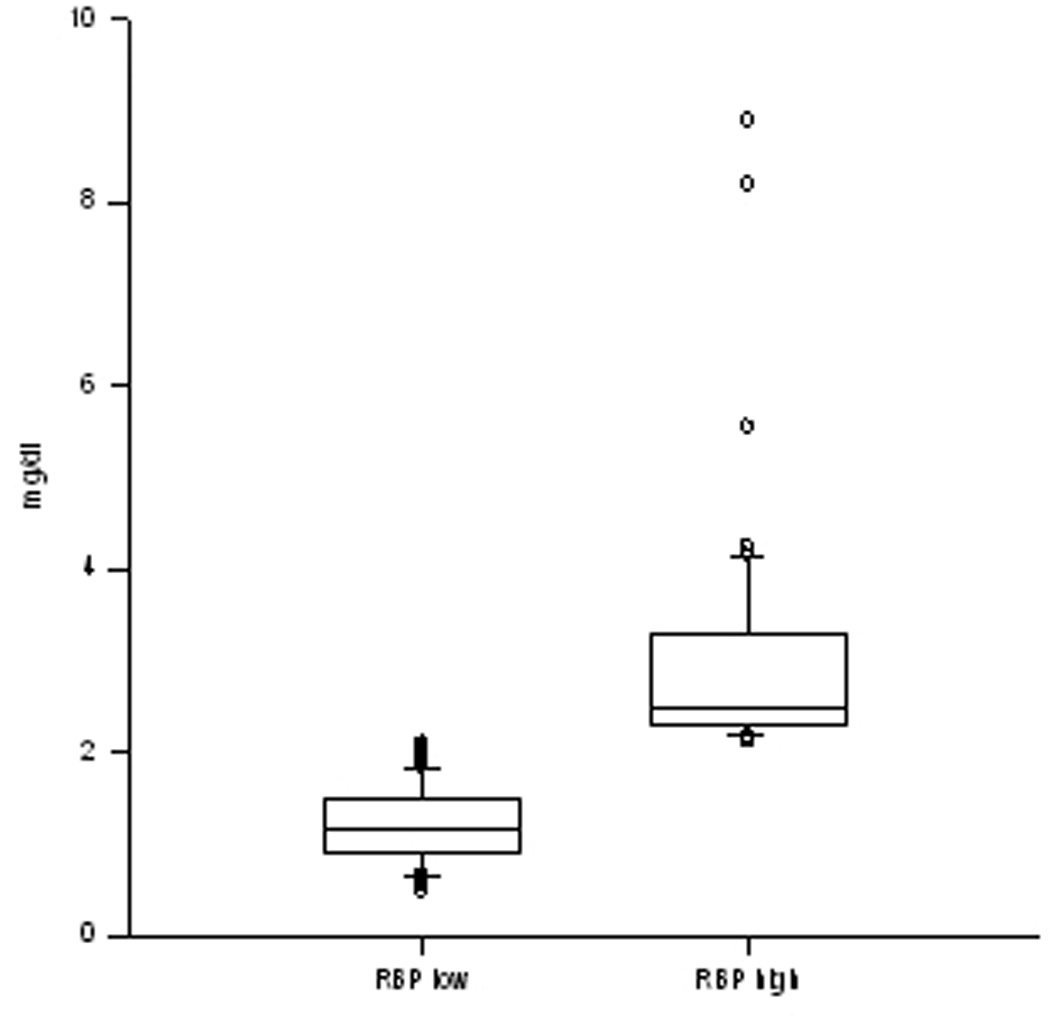
Box plot of the retinol binding protein (RBP) values of both groups. Both groups showed consistency in their RBP levels. The RBP high group skewed toward the upper quartile with a maximum of 4 mg/dL, whereas in the RBP low group, the values are nearly equally distributed among the patients.
Average RBP values increased during hospitalization at a similar rate in both groups, whereas values remained significantly lower in the low group during the studied period (Figure 2).
Figure 2.

Retinol binding protein (RBP) levels shown over time. The high group showed an immediate onset in the early phase, whereas the low group had a remarkable increase after day 10. Exponential trend lines indicate a persistent increase over time in both groups (data presented as mean ± SEM).
Glucose Insulin
Patients in the low RBP group required significantly less (P < .05) exogenous insulin and had significantly lower (P < .05) plasma glucose levels than the patients in the high RBP group during the first 5 weeks of study. In the subsequent days, levels were similar in both groups (Figure 3).
Figure 3.

Glucose levels and units of insulin given. Patients with high systemic retinol binding protein (RBP) levels had significantly higher glucose levels combined with a significantly higher insulin demand, indicating insulin resistance (data presented as mean ± SEM).
Cytokines
By analyzing inflammatory cytokines, we found that IL-6 and IL-8 levels were significantly higher in the high RBP group than in the low RBP during the first 3 to 4 weeks after injury (Figure 4A,B; P < .05). Similarly, MCP-1 and osteocalcin plasma levels were significantly increased in the high RBP during the first 5 weeks postburn (Figure 4C,D; P < .05). Other analyzed cytokines showed no statistical difference between both groups (data not shown).
Figure 4.

Inflammatory markers. Cytokine response demonstrated by the established and key regulatory proteins (A) interleukin (IL)−8 and (B) IL-6. Catabolic regulators for bone mineral content and lipolysis (C) monocyte chemoattractant protein-1 (MCP-1) and (D) osteocalcin (OCAL) (data presented as mean ± SEM). Significance: p<0.05
Organ Markers and Liver-Synthesized Proteins
Organ markers such as blood urea nitrogen, bilirubin, and creatinine were also significantly elevated in the high RBP group (Figure 5A–C; P < .05). Liver-synthesized prealbumin, the acute-phase protein CRP, and plasmalevel triglycerides were also significantly higher in the high RBP group than in the low RBP group during the total period of study (Figure 5D–F; P < .05).
Figure 5.

Liver-synthesized proteins and triglycerides. Higher (A) C-reactive protein (CRP) levels after day 17, demonstrating a prolonged inflammatory response in the retinol binding protein (RBP) high group. (B) Prealbumin (PALB) as an important molecule in the carrier system for RBP is correlating with systemic high RBP levels. (C) Significantly higher triglyceride (TG) levels in the high group indicating diminished metabolism and lipolysis. Organ-specific markers for (D, E) renal and (F) liver (F) function were significantly elevated in the RBP high group (data presented as mean ± SEM). BUN, blood urea nitrogen; CRE, creatinine; BIL, bilirubin. Significance: p<0.05
BMI
Patients with high RBP levels had a remarkably higher BMI corrected for age (RBP low, 20; RBP high, 23; P < .005) and a significantly higher absolute BMI (RBP low, 78th percentile; RBP high, 82nd percentile) compared to the low-level group (P < .05; Figure 6). This result corresponds with the on average older patients in the RBP high group.
Figure 6.
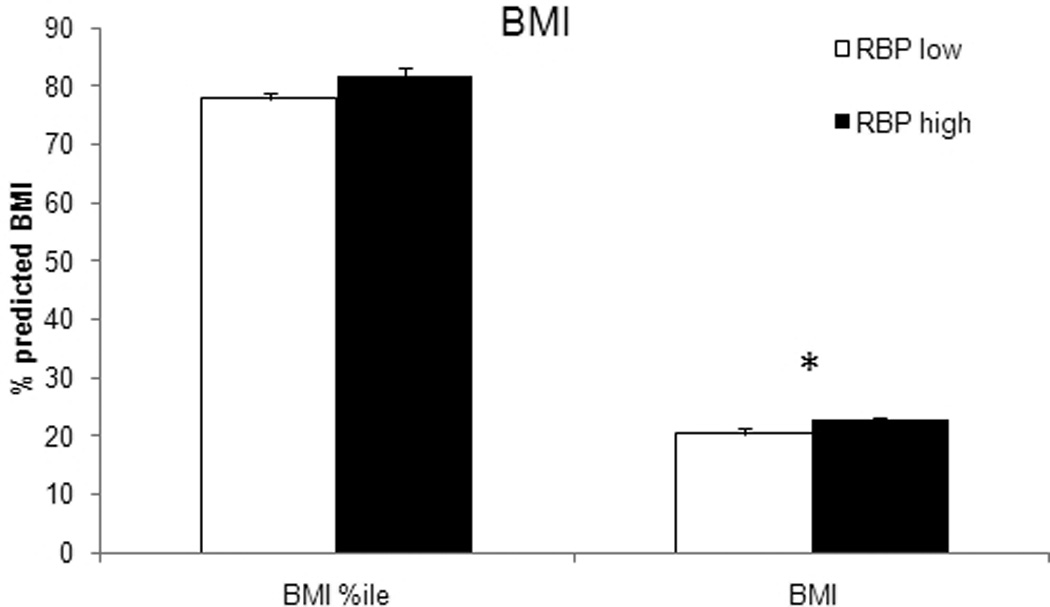
Comparison of the body mass index (BMI) at admission. Patients in the high retinol binding protein (RBP) group had a significantly higher absolute BMI corrected for age according to their percentile, indicating an elevated body fat content. Significance: p<0.05
Discussion
Hypermetabolism and inflammation are determinants for outcomes after severe burn injury.28,29 The detrimental effects of these pathophysiological processes lead to a higher incidence of comorbidities, infectious complications, and a prolonged need for rehabilitation.30,31 A portion of this response is attributed to the effects of hyperglycemia and insulin resistance, but the discussion of these processes and their effects in critically ill patients is controversial. The underlying mechanisms and links between inflammation, hypermetabolism, and IR are the current subject of several investigations.4,6,21,23,28
The analysis of this patient collective revealed that elevated RBP levels correspond with higher systemic glucose levels and increased exogenous insulin requirements during the acute hospital stay. In addition, patients with high RBP levels showed prolonged inflammatory responses of higher magnitude.
Hyperinflammation in burn patients is expected.32 However, the significantly elevated levels of proinflammatory cytokines and the significantly prolonged elevation of CRP and IL-8 in the high RBP group at a similar infection rate may be attributed to systemic circulating RBP. This result supports the hypothesis that RBP may serve as a marker for endogenous noninfective inflammation, which is also a characteristic of IR.
Previously published results of studies conducted in obese and diabetic patients showed that increased systemic levels of RBP correlated with a decreased expression of GLUT4 in adipocytes.2,3,33 It is thought that GLUT4 deficiency contributes to hyperglycemia via diminished glucose sensing seen in adipocytes.3 This finding was also reflected in our study population by a significantly older patient population with both higher body fat percentages and BMI.
RBP is an important carrier for vitamin A, which acts as an important antioxidant in several metabolic processes.34 Inflammation, a known oxidizing process, leads to increased needs of reducing agents, and therefore the requirements of vitamin A are increased.35,36 Measured elevated RBP levels can therefore also be attributed to the increased needs of retinol (vitamin A) due to inflammatory processes. Further investigation needs to be done to address this interesting aspect of the role of both vitamin A and RBP in acute and chronic inflammatory processes.
We were able to show that MCP-1 is significantly increased in individuals with high levels of RBP. MCP-1 stimulates macrophage infiltration into tissue and is involved in immunologic processes and lipolysis.37,38 RBP has likewise been shown to be involved in catabolic processes such as lipolysis and bone mineral content (BMC) breakdown.39,40
The patients with elevated RBP levels also showed increased triglyceride and osteocalcin levels. High plasma triglyceride levels can be either attributed to the effects of IR leading to a decreased uptake of triglycerides in peripheral tissue or, in this context, to an increased lipolysis caused by macrophage activity. Osteocalcin inhibits the calcification in extracellular bone matrix and leads to BMC loss.41 In addition, osteocalcin is suspected to have positive effects on the attenuation of IR.42,43 Newer studies have shown that osteocalcin stimulates insulin production in pancreatic β cells and increases the effects of insulin in peripheral tissue via stimulation of adiponectin.43,44 Increased levels of osteocalcin therefore may be reflective of insulinresistance.45
Metabolic changes are also reflected by organ-specific markers. Liver function in RBP high patients was impaired, shown by significantly elevated levels of serum bilirubin. Interestingly, the production of prealbumin, a sensitive marker for protein synthesis, was restored in the RBP high group.46 This result may be explained by the selective production of prealbumin as it is known that an RBPprealbumin transporter system exists.34 The transporter system may be triggered by elevated systemic RBP levels.
Significantly elevated markers for kidney function in the high RBP level group can be attributed to the resulting higher incidence of comorbidities and the worsened hospital course. However, it also can be hypothesized that impaired renal function contributes to elevated systemic RBP levels, as it has been shown that impaired renal function leads to a diminished excretion of RBP.47
The results of our study suggest that serum RBP levels correlate with stress-induced IR as well as hypermetabolic and inflammatory responses. More mechanistic research needs to be done to investigate a possible involvement in these processes and the underlying mechanisms. On the basis of our results, we propose that systemic RBP levels may serve as a clinical marker for stress-induced IR and inflammatory processes during the acute phase postburn. impaired renal function contributes to elevated systemic RBP levels, as it has been shown that impaired renal function leads to a diminished excretion of RBP.47 The results of our study suggest that serum RBP levels correlate with stress-induced IR as well as hypermetabolic and inflammatory responses. More mechanistic research needs to be done to investigate a possible involvement in these processes and the underlying mechanisms. On the basis of our results, we propose that systemic RBP levels may serve as a clinical marker for stress-induced IR and inflammatory processes during the acute phase postburn.
Acknowledgments
We thank all the individuals who participated in this clinical trial and Dr Katrina Leonard for the critical review of the manuscript. We also thank the research staff for their assistance.
Financial disclosure: This study was supported by the American Surgical Association Foundation; Shriners Hospitals for Children 8660, 8760, and 9145; NIH R01-GM56687, T32 GM008256, and P50 GM60338, R01 GM087285; and NIDRR H133A020102.
References
- 1.Tamori Y, Sakaue H, Kasuga M. RBP4, an unexpected adipokine. Nat Med. 2006;12(1):30–31. doi: 10.1038/nm0106-30. discussion 31. [DOI] [PubMed] [Google Scholar]
- 2.Graham TE, Yang Q, Bluher M, et al. Retinol-binding protein 4 and insulin resistance in lean, obese, and diabetic subjects. N Engl J Med. 2006;354(24):2552–2563. doi: 10.1056/NEJMoa054862. [DOI] [PubMed] [Google Scholar]
- 3.Yang Q, Graham TE, Mody N, et al. Serum retinol binding protein 4 contributes to insulin resistance in obesity and type 2 diabetes. Nature. 2005;436(7049):356–362. doi: 10.1038/nature03711. [DOI] [PubMed] [Google Scholar]
- 4.Palmieri TL. Intensive insulin therapy: are burns different? Crit Care Med. 2010;38(6):1496–1497. doi: 10.1097/CCM.0b013e3181e15b51. [DOI] [PubMed] [Google Scholar]
- 5.Fram RY, Cree MG, Wolfe RR, et al. Intensive insulin therapy improves insulin sensitivity and mitochondrial function in severely burned children. Crit Care Med. 2010;38(6):1475–1483. doi: 10.1097/CCM.0b013e3181de8b9e. [DOI] [PMC free article] [PubMed] [Google Scholar]
- 6.Gore DC, Chinkes DL, Hart DW, Wolf SE, Herndon DN, Sanford AP. Hyperglycemia exacerbates muscle protein catabolism in burninjured patients. Crit Care Med. 2002;30(11):2438–2442. doi: 10.1097/00003246-200211000-00006. [DOI] [PubMed] [Google Scholar]
- 7.Jeschke MG, Boehning DF, Finnerty CC, Herndon DN. Effect of insulin on the inflammatory and acute phase response after burn injury. Crit Care Med. 2007;35(9) suppl:S519–S523. doi: 10.1097/01.CCM.0000282027.10288.10. [DOI] [PubMed] [Google Scholar]
- 8.Cree MG, Zwetsloot JJ, Herndon DN, et al. Insulin sensitivity and mitochondrial function are improved in children with burn injury during a randomized controlled trial of fenofibrate. Ann Surg. 2007;245(2):214–221. doi: 10.1097/01.sla.0000250409.51289.ca. [DOI] [PMC free article] [PubMed] [Google Scholar]
- 9.Carter EA, Burks D, Fischman AJ, White M, Tompkins RG. Insulin resistance in thermally-injured rats is associated with post-receptor alterations in skeletal muscle, liver and adipose tissue. Int J Mol Med. 2004;14(4):653–658. [PubMed] [Google Scholar]
- 10.Krinsley JS. Effect of an intensive glucose management protocol on the mortality of critically ill adult patients. Mayo Clin Proc. 2004;79(8):992–1000. doi: 10.4065/79.8.992. [DOI] [PubMed] [Google Scholar]
- 11.Finfer S, Chittock DR, Su SY, et al. Intensive versus conventional glucose control in critically ill patients. N Engl J Med. 2009;360(13):1283–1297. doi: 10.1056/NEJMoa0810625. [DOI] [PubMed] [Google Scholar]
- 12.Griesdale DE, de Souza RJ, van Dam RM, et al. Intensive insulin therapy and mortality among critically ill patients: a meta-analysis including NICE-SUGAR study data. CMAJ. 2009;180(8):821–827. doi: 10.1503/cmaj.090206. [DOI] [PMC free article] [PubMed] [Google Scholar]
- 13.Van den Berghe G, Wilmer A, Hermans G, et al. Intensive insulin therapy in the medical ICU. N Engl J Med. 2006;354(5):449–461. doi: 10.1056/NEJMoa052521. [DOI] [PubMed] [Google Scholar]
- 14.Jeschke MG, Kulp GA, Kraft R, et al. Intensive insulin therapy in severely burned pediatric patients: a prospective randomized trial. Am J Respir Crit Care Med. 2010;182(3):351–359. doi: 10.1164/rccm.201002-0190OC. [DOI] [PMC free article] [PubMed] [Google Scholar]
- 15.Yao-Borengasser A, Varma V, Bodles AM, et al. Retinol binding protein 4 expression in humans: relationship to insulin resistance, inflammation, and response to pioglitazone. J Clin Endocrinol Metab. 2007;92(7):2590–2597. doi: 10.1210/jc.2006-0816. [DOI] [PMC free article] [PubMed] [Google Scholar]
- 16.Bobbert P, Weithauser A, Andres J, et al. Increased plasma retinol binding protein 4 levels in patients with inflammatory cardiomyopathy. Eur J Heart Fail. 2009;11(12):1163–1168. doi: 10.1093/eurjhf/hfp153. [DOI] [PubMed] [Google Scholar]
- 17.Vaisbuch E, Mazaki-Tovi S, Kusanovic JP, et al. Retinol binding protein 4: an adipokine associated with intra-amniotic infection/inflammation. J Matern Fetal Neonatal Med. 2010;23(2):111–119. doi: 10.3109/14767050902994739. [DOI] [PMC free article] [PubMed] [Google Scholar]
- 18.Li L, Messina JL. Acute insulin resistance following injury. Trends Endocrinol Metab. 2009;20(9):429–435. doi: 10.1016/j.tem.2009.06.004. [DOI] [PMC free article] [PubMed] [Google Scholar]
- 19.Thompson LH, Kim HT, Ma Y, Kokorina NA, Messina JL. Acute, muscle-type specific insulin resistance following injury. Mol Med. 2008;14(11–12):715–723. doi: 10.2119/2008-00081.Thompson. [DOI] [PMC free article] [PubMed] [Google Scholar]
- 20.Zhai L, Messina JL. Age and tissue specific differences in the development of acute insulin resistance following injury. J Endocrinol. 2009;203(3):365–374. doi: 10.1677/JOE-09-0269. [DOI] [PMC free article] [PubMed] [Google Scholar]
- 21.Ikezu T, Okamoto T, Yonezawa K, Tompkins RG, Martyn JA. Analysis of thermal injury-induced insulin resistance in rodents: implication of postreceptor mechanisms. J Biol Chem. 1997;272(40):25289–25295. doi: 10.1074/jbc.272.40.25289. [DOI] [PubMed] [Google Scholar]
- 22.Sugita H, Kaneki M, Sugita M, Yasukawa T, Yasuhara S, Martyn JA. Burn injury impairs insulin-stimulated Akt/PKB activation in skeletal muscle. Am J Physiol Endocrinol Metab. 2005;288(3):E585–E591. doi: 10.1152/ajpendo.00321.2004. [DOI] [PubMed] [Google Scholar]
- 23.Klein MB, Silver G, Gamelli RL, et al. Inflammation and the host response to injury: an overview of the multicenter study of the genomic and proteomic response to burn injury. J Burn Care Res. 2006;27(4):448–451. doi: 10.1097/01.BCR.0000227477.33877.E6. [DOI] [PubMed] [Google Scholar]
- 24.Hart DW, Wolf SE, Chinkes DL, et al. Determinants of skeletal muscle catabolism after severe burn. Ann Surg. 2000;232(4):455–465. doi: 10.1097/00000658-200010000-00001. [DOI] [PMC free article] [PubMed] [Google Scholar]
- 25.Greenhalgh DG, Saffle JR, Holmes JH, IV, et al. American Burn Association consensus conference to define sepsis and infection in burns. J Burn Care Res. 2007;28(6):776–790. doi: 10.1097/BCR.0b013e3181599bc9. [DOI] [PubMed] [Google Scholar]
- 26.Moore FA, Sauaia A, Moore EE, Haenel JB, Burch JM, Lezotte DC. Postinjury multiple organ failure: a bimodal phenomenon. J Trauma. 1996;40(4):501–510. doi: 10.1097/00005373-199604000-00001. discussion 510–512. [DOI] [PubMed] [Google Scholar]
- 27.Voelker R. Improved use of BMI needed to screen children for overweight. JAMA. 2007;297(24):2684–2685. doi: 10.1001/jama.297.24.2684. [DOI] [PubMed] [Google Scholar]
- 28.Muthu K, He LK, Szilagyi A, Stevenson J, Gamelli RL, Shankar R. Propranolol restores the tumor necrosis factor-alpha response of circulating inflammatory monocytes and granulocytes after burn injury and sepsis. J Burn Care Res. 2009;30(1):8–18. doi: 10.1097/BCR.0b013e3181921f22. [DOI] [PMC free article] [PubMed] [Google Scholar]
- 29.Williams FN, Jeschke MG, Chinkes DL, Suman OE, Branski LK, Herndon DN. Modulation of the hypermetabolic response to trauma: temperature, nutrition, and drugs. J Am Coll Surg. 2009;208(4):489–502. doi: 10.1016/j.jamcollsurg.2009.01.022. [DOI] [PMC free article] [PubMed] [Google Scholar]
- 30.Nelson KM, Turinsky J. Effect of insulin on glucose and amino acid uptake by skeletal muscle following burn injury: studies with 2-deoxyglucose and alpha-aminoisobutyric acid. JPEN J Parenter Enteral Nutr. 1982;6(1):3–8. doi: 10.1177/014860718200600103. [DOI] [PubMed] [Google Scholar]
- 31.Pereira CT, Murphy KD, Herndon DN. Altering metabolism. J Burn Care Rehabil. 2005;26(3):194–199. [PubMed] [Google Scholar]
- 32.Cairns BA, Barnes CM, Mlot S, Meyer AA, Maile R. Toll-like receptor 2 and 4 ligation results in complex altered cytokine profiles early and late after burn injury. J Trauma. 2008;64(4):1069–1077. doi: 10.1097/TA.0b013e318166b7d9. discussion 1077–1078. [DOI] [PubMed] [Google Scholar]
- 33.Abel ED, Peroni O, Kim JK, et al. Adipose-selective targeting of the GLUT4 gene impairs insulin action in muscle and liver. Nature. 2001;409(6821):729–733. doi: 10.1038/35055575. [DOI] [PubMed] [Google Scholar]
- 34.Monaco HL. Three-dimensional structure of the transthyretinretinol-binding protein complex. Clin Chem Lab Med. 2002;40(12):1229–1236. doi: 10.1515/CCLM.2002.213. [DOI] [PubMed] [Google Scholar]
- 35.Riccioni G, Barbara M, Bucciarelli T, di Ilio C, D’Orazio N. Antioxidant vitamin supplementation in asthma. Ann Clin Lab Sci. 2007;37(1):96–101. [PubMed] [Google Scholar]
- 36.Nguyen TT, Cox CS, Traber DL, et al. Free radical activity and loss of plasma antioxidants, vitamin E, sulfhydryl groups in patients with burns: the 1993 Moyer Award. J Burn Care Rehabil. 1993;14(6):602–609. doi: 10.1097/00004630-199311000-00004. [DOI] [PubMed] [Google Scholar]
- 37.Westerbacka J, Kolak M, Kiviluoto T, et al. Genes involved in fatty acid partitioning and binding, lipolysis, monocyte/macrophage recruitment, and inflammation are overexpressed in the human fatty liver of insulin-resistant subjects. Diabetes. 2007;56(11):2759–2765. doi: 10.2337/db07-0156. [DOI] [PubMed] [Google Scholar]
- 38.Kanda H, Tateya S, Tamori Y, et al. MCP-1 contributes to macrophage infiltration into adipose tissue, insulin resistance, and hepatic steatosis in obesity. J Clin Invest. 2006;116(6):1494–1505. doi: 10.1172/JCI26498. [DOI] [PMC free article] [PubMed] [Google Scholar]
- 39.Hogstrom M, Nordstrom A, Nordstrom P. Retinol, retinol-binding protein 4, abdominal fat mass, peak bone mineral density, and markers of bone metabolism in men: the Northern Osteoporosis and Obesity (NO2) Study. Eur J Endocrinol. 2008;158(5):765–770. doi: 10.1530/EJE-07-0796. [DOI] [PubMed] [Google Scholar]
- 40.Mercader J, Madsen L, Felipe F, Palou A, Kristiansen K, Bonet ML. All-trans retinoic acid increases oxidative metabolism in mature adipocytes. Cell Physiol Biochem. 2007;20(6):1061–1072. doi: 10.1159/000110717. [DOI] [PubMed] [Google Scholar]
- 41.Klein GL, Langman CB, Herndon DN. Vitamin D depletion following burn injury in children: a possible factor in post-burn osteopenia. J Trauma. 2002;52(2):346–350. doi: 10.1097/00005373-200202000-00022. [DOI] [PubMed] [Google Scholar]
- 42.Saleem U, Mosley TH, Jr, Kullo IJ. Serum osteocalcin is associated with measures of insulin resistance, adipokine levels, and the presence of metabolic syndrome. Arterioscler Thromb Vasc Biol. 2010;30(7):1474–1478. doi: 10.1161/ATVBAHA.110.204859. [DOI] [PMC free article] [PubMed] [Google Scholar]
- 43.Fernandez-Real JM, Izquierdo M, Ortega F, et al. The relationship of serum osteocalcin concentration to insulin secretion, sensitivity, and disposal with hypocaloric diet and resistance training. J Clin Endocrinol Metab. 2009;94(1):237–245. doi: 10.1210/jc.2008-0270. [DOI] [PubMed] [Google Scholar]
- 44.Bacchetta J, Boutroy S, Guebre-Egziabher F, et al. The relationship between adipokines, osteocalcin and bone quality in chronic kidney disease. Nephrol Dial Transplant. 2009;24(10):3120–3125. doi: 10.1093/ndt/gfp262. [DOI] [PubMed] [Google Scholar]
- 45.Shea MK, Gundberg CM, Meigs JB, et al. Gamma-carboxylation of osteocalcin and insulin resistance in older men and women. Am J Clin Nutr. 2009;90(5):1230–1235. doi: 10.3945/ajcn.2009.28151. [DOI] [PMC free article] [PubMed] [Google Scholar]
- 46.Biolo G, Toigo G, Ciocchi B, et al. Metabolic response to injury and sepsis: changes in protein metabolism. Nutrition. 1997;13(9) suppl:52S–57S. doi: 10.1016/s0899-9007(97)00206-2. [DOI] [PubMed] [Google Scholar]
- 47.Henze A, Frey SK, Raila J, et al. Evidence that kidney function but not type 2 diabetes determines retinol-binding protein 4 serum levels. Diabetes. 2008;57(12):3323–3326. doi: 10.2337/db08-0866. [DOI] [PMC free article] [PubMed] [Google Scholar]