Abstract
Short latency linear vestibular sensory evoked potentials (VsEPs) provide a means to objectively and directly assess the function of gravity receptors in mammals and birds. The importance of this functional measure is illustrated by its use in studies of the genetic basis of vestibular function and disease. Head motion is the stimulus for the VsEP. In the bird, it has been established that neurons mediating the linear VsEP respond collectively to the rate of change in linear acceleration during head movement (i.e. jerk) rather than peak acceleration. The kinematic element of motion responsible for triggering mammalian VsEPs has not been characterized in detail. Here we tested the hypothesis that jerk is the kinematic component of head motion responsible for VsEP characteristics. VsEP amplitudes and latencies changed systematically when peak acceleration level was held constant and jerk level was varied from ~0.9 to 4.6 g/ms. In contrast, responses remained relatively constant when kinematic jerk was held constant and peak acceleration was varied from ~0.9 to 5.5g in mice and ~0.44 to 2.75g in rats. Thus the mammalian VsEP depends on jerk levels and not peak acceleration. We conclude that kinematic jerk is the adequate stimulus for the mammalian VsEP. This sheds light on the behavior of neurons generating the response. The results also provide the basis for standardizing the reporting of stimulus levels, which is key to ensuring that response characteristics reported in the literature by many laboratories can be effectively compared and interpreted.
1.0 Introduction
The short latency linear vestibular evoked potential (VsEP) has become a valuable tool in evaluating vestibular function in mammals and birds [e.g., 1;2;3;4;5]. This is particularly true for studies in the mouse, an animal model that brings a notable advantage to the study of the molecular and genetic basis of vestibular function and disease.
The linear VsEP is an electrical response initiated within the labyrinth [1;6-11] by gravity receptors [1;12;13] and generated by macular primary afferents and central relays [14-16]. The VsEP is produced in response to transient linear acceleration of the head. What we glean from the results of VsEP testing depends in part on our understanding of how the response is elicited. For example, revealing the effective component of stimulus motion (i.e. the adequate stimulus) for the VsEP response provides insight regarding what kind of primary afferent discharge behavior is required and this in turn may suggest candidate neural types that mediate the response.
In the bird, the adequate stimulus for the VsEP has been shown to be the rate of change in acceleration (also known as kinematic jerk) rather than peak acceleration [17]. This was a key observation that permitted for the first time the precise prediction of normal response patterns under varying stimulus conditions. Although there have been some preliminary data reported for the rat [18-21], no detailed evaluation in the mouse has been reported regarding the answer to this important physiological question.
In the present study we tested the hypothesis that the adequate stimulus for the mammalian VsEP is linear kinematic jerk. To test this hypothesis we set out to show that linear VsEP responses are independent of peak acceleration when stimulus jerk levels are held constant and strictly dependent on jerk when stimulus peak acceleration is held constant. Because of their wide use and potential for scientific inquiry, we chose to complete these studies in the rat and mouse. We include two strains of mice: the widely used normal adult C57BL/6J and the Nox3het (+/-) heterozygote. We include Nox3het (+/-) because it is often used as a control for studies of otoconia-deficient mice (e.g., Nox3het (-/-)).
2.0 Methods
2.1 Animals
Five Sprague Dawley rats (males, 36-41 days-old) weighing between 120g and 160g were used. Ten normal adult C57BL/6J (abbreviated: C57; 6-7 months old, 3 males and 7 females weighing 25-45gm) and ten Nox3het (+/-) heterozygote mice were used (background C57BL/6JEi, 3 & 4 months-old, 5 male and 5 female weighing 20 and 30g). The phenotype of the heterozygote Nox3het (+/-) is normal in that these animals have normal otoconia, demonstrate robust VsEPs and are good swimmers [13;22].
2.2 Anesthesia
Rats were anesthetized using an intraperitoneal (ip) dose (0.10ml/100g,) of a Ketamine (18mg/ml)/ Xylazine (2mg/ml) mixture. Mice were anesthetized with 7μl/g of the Ketamine/ Xylazine. Anesthesia was maintained in both species using additional doses (0.05 ml) as needed.
2.3 Stimulus generation
The methods used for stimulation in the present study have been described in detail previously [e.g., 1;23;24;25]. Jerk stimuli were produced by applying voltage ramps (digital to analog conversion time 20 μs/point) to a commercial power amplifier. The power amplifier in turn drove the motion of an electromechanical shaker (Labworks, Inc. Model ET2-203). As described below, the duration of the voltage ramp was adjusted to produce different peak acceleration levels while keeping jerk levels constant. Stimuli were presented at a rate of 17/s. A calibrated accelerometer (100mv/g, g = 9.81 m s-2) was mounted on a solid right-angle aluminum plate that was bolted to the tip of the shaker piston. The accelerometer output was electronically differentiated to provide a calibrated jerk monitor voltage. Both kinematic acceleration and jerk were monitored throughout the studies. The animal’s head was affixed to this shaker platform using a head clip (mice) or screw (rats) as described below.
2.4 Stimulus coupling to the skull
In rats, the mechanical coupling to the skull was surgically prepared and was similar to that described elsewhere [1;13;23]. Two self-tapping stainless steel screws were placed on either side of the coronal and sagittal sutures and used to anchor the skull to the shaker coupling assembly. A stainless steel machine screw was inverted and embedded in fast setting plaster along with the two skull screws. The inverted screw was then bolted to the shaker platform.
A non-invasive head coupler was used for studies in mice [24;25]. The animal’s head was held snuggly in a spring-loaded clip, which in turn was coupled to the shaker platform. All animals were placed supine on a stationary heated base and the head was suspended beyond the edge of the base and attached to the shaker platform with nose oriented upward. Shaker motion was executed along the animal’s naso-occipital axis [1;25].
2.5 Iso-jerk and iso-acceleration stimuli
As noted above, we used acceleration ramps as stimuli. Given that kinematic jerk is the first time derivative of acceleration (in g), it follows that the slope of the acceleration ramp (slope = da/dt = jerk in g/ms) represents the corresponding jerk magnitude in g/ms. If one keeps the slope constant, then the peak acceleration is a function only of the duration of the acceleration ramp. We refer to the duration of the ramp as the stimulus rise time. Therefore, one can hold jerk level constant (iso-jerk conditions, figure 1) and systematically change the peak acceleration by increasing or decreasing the rise time. If responses are triggered by peak acceleration, then responses will change systematically with different rise times. Here we recorded VsEP responses under iso-jerk conditions using rise times of 0.5, 1, 2 and 4 ms (figure 1). On the other hand, if one holds peak acceleration constant (iso-acceleration conditions, figure 2) and systematically varies the rise time, then jerk levels must systematically change with different rise times in order to maintain a constant peak acceleration. Under these conditions, if responses are triggered by peak acceleration, then response amplitudes will be unaffected by differing rise times. If however they are triggered by jerk components of the motion, then response amplitudes will change systematically with rise time. Here we recorded VsEP responses under iso-acceleration conditions using rise times of 0.5, 1, 2 and 4 ms (figure 2). Stimulus levels were reported in absolute units (g or g/ms) or in dBre:1.0g, or dBre:1.0g/ms as is customary for our laboratory. The time required for acceleration level to fall to 37% of the peak value was approximately 2 to 3 ms.
Figure 1.
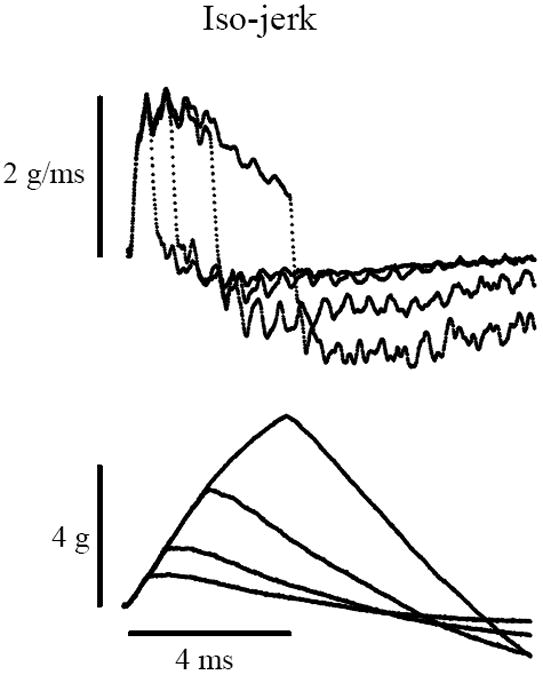
Iso-jerk stimulus protocol. Recordings of stimulus jerk (Top, in g/ms) and acceleration (Bottom, in g). Top: The duration (rise time) of the jerk stimulus (g/ms) is varied (0.5, 1, 2 & 4ms) while the peak amplitude is held constant. Bottom: Peak acceleration (g) increases systematically (~0.9, 1.7, 3.3 and 5.5g) with increasing jerk duration. Calibration bars indicate scales for acceleration, jerk and time.
Figure 2.
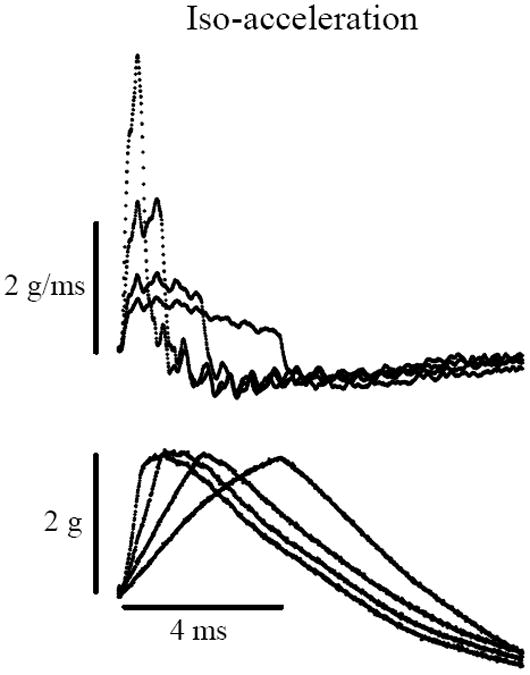
Iso-acceleration stimulus protocol. Recordings of stimulus jerk (Top, in g/ms) and acceleration (Bottom, in g). Top: Stimulus jerk levels systematically increase (~0.9 1.25, 2.3 & 4.6 g/ms) as the rise time to a constant peak acceleration (2g) decreases. Bottom: Peak acceleration level is held constant (2g) while the time lapsed during the rise to peak level (rise time) is varied (0.5, 1, 2 & 4ms). Achieving a constant peak acceleration level requires systematically higher jerk levels as shown in the Top tracings. Calibration bars indicate scales for acceleration, jerk and time.
2.6 Acoustic masking
Bilateral wide-band acoustic forward masking was used to challenge and confirm the absence of spurious acoustic response components. Masking noise was measured using a B&K 1/4” microphone and Nexus conditioning amplifier. The Nexus output was sampled (200 KHz) and RMS pressure (Pa) and dB SPL calculated. Spectral analysis was performed using an SRS785. Masking levels were approximately 92 dB SPL with an effective bandwidth between 50Hz and 50kHz as described previously [1]. The masker was gated off (0.5 ms off ramp, TDT SW2) at the onset of the vestibular stimulus and then gated on (0.5 ms rise time) at 15.0 ms following the stimulus.
2.7 VsEP Recording
Electroencephalographic recordings were made using subcutaneous electrodes placed at the nuchal crest (non-inverting), below and behind the pinna (inverting) and near the midline of ventral surface of the lower jaw (ground). Electrical activity was amplified (200,000X), filtered (0.3 to 3 KHz, -6dB points) and led to an analog–to-digital converter (conversion time 10 μs/point, 1024 points). Signal averaging was used to resolve responses from background activity. Each VsEP response trace was the average of 128 individual response waveforms produced by stimuli having normal polarity (i.e. having an initial upward movement) and 128 individual response waveforms produced by inverted stimuli (i.e. having an initial downward movement). Averaging across the two polarities served to reduce mechanical stimulus artifact. VsEP responses were replicated for each condition.
The VsEP typically demonstrates several positive and negative peaks. The earliest positive and negative response peaks (P1 & N1) correspond to the compound action potential of the vestibular nerve [14-16]. The peak-to-peak amplitude (P1-N1, in microvolts) and latencies of P1 and N1 (time elapsed between stimulus onset and peak occurrence in microseconds) were used to characterize response changes during iso-jerk and iso-acceleration protocols.
2.8 Statistics
General effects were evaluated using univariate, multivariate, two factor and repeated measures analysis of variance (rmANOVA). Linear regression was used to generate the regression slope, intercept, coefficient of determination (R2) and significance (p value) of relationships between response components and stimulus levels as specified in the results section (PASW 17 [SPSS]). Post hoc tests consisted of pair-wise comparisons. Values are reported as means +/- standard deviation unless otherwise stated. A p value less than 0.05 was considered significant.
3.0 Results
During iso-acceleration protocols (figure 2), jerk levels varied systematically (~0.86, 1.25, 2.3 & 4.6 g/ms) whereas peak acceleration levels remained constant (2.0g). Iso-acceleration studies completed in mice (C57 & Nox3het (+/-)) showed that jerk level had a significant effect on response amplitudes (figures 3 & 4, univariate rmANOVA: C57: p = 0.003; Nox3het (+/-) p < 0.001) and latencies (figure 3 & 5; multivariate rmANOVA: C57: p = 0.001; Nox3het (+/-) p < 0.001). P1-N1 amplitudes increased in direct proportion to jerk level in both strains of mice (figures 3 & 4; [linear regression: C57: p < 0.001, R2 was 0.445; Nox3het (+/-): p< 0.001, R2 = 0.609]). Latencies for P1 and N1 decreased progressively with increasing jerk levels in both strains (figures 3 & 5; [linear regression: C57: P1: p < 0.001, R2 = 0.808 ; N1: p < 0.001, R2 = 0.672; Nox3het (+/-):P1: p < 0.001, R2 = 0.694 ; N1: p < 0.001, R2 = 0.702]). Table 1 summarizes numerical results for amplitudes and latencies and Table 2 summarizes the results of linear regression for the two mouse strains. There was no effect of mouse strain on the response features for iso-acceleration studies (C57 vs Nox3het (+/-), two factor rmMANOVA, p > 0.36). These amplitude and latency relationships to jerk level reported here in iso-acceleration studies are similar to those reported by numerous studies in mammals where jerk levels have been varied systematically [e.g., 1;23]. However in those cases reported elsewhere, acceleration levels were not held constant and the independence of the response from acceleration could not be discerned. Here response measures are clearly shown to be independent of peak acceleration level.
Figure 3.
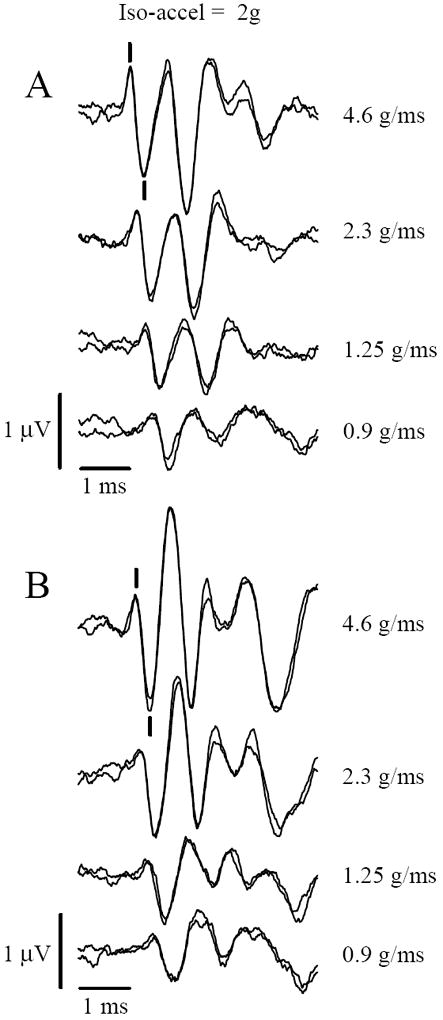
VsEP responses recorded during iso-acceleration (2g) protocol. Responses increase in amplitude and decrease in latency during increasing jerk levels despite constant peak acceleration level (2g). Jerk levels are indicated to the right (g/ms). Top (A) is a C57 mouse. Bottom (B) is a Nox3het (+/-) mouse. Calibration bars indicate scales for amplitude and latencies. Latencies represent time elapsed after the onset of the stimulus. The scoring of P1 and N1 is indicated with marks for the top most group (5g), positive up.
Figure 4.
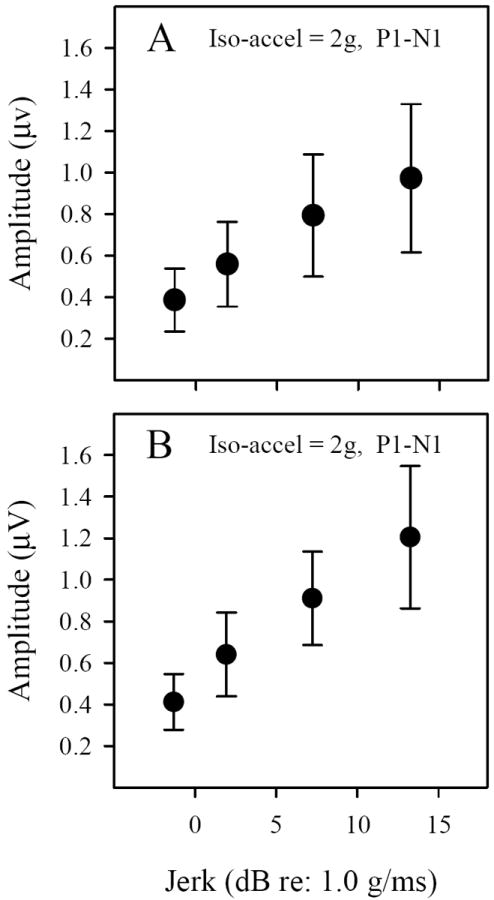
VsEP amplitudes during iso-acceleration studies (2g) in C57 (A) and Nox3het (+-/-) (B) mice. P1-N1 amplitudes increased systematically with increasing jerk level (~0.9, 1.25, 2.3 & 4.6 g/ms). The regression slope for C57 was 0.04 μV/dBre:1g/ms (R2 = 0.445, p < 0.001) and for Nox3het (+/-), 0.53 μV/dBre:1g/ms (R2 = 0.515, p < 0.001).
Figure 5.
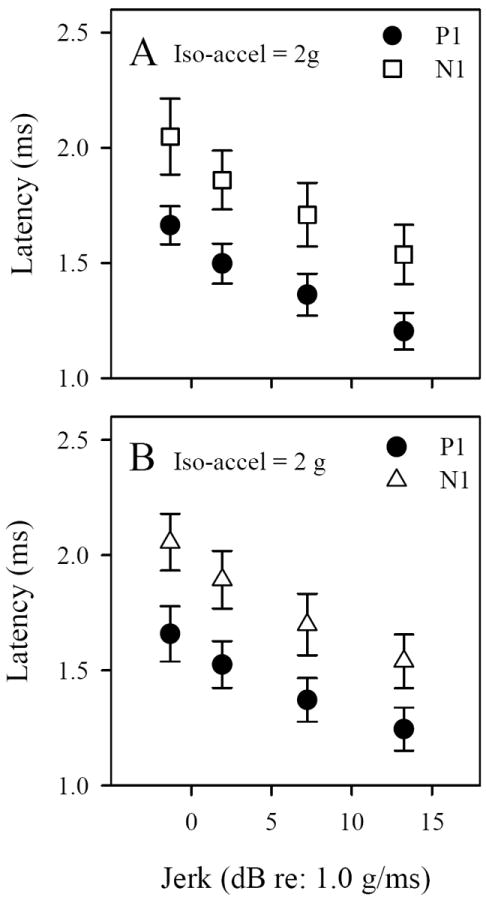
VsEP latencies during iso-acceleration studies in C57 (A) and Nox3het (+/-) (B) mice. Latencies of P1 and N1 decreased systematically with increasing jerk level (~0.9, 1.25, 2.3 & 4.6 g/ms). The regression slope for C57 was P1 = -30.52 μs/dBre:1g/ms, N1 = -34.08 μs/dBre:1g/ms (p < 0.001, R2 => 0.672) and for Nox3het (+/-) was P1 = 26.36 μs/dBre:1g/ms and N1 = -34.26 μs/dBre:1g/ms μs/dBre:1g/ms (p < 0.001, R2 => 0.694).
Table 1.
VsEP Latencies and Amplitudes versus Jerk and Acceleration, C57 & Nox3 mice.
| Latency | P1 (mean +/- sd, μs) | n | ||||
|---|---|---|---|---|---|---|
| Duration | 0.5 ms | 1.0 ms | 2.0 ms | 4 ms | ||
| Jerk | 4.6 g/ms | 2.32 g/ms | 1.25 g/ms | 0.86 g/ms | ||
| ia | C57 | 1204.44 +/- 79.90 | 1362.77 +/- 91.48 | 1497.77 +/- 86.60 | 1664.44 +/- 82.74 | 9 |
| Nox3 | 1244.99 +/- 92.82 | 1371.50 +/- 94.40 | 1525.5 +/- 100.70 | 1658.5 +/- 120.07 | 10 | |
| Accel | 0.88 g | 1.68 g | 3.28 g | 5.5 g | ||
| ij | ***C57 | 1366.5 +/- 84.36 | 1399.5 +/- 97.50 | 1416.00 +/-78.02 | 1430.5 +/- 69.25 | 10 |
| ***Nox3 | 1398.5 +/- 68.07 | 1409.5 +/- 73.23 | 1444.5 +/- 79.03 | 1454 +/- 68.79 | 10 | |
| Latency | N1 (mean +/- sd, μs) | n | ||||
| Duration | 0.5 ms | 1.0 ms | 2.0 ms | 4 ms | ||
| Jerk | 4.6 g/ms | 2.32 g/ms | 1.25 g/ms | 0.86 g/ms | ||
| ia | C57 | 1536.66 +/- 128.98 | 1709.44 +/- 138.05 | 1860 +/- 128.20 | 2048.33 +/- 165.05 | 9 |
| Nox3 | 1539.5+/-116.31 | 1698.5 +/- 133.23 | 1893 +/- 125.148 | 2056.5 +/- 123.19 | 10 | |
| Accel | 0.88 g | 1.68 g | 3.28 g | 5.5 g | ||
| ij | C57 | 1795.5 +/- 190.92 | 1785 +/- 173.63 | 1808 +/- 144.84 | 1805.5+/- 118.68 | 10 |
| ***Nox3 | 1717.5 +/- 83.20 | 1737.5 +/- 87.18 | 1766.5 +/- 78.38 | 1788 +/- 92.11 | 10 | |
| Amplitude | P1N1 (mean +/- sd, μV) | n | ||||
| Duration | 0.5 ms | 1.0 ms | 2.0 ms | 4 ms | ||
| Jerk | 4.6 g/ms | 2.32 g/ms | 1.25 g/ms | 0.86 g/ms | ||
| ia | C57 | 0.9726 +/- 0.3563 | 0.7936 +/- 0.2940 | 0.5588 +/- 0.2038 | 0.3865 +/- 0.1507 | 9 |
| Nox3 | 1.2052 +/- 0.3421 | 0.9110 +/- 0.2246 | 0.6398 +/- 0.2019 | 0.4119 +/- 0.1336 | 10 | |
| Accel | 0.88 g | 1.68 g | 3.28 g | 5.5 g | ||
| ij | C57 | **0.6145 +/- 0.2167 | 0.7419 +/- 0.2267 | 0.7961 +/- 0.2425 | 0.7695 +/- 0.2991 | 10 |
| Nox3 | **0.6971 +/- 0.1860 | 0.8307 +/- 0.2440 | 0.8457 +/- 0.1988 | *0.9678 +/- 0.2715 | 10 | |
p = 0.003,
p <0.024,
differences among means p < 0.05
Table 2.
Linear regression of latencies and amplitudes versus jerk (dB re:1.0 g/ms) and acceleration (dBre:1.0 g). C57 and Nox3 mice. R2 is the coefficient of determination.
| Latency | P1 (μs) | ||||
|---|---|---|---|---|---|
| Jerk | slope (μs/dB) | Intercept | R2 | p | |
| ia | C57 | -30.52 | 1590.808 | 0.808 | < 0.001 |
| Nox3 | -26.36 | 1582.42 | 0.694 | < 0.001 | |
| Accel | slope (μs/dB) | Intercept | R2 | p | |
| ij | C57 | 3.91 | 1375.25 | 0.081 | 0.074 |
| Nox3 | 3.78 | 1399.67 | 0.098 | 0.050 | |
| Latency | N1 (μs) | ||||
| Jerk | slope (μs/dB) | Intercept | R2 | p | |
| ia | C57 | -34.08 | 1963.17 | 0.672 | < 0.001 |
| Nox3 | -34.26 | 1974.94 | 0.702 | < 0.001 | |
| Accel | slope (μs/dB) | Intercept | R2 | p | |
| ij | C57 | 1.00 | 1791.43 | 0.002 | = 0.808 |
| Nox3 | 4.482 | 1720.41 | 0.099 | = 0.048 | |
| Amplitude | P1N1 (μV) | ||||
| Jerk | slope (μV/dB) | Intercept | R2 | p | |
| ia | C57 | 0.040 | 0.468 | 0.445 | < 0.001 |
| Nox3 | 0.053 | 0.515 | 0.609 | < 0.001 | |
| Accel | slope (μV/dB) | Intercept | R2 | p | |
| ij | C57 | 0.010 | 0.659 | 0.059 | = 0.130 |
| Nox3 | 0.015 | 0.726 | 0.151 | = 0.013 | |
In contrast to iso-acceleration studies, VsEP response amplitudes and latencies changed very little during iso-jerk protocols for both mice and rats (mice figure 6, rats figure 7). In the iso-jerk protocol (figure 1), responses were recorded during stimulation at four different peak acceleration levels (approximately 0.9, 1.7, 3.3 and 5.5g for mice, 0.44, 0.84, 1.64 and 2.75g for rats), whereas jerk stimulus levels were kept constant (2g/ms for mice or 1g/ms for rats). In rats, there were no significant changes in P1-N1 amplitude across peak acceleration levels (rmANOVA: p > 0.82). However, there were small latency differences found for N1 but not P1 at the highest peak acceleration level (e.g. see Table 3 for rat data, multivariate rmMANOVA: p = 0.026). Figure 8 illustrates and Table 1 summarizes response amplitude data for the two strains of mice tested during the iso-jerk protocol. Mean amplitudes varied somewhat across peak acceleration levels and ranged between 0.6 and 0.8 μV for C57 mice (figure 8A) and 0.8 and 1.0 μV for Nox3het (+/-) mice [figure 8B]. The response profile of the two strains of mice, although similar, was not identical in iso-jerk studies (two factor rmMANOVA, p = 0.045). There was a small but significant difference (< 0.2μV) in P1-N1 amplitude in response to the shortest duration stimulus (i.e. lowest peak acceleration level) in both C57 (0.9g level; rmMANOVA: p = 0.023) and Nox3het (+/-) (p = 0.008) animals (Table 1, figure 8). However, only the Nox3het (+/-) group showed increased amplitudes at the highest acceleration level (i.e. longest duration stimulus, rmANOVA p = 0.003). Minor differences among the mean latencies were also present for both mouse strains (C57: p = 0.041, maximum difference: 64μs and Nox3het (+/-): p = 0.035, maximum difference: 70.5 μs, see figure 9A & B and Table 1).
Figure 6.
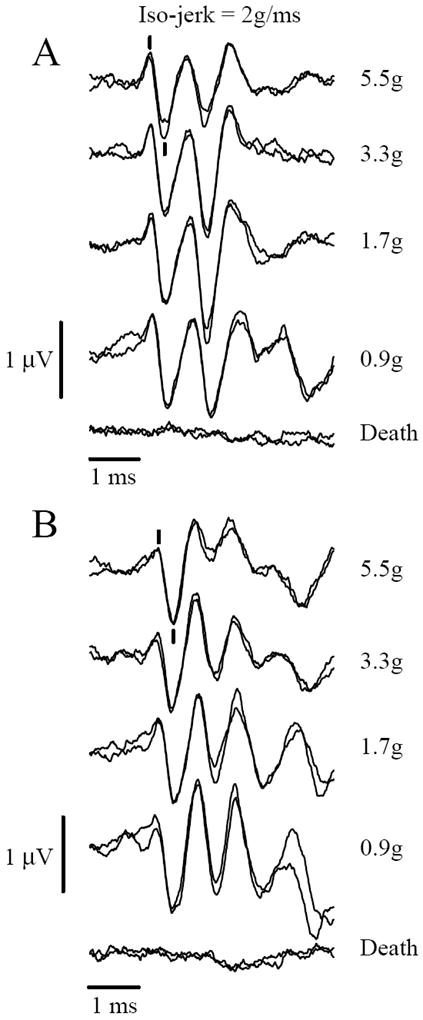
VsEPs recorded during an iso-jerk protocol in representative C57 (A) and Nox3het (+/-) (B) mice. Responses remain relatively constant despite widely different peak acceleration levels (shown to right). Jerk level is held constant at 2g/ms. Calibration bars indicate scales for amplitude and latencies. Latencies represent time elapsed after the onset of the stimulus. The scoring of P1 and N1peaks are indicated with marks for the top most group (5.5g), positive up. The bottom two traces were taken after death and evidence no responses.
Figure 7.
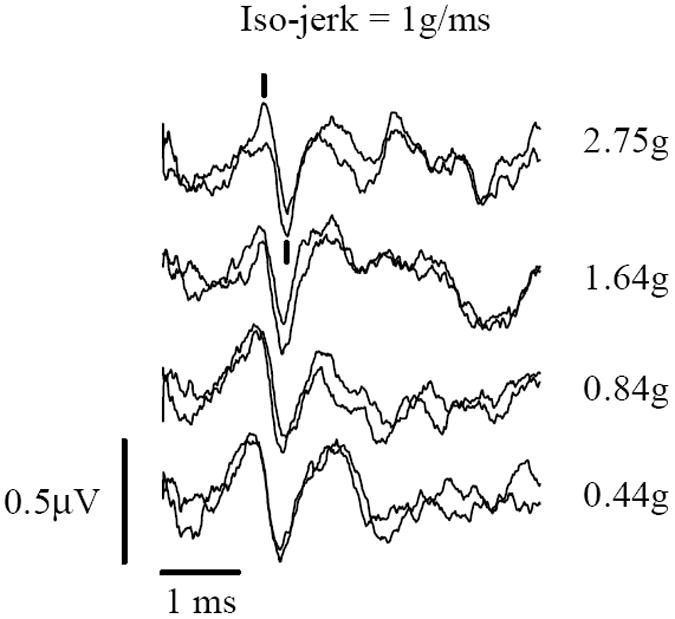
VsEPs recorded during an iso-jerk protocol in a rat. Responses remain virtually unchanged despite changing peak acceleration levels (shown to right). Jerk level is held constant at 2g/ms. Calibration bars indicate scales for amplitude and latencies. Responses were recorded during acoustic masking (92 dB SPL). P1 and N1 are marked for the topmost group (2.75g), positive up.
Table 3.
A: Latencies and Amplitudes at four peak accelerations: 0.44, 0.84, 1.64, 2.75g. Iso-jerk protocol (ij) in rats.
| Latency, 0dB | P1 (mean +/- sd (n), μs) | ||||
|---|---|---|---|---|---|
| Accel | 0.44 g | 0.84 g | 1.64 g | 2.75 g | |
| ij | Rat | 1270.62+/-24.52 (4) | 1297.00 +/- 37.34 (5) | 1275.00 +/- 39.68 (3) | 1366.00 +/- 67.58 (5) |
| Latency, 0dB | N1 (mean +/- sd (n), μs) | ||||
| ij | Rat | 1592.50 +/- 65.89 (4) | 1612.00 +/- 65.44 (5) | 1615.00 +/- 91.24 (3) | *1719.00 +/-86.63 (5) |
| Amplitude, 0dB | P1N1 (mean +/- sd (n), μV) | ||||
| ij | Rat | 0.2623 +/- 0.02300 (4) | 0.2816 +/- 0.0468 (5) | 0.2792 +/- 0.0481 (3) | 0.2345 +/- 0.09225 (5) |
| B: Regressions: Iso-jerk protocol in rats: Latency and amplitude vs peak acceleration in dBre:1.0g. R2 is the coefficient of determination. | |||||
| Latency, 0dB | P1 (μs) | ||||
| slope (μs/dB) | Intercept (μs) | R2 | p | ||
| ij | Rat | 5.326 | 1301.90 | 0.296 | = 0.024 |
| N1 (μs) | |||||
| ij | Rat | 7.688 | 1631.753 | 0.277 | = 0.030 |
| Amplitude | P1N1 (μV) | ||||
| slope (μV/dB) | Intercept | R2 | p | ||
| ij | Rat | -0.002 | 0.265 | 0.035 | = 0.474 |
p = 0.026
Figure 8.
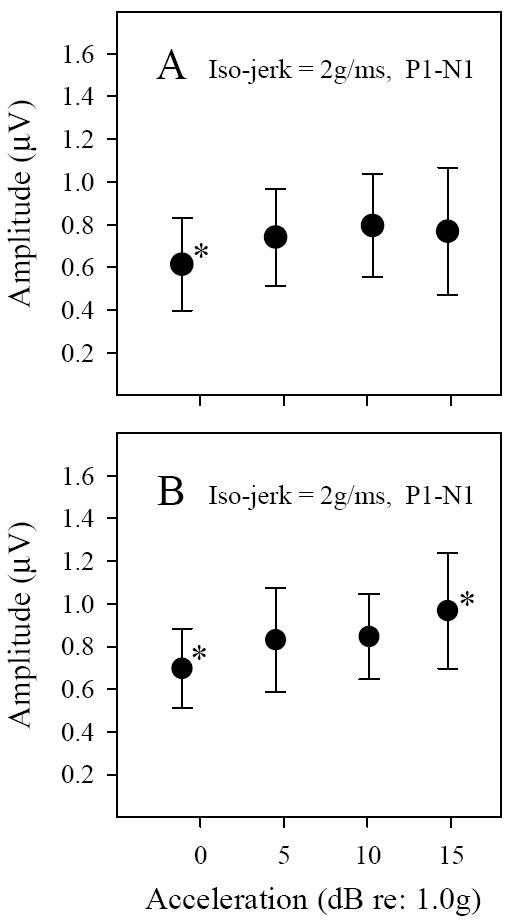
VsEP amplitudes during iso-jerk studies in C57 (A) and Nox3het (+/-) (B) mice. relatively small changes in P1-N1 amplitudes (μV) occurred with increasing peak acceleration levels (-0.92, 4.6, 10.4 and 13.9 dBre:1.0g) for some peaks. * symbol represents peak amplitudes that were significantly different from other peaks (see Tables 1 & 2). The regression of amplitude versus acceleration level was not significant for C57 animals (A). However, the shallow slope of P1-N1 for Nox3het (+/-) (B) mice was significant: slope 0.015 μV/dBre:1g (R2 = 0.151, p = 0.013).
Figure 9.
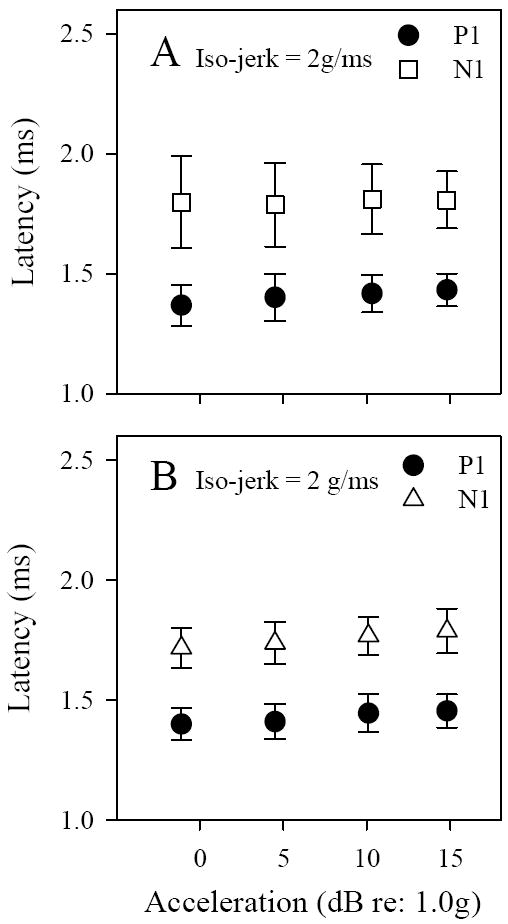
VsEP latencies during iso-jerk protocols in C57 (A) and Nox3het (+/-) (B) mice. Regression slopes of latency versus acceleration level were not significant for C57 (see Table 2). Only slight progressive change in N1 latencies (μs) occurred with increasing peak acceleration levels for Nox3het (+/-) (-0.92, 4.6, 10.4 and 13.9 dBre:1.0g). Regression slopes for P1were not significant whereas N1 = 4.482 μs/dBre:1g (p = 0.048, R2 <0.099).
Linear regression was used to evaluate the size of these effects and examine whether systematic progressive relationships existed between response amplitudes, latencies and peak acceleration during iso-jerk studies. Latency and amplitude regression slopes were significant only for Nox3het (+/-) mice and only for N1 latencies in rats (figures 6 & 9, Tables 2 and 3) suggesting a potential systematic association with different acceleration levels in these cases. P1-N1 amplitudes evidenced a modest relationship to peak acceleration in Nox3het (+/-) mice having a slope of 0.015μV/dB (linear regression: slope 0.015μV/dB, R2 = 0.151, p = 0.013, see Table 2) and the regression slope for N1 in these animals was shallow (~4.5 μs/dB) but significant (linear regression: N1: p =0.048, R2 = 0.099; P1-N1: p = 0.013, R2 = 0.151, see Table 2). For C57 mice no relationship existed between response components and peak acceleration based on regression analysis (Table 2 iso-jerk results).
4.0 Discussion
The present findings demonstrate that VsEP response amplitudes and latencies in mice and rats are dependent on stimulus jerk levels and can be shown under particular conditions to be virtually independent of peak acceleration levels. The observations provide explicit evidence that in mammals, as in birds [17], jerk magnitude governs the character of the linear VsEP response. VsEP amplitudes increase and latencies decrease in direct proportion to linear jerk and this effect is independent of peak acceleration level. VsEP thresholds are also determined by jerk magnitude rather than peak acceleration as shown previously [17]. For these reasons, it is appropriate to regard linear jerk as the adequate stimulus for the VsEP in the mammal. This finding underscores the importance of characterizing stimulus levels in terms of jerk in mammals rather than peak acceleration as has been the case in some instances [e.g., 10].
The finding of a few small but significant changes in amplitudes and latencies during iso-jerk studies in both mice and rats raises the question of whether peak acceleration level or some other aspect of the stimulus may in some cases also contribute to the character of the VsEP. Differences in amplitude were absent in the rat and found only with the shortest (0.5ms) and the longest (4ms) stimuli in mice. The regression slopes for latencies for Nox3het (+/-) mice (N1, Table 2) and rats (P1, N1 Table 3) in all cases were very shallow (less than 8 μs/dB). Peak acceleration cannot provide an explanation for the differences associated with the 2ms and 4ms iso-jerk stimuli since peak acceleration for these cases occurred well after the response onset. The alternative is that some other aspect of iso-jerk stimuli may lead to small amplitude and latency differences. Stimulus duration for example may play some role.
The most consistent amplitude difference found in iso-jerk protocols was a slight reduction in response amplitude for the shortest stimulus in mice (i.e., stimulus durations of 0.5ms). This may reflect a slightly higher threshold for this stimulus as reported for the bird [17]. The basis for slightly elevated thresholds for 0.5ms duration stimuli in the bird has not been evaluated. One possibility is that stimulus transfer to the otoconial sensory apparatus is reduced for short stimuli (duration less than 1 ms). One expects such transfer to depend on the time constant for the mechanical transfer of the stimulus to the inner ear, a time value that to our knowledge has not been measured in birds or mice. If the time constant is on the order of 0.5 ms, then a 0.5ms duration stimulus would be too brief to effectively deliver full peak levels to the otoconial apparatus. This would explain both elevated thresholds and reduced amplitudes and is an idea that we intend to explore in more detail.
Slightly elevated P1-N1 amplitudes for the longest stimulus (4ms) in iso-jerk studies was found only in Nox3het (+/-) mice (figure 8B, Table 1). This was a small unexpected effect. Although there were no differences between mouse strains for iso-acceleration studies, this finding in iso-jerk studies raises the question of whether there may be some subtle difference in the Nox3het (+/-) mice compared to the C57. We have argued above that this effect cannot be due to a sensitivity to increasing peak acceleration. Thus the Nox3het (+/-) mice present an interesting puzzle that warrants additional study.
In summary, the current findings indicate that small deviations in amplitudes and latencies may occur during iso-jerk studies. We argue that these effects are independent of peak acceleration and that they may be related instead to stimulus transfer characteristics and duration.
Acceleration and jerk are distinct kinematic components of motion. We all appreciate that kinematic acceleration is proportional to the level of force associated with motion (e.g. a = F/m, where, a, is acceleration, F, is force and, m, is mass). It follows that jerk is proportional to the rate of change in force (i.e. j = da/dt = 1/m * dF/dt). Thus, a collective neural response governed by jerk components of motion (e.g., the VsEP) is keying on how rapidly a force is developing (e.g., increasing) over time. Neural activity related to this stimulus component could provide dynamic sensory information that can be used to anticipate the ultimate force levels achieved and thus aid the formulation of appropriate motor control adjustments that must be made by the central nervous system to maintain equilibrium.
Transduction of vestibular stimuli occurs in vestibular sensory hair cells. Hair cells respond to shearing displacements of the stereociliary bundle. Displacement of the otoconial membrane (OM) causes shearing displacement of the stereociliary bundle and this occurs in response to linear acceleration or tilting of the head. Thus, OM displacement (xom) is proportional to the force applied and the force is proportional to the acceleration of the head [xom ∝ F ∝ ma] [26]. It follows therefore that the velocity of OM displacement (Vom) corresponds to the cranial jerk component of stimuli [Vom ∝ d xom/dt ∝ dF/dt ∝ mda/dt ∝ j]. Neurons sensitive to the velocity of OM shearing therefore would be expected to respond to jerk. Macular primary afferents that respond strictly to cranial jerk have been described in vertebrates [e.g., 27] but not explicitly in warm blooded vertebrates i.e., mammals and birds. However, there are candidate neurons in birds and mammals that, under the appropriate dynamic conditions, are responsive to changes in acceleration and OM shearing velocity [e.g., 28;29;30;31;32;33;34;35] [36]. Neurons evidencing such sensitivity have been referred to as “phasic” or “phasic-tonic” neurons in the literature. These are thought to be the irregularly discharging calyx-bearing vestibular primary afferents. These include both calyx-only and dimorphic classes of primary afferents [37]. In general many of these neurons develop a phase lead relative to acceleration and increase their gain with increasing stimulus frequency. These properties indicate that the neurons are sensitive to both acceleration and the rate of change in acceleration [displacement and velocity of OM shear]. A key requirement for recording the collective neural response in the far-field is that the source ensemble of neurons generate a synchronous onset discharge. Based on the transfer function of phasic and phasic-tonic afferent neurons, Lewis & Parnas, [38] estimated that a population of such neurons would have a striking capacity to collectively synchronize at discharge onset. We have thus proposed that it is the sensitivity to jerk in such neurons that forms the basis for the generation of the VsEP [17].
There is increasing interest in the use of VsEPs for assessing macular function following genetic manipulation in rodents. The potential to gain valuable information about the molecular basis of vestibular function and disease is considerable. The present findings are important to the success of such investigations since they provide the justification for standardizing methods of stimulation during VsEP recordings. Monitoring and specifying stimulus levels in units of jerk or in dB relative to some reference jerk level (e.g., 0dBre:1.0g/ms) is key to ensuring that response characteristics reported in the literature by many laboratories can be effectively compared and interpreted [1].
Research Highlights.
The macular VsEP is triggered and controlled by kinematic jerk levels in mammals.
VsEP amplitudes and latencies are virtually independent of peak acceleration.
Candidate neural generators are irregularly-firing macular primary afferents.
Findings provide the basis for standardizing stimulus levels across laboratories.
Acknowledgments
This work was supported by NASA Life Sciences Research: NAG5-4607 (taj, smj); NASA RPG: Human Health From Earth to Space (taj), NIH R01-DC006443 (smj); NIH R01 DC04477 (smj, taj), The French Space Agency and the French Ministry of Research and New Technologies (ab, cc).
Abbreviations
- C57
C57BL/6J mouse strain
- dB SPL
decibel sound pressure level re: 20 micropascals RMS
- iso-accel
iso-acceleration
- Nox3
Nox3het (+/-) heterozygote mouse strain
- R2
coefficient of determination
- rmANOVA
repeated measures analysis of variance
- RMS
root mean square
- VsEP
vestibular sensory evoked potential
Footnotes
Publisher's Disclaimer: This is a PDF file of an unedited manuscript that has been accepted for publication. As a service to our customers we are providing this early version of the manuscript. The manuscript will undergo copyediting, typesetting, and review of the resulting proof before it is published in its final citable form. Please note that during the production process errors may be discovered which could affect the content, and all legal disclaimers that apply to the journal pertain.
Contributor Information
Timothy A. Jones, Email: jonesti@ecu.edu.
Sherri M. Jones, Email: jonessh@ecu.edu.
Sarath Vijayakumar, Email: vijayakumars@ecu.edu.
Aurore Brugeaud, Email: aurore.brugeaud@sensorion-pharma.com.
Marcella Bothwell, Email: mbothwell@rchsd.org.
Christian Chabbert, Email: christian.chabbert@inserm.fr.
References
- 1.Jones TA, Jones SM. Short latency compound action potentials from mammalian gravity receptor organs. Hear Res. 1999;136:75–85. doi: 10.1016/s0378-5955(99)00110-0. [DOI] [PubMed] [Google Scholar]
- 2.Jones SM, Johnson KR, Yu H, Erway LC, Alagramam KN, Pollak N, Jones TA. A quantitative survey of gravity receptor function in mutant mouse strains. J Assoc Res Otolaryngol. 2005;6:297–310. doi: 10.1007/s10162-005-0009-4. [DOI] [PMC free article] [PubMed] [Google Scholar]
- 3.Alagramam KN, Stahl JS, Jones SM, Pawlowski KS, Wright CG. Characterization of vestibular dysfunction in the mouse model for Usher Syndrome 1F. J Assoc Res Otolaryngol. 2005;6:106–118. doi: 10.1007/s10162-004-5032-3. [DOI] [PMC free article] [PubMed] [Google Scholar]
- 4.Jones SM, Jones TA, Johnson KR, Yu H, Erway LC, Zheng QY. A comparison of vestibular and auditory phenotypes in inbred mouse strains. Brain Res. 2006;1091:40–46. doi: 10.1016/j.brainres.2006.01.066. [DOI] [PMC free article] [PubMed] [Google Scholar]
- 5.Jones SM, Ryals BM, Colbert S. Vestibular function in Belgian Waterslager canaries (Serinus canarius) Hear Res. 1998;121:161–169. doi: 10.1016/s0378-5955(98)00074-4. [DOI] [PubMed] [Google Scholar]
- 6.Jones TA, Pedersen TL. Short latency vestibular responses to pulsed linear acceleration. Am J Otolaryngol. 1989;10:327–335. doi: 10.1016/0196-0709(89)90108-7. [DOI] [PubMed] [Google Scholar]
- 7.Jones TA. Vestibular short latency responses to pulsed linear acceleration in unanesthetized animals. Electroenceph clin Neurophysiol. 1992;82:377–386. doi: 10.1016/0013-4694(92)90007-5. [DOI] [PubMed] [Google Scholar]
- 8.Jones SM, Jones TA, Shukla R. Short latency vestibular evoked potentials in the japanese quail (Coturnix coturnix japonica) J Comp Physiol A. 1997;180:631–638. doi: 10.1007/s003590050079. [DOI] [PubMed] [Google Scholar]
- 9.Weisleder P, Jones TA, Rubel EW. Peripheral generators of the vestibular evoked potentials [VsEP] in the chick. Electroenceph clin Neurophysiol. 1990;76:362–369. doi: 10.1016/0013-4694(90)90037-k. [DOI] [PubMed] [Google Scholar]
- 10.Plotnik M, Elidan J, Mager M, Sohmer H. Short latency vestibular evoked potentials (VsEPs) to linear acceleration impulses in rats. Electroenceph clin Neurophysiol. 1997;104:522–530. doi: 10.1016/s0168-5597(97)00062-2. [DOI] [PubMed] [Google Scholar]
- 11.Bohmer A, Hoffman LF, Honrubia V. Characterization of vestibular potentials evoked by linear acceleration pulses in the chinchilla. Am J Otol. 1995;16:498–504. [PubMed] [Google Scholar]
- 12.Jones SM, Erway LC, Yu H, Johnson KR, Jones TA. Gravity receptor function in mice with graded otoconial deficiencies. Hear Res. 2004;191:34–40. doi: 10.1016/j.heares.2004.01.008. [DOI] [PubMed] [Google Scholar]
- 13.Jones SM, Erway LC, Bergstrom RA, Schimenti JC, Jones TA. Vestibular responses to linear acceleration are absent in otoconia-deficient C57BL/6JEi-het mice. Hear Res. 1999;135:56–60. doi: 10.1016/s0378-5955(99)00090-8. [DOI] [PubMed] [Google Scholar]
- 14.Nazareth AM. Thesis. University of Nebraska Medical Center; 1991. Central and peripheral components of short latency vestibular responses. [PubMed] [Google Scholar]
- 15.Nazareth AM, Jones TA. Vestibular nerve components of responses to pulsed linear acceleration. ASGSB Bull. 1991;5:40. [Google Scholar]
- 16.Nazareth AM, Jones TA. Central and peripheral components of short latency vestibular responses in the chicken. J Vestib Res. 1998;8:233–252. [PubMed] [Google Scholar]
- 17.Jones TA, Jones SM, Colbert S. The adequate stimulus for avian short latency vestibular responses to linear translation. J Vestib Res. 1998;8:253–272. [PubMed] [Google Scholar]
- 18.Lange ME. Thesis. University of Nebraska; 1988. Mammalian far-field responses to pulsed linear acceleration. [Google Scholar]
- 19.Lange ME, Jones TA. Mammalian short latency electrophysiological responses to pulsed linear acceleration. ASGSB Bulletin. 1989;3(1):31. [Google Scholar]
- 20.Lange ME, Jones TA. Short latency electrophysiological responses to pulsed linear acceleration in the mammal. Association for Research in Otolaryngology. 1990;343 [Google Scholar]
- 21.Bothwell M, Jones TA. Mammalian vestibular evoked potentials: The influence of peak acceleration under iso-jerk conditions. American Academy of Otolaryngology Head and Neck Surgery. 1997 [Google Scholar]
- 22.Jones TA, Jones SM, Hoffman LF. Resting discharge patterns of macular primary afferents in otoconia-deficient mice. J Assoc Res Otolaryngol. 2008;9:490–505. doi: 10.1007/s10162-008-0132-0. [DOI] [PMC free article] [PubMed] [Google Scholar]
- 23.Jones SM, Subramanian G, Avniel W, Guo Y, Burkard RF, Jones TA. Stimulus and recording variables and their effects on mammalian vestibular evoked potentials. J Neurosci Meth. 2002;118:23–31. doi: 10.1016/s0165-0270(02)00125-5. [DOI] [PubMed] [Google Scholar]
- 24.Jones TA, Jones SM. Vestibular Evoked Potentials. In: Burkard RF, Eggermont JJ, Don M, editors. Auditory evoked potentials: basic principles and clinical application. Lippincott Williams & Wilkins; Baltimore: 2007. pp. 622–650. [Google Scholar]
- 25.Jones SM. Vestibular Sensory Evoked Potentials. In: Jacobson GP, Shepard NT, editors. Balance function assessment and management. Plural Publishing; San Diego: 2008. pp. 379–404. [Google Scholar]
- 26.Rabbitt RD, Damiano ER, Grant JW. Biomechanics of the semicircular canals and otolith organs. In: Highstein SM, Fay RR, Popper AN, editors. The Vestibular System. Springer-Verlag; New York: 2004. pp. 153–201. [Google Scholar]
- 27.Myers SF, Lewis ER. Vestibular afferent responses to microrotational stimuli. Brain Res. 1991;543:36–44. doi: 10.1016/0006-8993(91)91045-3. [DOI] [PubMed] [Google Scholar]
- 28.Fernandez C, Goldberg JM. Physiology of peripheral neurons innervating semicircular canals of the squirrel monkey. II. Response to sinusoidal stimulation and dynamics of peripheral vestibular system. J Neurophysiol. 1971;34:661–675. doi: 10.1152/jn.1971.34.4.661. [DOI] [PubMed] [Google Scholar]
- 29.Fernandez C, Goldberg JM. Physiology of peripheral neurons innervating otolith organs of the squirrel monkey. III. Response dynamics. J Neurophysiol. 1976;39:996–1008. doi: 10.1152/jn.1976.39.5.996. [DOI] [PubMed] [Google Scholar]
- 30.Goldberg JM, Fernandez C. Physiology of peripheral neurons innervating semicircular canals of the squirrel monkey. III. Variations among units in their discharge properties. J Neurophysiol. 1971;34:676–684. doi: 10.1152/jn.1971.34.4.676. [DOI] [PubMed] [Google Scholar]
- 31.Fernandez C, Goldberg JM, Abend WK. Response to static tilts of peripheral neurons innervating otolith organs of the squirrel monkey. J Neurophysiol. 1972;35:978–997. doi: 10.1152/jn.1972.35.6.978. [DOI] [PubMed] [Google Scholar]
- 32.Anderson JH, Blanks RHI, Precht W. Response characteristics of semicircular canal and otolith systems in cat. I. Dynamic responses of primary vestibular fibers. Exp Brain Res. 1978;32:491–507. doi: 10.1007/BF00239549. [DOI] [PubMed] [Google Scholar]
- 33.Lysakowski A, Minor LB, Fernandez C, Goldberg JM. Physiological identification of morphologically distinct afferent classes innervating the cristae ampullares of the squirrel monkey. J Neurophysiol. 1995;73:1270–1281. doi: 10.1152/jn.1995.73.3.1270. [DOI] [PubMed] [Google Scholar]
- 34.Goldberg JM, Desmadryl G, Baird RA, Fernandez C. The vestibular nerve of the chinchilla. IV. Discharge properties of utricular afferents. J Neurophysiol. 1990;63:781–790. doi: 10.1152/jn.1990.63.4.781. [DOI] [PubMed] [Google Scholar]
- 35.Correia MJ, Landolt JP, Ni M-D, Eden AR, Rae JL. A species comparison of linear and nonlinear transfer characteristics of primary afferents innervating the semicircular canal. In: Gualtierotti T, editor. The Vestibular System: Function and Morphology. Springer-Verlag; New York: 1981. pp. 280–316. [Google Scholar]
- 36.Dickman JD, Correia MJ. Responses of pigeon horizontal semicircular canal afferent fibers I. Step, trapezoid, and low-frequency sinusoid mechanical and rotational stimulation. J Neurophysiol. 1989;62:1090–1101. doi: 10.1152/jn.1989.62.5.1090. [DOI] [PubMed] [Google Scholar]
- 37.Goldberg JM, Lysakowski A, Fernandez C. Morphophysiological and ultrastructural studies in the mammalian cristae ampullares. Hear Res. 1990;49:89–102. doi: 10.1016/0378-5955(90)90097-9. [DOI] [PubMed] [Google Scholar]
- 38.Lewis ER, Parnas BR. Theoretical bases of short-latency spike volleys in the peripheral vestibular system. J Vestib Res. 1994;4:189–202. [PubMed] [Google Scholar]


