

Abstract
Hepatitis C virus (HCV) infection of the liver is a global health problem and a major risk factor for the development of hepatocellular carcinoma (HCC). Sensitive methods are needed for the improved and earlier detection of HCC, which would provide better therapy options. Metabolic profiling of the high risk population (HCV patients) and those with HCC provides insights into the process of liver carcinogenesis and possible biomarkers for earlier cancer detection. Seventy-three blood metabolites were quantitatively profiled in HCC (n=30) and cirrhotic HCV (n=22) patients using a targeted approach based on liquid chromatography resolved tandem mass spectrometry (LC-MS/MS). Sixteen of the 73 targeted metabolites differed significantly (p < 0.05) and their levels varied up to a factor of 3.3 between HCC and HCV. Four of these 16 metabolites (methionine, 5-hydroxymethyl-2′-deoxyuridine, N2,N2-dimethylguanosine and uric acid) that showed the lowest p-values were used to develop and internally validate a classification model using partial least squares discriminant analysis. The model exhibited high classification accuracy for distinguishing the two groups with sensitivity, specificity and area under the receiver operating characteristic curve of 97%, 95%, and 0.98, respectively. A number of perturbed metabolic pathways including amino acid, purine and nucleotide metabolism were identified based on the 16 biomarker candidates. These results provide a promising methodology to distinguish cirrhotic HCV patients, who are at high risk to develop HCC, from those who have already progressed to HCC. The results also provide insights into the altered metabolism between HCC and HCV.
Keywords: metabolomics, metabolite profiling, LC-MS /MS, cancer, hepatitis C virus, hepatocellular carcinoma
Introduction
Hepatitis C virus (HCV) infection is a global health problem that causes significant morbidity and mortality. Worldwide, 150-170 million people are currently infected with HCV, with 3-4 million new cases and more than 350,000 deaths reported each year according to estimates from the World Health Organization [www.who.int/mediacentre/factsheets/fs164/en/] [1]. HCV infection of the liver is a potent risk factor for the development of HCC and HCC is associated with a high mortality and morbidity [2-4]. In addition, HCV infection alone is a risk factor for progression of HCC by a factor of more than 25 [5], and it accounts for nearly 25% of the prevalence of HCC patients [6]. Studies have shown that the prevalence of HCV in industrialized nations such as the United States has more than tripled since 1975 [7, 8]. As such, the incidence of HCC has risen over the ensuing years and continues to rise to a greater extent than any other cancer subtype [9]. In the US, HCC is often diagnosed at advanced stages, mainly due to the lack of simple and sensitive methods for its early detection. The near causal link between chronic viral infection and cancer identifies a patient population whereby biomarkers of cancer risk would be instrumental in improving our current diagnostic and treatment paradigms. Better methods to identify the subset of HCV patients at highest cancer risk would allow for: 1) the establishment of more intense surveillance mechanisms, 2) the development of chemoprevention protocols, and 3) improved leverage for these patients with respect to liver transplant.
Metabolomics, in which a large number of small molecule metabolites are detected quantitatively, often in easily accessible biofluids such as blood and urine, promises useful information regarding early biomarkers and altered metabolic pathways. As metabolites are the downstream products of genes and gene expression, they integrate many of the alterations caused by disease or other biological stresses. Metabolites are exquisitely sensitive to different biological states and therefore represent a promising approach to identify potential biomarkers [10-12]. Several analytical techniques such as nuclear magnetic resonance (NMR), liquid chromatography-mass spectrometry (LC-MS) and gas chromatography–mass spectrometry (GCMS) have been used to detect metabolic changes in a number of cancers including liver cancer [13]. Several studies using a variety of analytical techniques have reported discovery of potential biomarkers in biological samples such as serum, plasma and urine of subjects with HCC relative to healthy controls. While a few of these studies have used animal models [14-16], the majority of studies were focused on humans [3, 4, 10, 15, 17-25] using NMR [4, 10], LC-MS [3, 17, 19, 20, 25, 26], GC-MS [3, 21, 22, 24, 26] or HPLC [23] methods. These studies have reported alterations in numerous metabolic pathways including glycolysis, amino acid, fatty acid and bile acid metabolism based on altered metabolites in HCC. However, none of the studies have focused exclusively on altered metabolic pathways between HCV patients, and in particular those with cirrhosis, who have high risk of developing HCC, and those who have developed HCC. We recently reported that three metabolites, choline, valine and creatinine differentiate HCC patients from HCV using high resolution NMR spectroscopy, and showed the potential utility of identification of such altered metabolites for identifying HCV patients with risk of developing HCC [27].
In the present work, we focus on identifying additional metabolic changes and altered metabolic pathways between HCC patients with underlying HCV and HCV patients who are at high risk of developing HCC. All patients in the study had cirrhotic livers. To extend the coverage of low concentration metabolites that distinguish HCV and HCC, we have chosen a targeted method based on LC-MS/MS metabolite profiling of serum. This multiplexed targeted LC-MS/MS approach has been shown to be quite robust and versatile in a variety of biomarker and systems biology studies [28-31]. In the present work, a number of significant changes were observed in several important and cancer related metabolic pathways. Utilizing multivariate statistical analysis we could combine the top performing metabolite biomarkers into a model that distinguishes between the two patient groups with excellent performance. Monitoring metabolites in HCV patients may provide improved understanding of the timing and pathogenesis of HCC, and when further developed allow identification HCV patients who are at high risk of liver cancer at an earlier stage.
Experimental
Chemicals and reagents
Methanol was obtained from Avantor Performance Materials (HPLC-grade; Center Valley, PA). Acetic acid (≥99.7%) and all the standard metabolites (≥97%) used in this study (see Supplemental Table S1) were purchased from Sigma-Aldrich (St. Louis, MO). L-Proline-13C5, 15N1 (97-99 atom % 13C, 97-99 atom % 15N) was purchased from Cambridge Isotope Laboratories (Andover, MA). Water was purified using an EASYpure II UV water purification system (Barnstead International, Dubuque, IA).
Patients and Serum sample
Patient serum samples were collected from the Indiana University/Lilly tissue bank through clinical collaboration following protocols approved by the Institutional Review Boards of both Indiana and Purdue Universities. Sample cohorts consisted of histologically proven HCC patients with underlying HCV and cirrhosis (n=30; mean age 55.5±10.7) and HCV patients with cirrhosis but without HCC (n=22; mean age 52.2 ±8.1). Table 1 shows demographic characteristics of the patient cohorts. Overnight fasted samples were collected to minimize confounding factors arising from diet. The blood samples were allowed to clot for 45 min; centrifuged at 2000 rpm for 10 min and the resulting sera were separated and aliquoted into separate tubes and frozen immediately at −70 °C. The frozen samples were then shipped over dry ice to Purdue University (West Lafayette, IN), which were stored at −80 °C freezer until used for analysis.
Table 1.
Demographic and clinical characteristics of the patients.
| Patients Characteristics | HCC | HCV |
|---|---|---|
| Number of patients | 30 | 22 |
| Age (mean ± SD) | 54.5±10.7 | 52.2±8.1 |
| Gender (F/M) | 0.3 | 0.46 |
| Caucasian | 21 | 20 |
| African American | 1 | 2 |
| Hispanic | 3 | 0 |
| Unknown race/ethnicity | 4 | 0 |
| Middle Eastern | 1 | 0 |
Sample preparation and acquisition
Frozen patient sera were thawed at room temperature for 30 min. Protein precipitation was performed by adding 600 μL methanol to 200 μL to each serum sample. The solution was vortexed vigorously for 1 min and then held for 20 min at −20 °C. The samples were centrifuged at 14,000 rpm for 20 min (Eppendorf centrifuge, model 5804, Hauppauge, NY), and the supernatant was collected and dried using a vacuum system (Vacufuge Plus, Eppendorf, Hauppauge, NY). Each dried sample was reconstituted in 50 μL water/methanol (95:5) and then transferred to an LC sample vial. Labeled sample vials were placed in the autosampler in random order and kept at −4 °C throughout the analysis. A 10 μL sample injection was used for LCMS/MS analysis in both positive and negative modes. 13C5-15N-proline was added to each serum sample, after deproteinization, and used as an internal reference. Further, to assess performance of the instrument and process reproducibility, a mixture of all the metabolites was used as a quality control sample and injected into the LC-MS/MS after every 25 patient samples, as well as before and after cleaning the ESI source; the ESI source was cleaned every 48 hrs. Duplicate sample runs were performed to account for technical reproducibility. To evaluate sensitivity and linear dynamic ranges, we determined limits of detection (LODs) and dynamic ranges from a mixture of 39 standard metabolites at 20 different concentrations (Supplementary Table S2).
LC-MS/MS system components and MS parameters
Mass spectrometric analyses were performed on an ABI Sciex API-3000 triple quadrupole mass spectrometer (AB SCIEX, Framingham, MA) equipped with an ESI turbo ion spray source operated in both positive and negative ion modes. The mass spectrometer was coupled to an Agilent 1100 series HPLC system consisting of two quaternary pumps, solvent degassers and a temperature-controlled column oven [31]. A CTC PAL autosampler (LEAP Technologies, Carrboro, NC) equipped with multiple injection ports was used for sample loading, while a VICI 2-position switching valve (Valco Instruments, Houston, TX) allowed the MS inlet to be switched between the two pumps, one of which was used for separating metabolites detected as positive ions and the other as negative ions. The two pumps allowed for alternating separation and column reconditioning to increase throughput. Multiple reaction monitoring (MRM) mode was used to detect the multiple metabolites as they eluted off of the chromatographic column using a dwell time of 100 ms per metabolite. Nitrogen gas was used as curtain, collision, and nebulizer gas, with flow rates set at 12, 10, 12 (arbitrary units), respectively. The ion spray needle voltages used for MRM positive and negative modes were set at 3600 V and −3600 V, respectively. The LC-MS/MS system was controlled by Analyst 1.5 software (AB SCIEX, Framingham, MA, USA).
Chromatography Conditions
Chromatography was performed under reverse phase conditions using an Eclipse XDB-C18 4.6×150, 5μm column (Agilent Technologies, Santa Clara, CA). The flow rate, column temperature and sample injection volume were set to 400 μL/min, 45 °C, and 10 μL, respectively. The optimized chromatography conditions were as follows: Solvent A: water with 0.1% acetic acid; Solvent B: methanol with 0.1% acetic acid. The elution gradient, 0 min: 5% B; 42 min: 95% B, was used to separate metabolites detected in negative MRM mode. For positive MRM mode, 0 min: 5% B; 35 min: 95% B were used. Before all injections, column cleaning and equilibration steps were applied.
Compound Optimization Parameters
Information about each precursor ion m/z values (Q1) and product ion m/z values (Q3) for MRM detection of the metabolites was obtained from previous studies [28-31]. To decrease the chemical background noise and increase the intensity of metabolite peaks, pre-collision cell voltages including declustering potential (DP), focusing potential (FP), collision energy (CE), and collision cell exit potential (CXP) parameters for each metabolite were optimized. To this end, a 2 μM solution for each metabolite in 50:50 water:methanol was prepared and was directly infused into the mass spectrometer using a Harvard PHD 2000 Syringe Pump (Holliston, MA) at a flow rate of 15 μL/min. The optimized metabolite parameters were obtained and used for the appropriate MRM mode.
Data analysis
Peak intensities for the 73 measured metabolites were integrated using Analyst 1.5 software (AB SCIEX, Framingham, MA). Peak integrals for each metabolite averaged over duplicate sample runs were used for further analysis. The Student’s t-test was used to evaluate statistical significance for metabolite intensity differences between HCC and HCV. Four metabolites that showed the lowest p-values between the two patient groups were then chosen for multivariate statistical analysis using partial least-squares discriminate analysis (PLS-DA). PLS-DA modeling was performed using Matlab (R2008a, Mathworks, Natick, MA) installed with the PLS toolbox (v4.1, Eigenvector Research, Wenatchee, WA). The X matrix, consisting of the MS data, was mean centered prior to all statistical analyses. Each subject was assigned either a “0” (for HCC) or “1” (for HCV) to serve as inputs to the one dimensional Y matrix. Leave-one-out cross validation (CV) was chosen, and the number of latent variables (3 in this case) was selected according to the minimum root mean square error of CV procedure. Class predictions were made visually using a Y-predicted scatter plot with a cut-off value chosen to minimize errors in class membership. The R statistical package (version 2.8.0) was used to generate receiver operator characteristic (ROC) curves and box-and-whisker plots, calculate sensitivity, specificity and area under the ROC curve (AUROC). A schematic diagram of altered metabolic pathways was drawn based on established databases [www.genome.jp; http://modomics.genesilico.pl/pathways/] to help understand the pathogenesis of the disease and indicate the relationship among the candidate biomarkers. A second multivariate PLS-DA model was constructed to analyze the sample data by selecting four metabolites based on their variable importance in projection (VIP) scores derived using all 73 metabolites, and a comparison with the results obtained using 4 lowest p-value metabolites was made.
Results
Targeted analysis using LC-MS/MS in MRM mode was performed on 73 metabolites that could be detected reliably in serum. Of these, 38 metabolites were detected in negative ion mode and 35 metabolites in positive ion mode (see Supplemental Table S1 for metabolite list). All 73 metabolites were detected in all HCC and HCV patient samples and could be measured quantitatively and reliably based on the achieved MS sensitivity and chromatographic conditions (Supplementary Figure S1 and Table S2). Good instrumental stability was observed, indicated by the CV values of 13-20% for the metabolites in the quality control samples, based on 24 measurements, 12 in positive and 12 in negative ion mode.
Initial data analysis based on the averaged peak areas of duplicate sample runs indicated 16 metabolites (tyrosine, phenylalanine, glycerol, 1-methylguanosine, methionine, N-carbamoyl-β alanine, xanthine, homocysteine, creatine, 1-methyladenosine, N2,N2-dimethylguanosine, 5-hydroxymethyl-2′-deoxyuridine, 2-deoxyguanosine, 1-methylinosine, aconitic acid and uric acid) had statistically significant differences in the samples of HCC and HCV patients, as indicated by p<0.05 using the Student’s t-test. These metabolites varied in their levels by a factor of up to 3.3 between HCC and HCV, and all except three, creatine, 1-methyladenosine and 5-hydroxymethyl-2′-deoxyuridine were down regulated in HCC compared to HCV. Table 2 shows the 16 metabolites along with their p-values and fold changes between the two groups.
Table 2.
List of metabolites with significant mean changes between HCC and HCV patients.
| Metabolite | aFC | p-value |
|---|---|---|
| Aconitic acid | 0.7 | 0.029 |
| Creatine | 2.1 | 0.029 |
| 2-Deoxyguanosine | 0.3 | 0.015 |
| Glycerol | 0.8 | 0.018 |
| Homocysteine | 0.8 | 0.036 |
| 5-Hydroxymethyl-2′-deoxyuridine | 1.5 | 0.00088 |
| Methionine | 0.7 | 0.0032 |
| 1-Methyladenosine | 1.4 | 0.011 |
| 1-Methylguanosine | 0.6 | 0.0078 |
| 1-Methylinosine | 0.5 | 0.0075 |
| N2,N2-Dimethylguanosine | 0.5 | 0.0018 |
| N-Carbamoyl β-alanine | 0.7 | 0.016 |
| Phenylalanine | 0.9 | 0.013 |
| Tyrosine | 0.8 | 0.016 |
| Uric acid | 0.7 | 0.0069 |
| Xanthine | 0.8 | 0.011 |
FC :Mean fold change (HCC / HCV).
From the 16 distinguishing metabolites, a smaller group of metabolites was chosen, based on their low p-values, to build a model and test classification accuracy and predictive power. A group of four metabolites (methionine, 5-hydroxymethyl-2′-deoxyuridine, N2,N2-dimethylguanosine and uric acid) with the lowest p-values (p≤0.0032) provided high classification accuracy. Box-and-whisker plots for these four potential biomarkers are shown in Figure 1 and indicate the individual discrimination power between HCC and HCV. The median level for 5-hydroxymethyl-2′-deoxyuridine increased in HCC by factor of 1.5, while the levels for the other three metabolites decreased. A PLS-DA model combining these four metabolites was performed using leave-one-out cross validation. The model showed an excellent separation between HCC and HCV patients with a sensitivity of 97% and specificity of 95%. The ROC curve shown in Figure 2 for the prediction model has an AUROC of 0.98. R2 and Q2 values for the model were 0.62 each, indicating that the model had good predictability.
Figure 1.
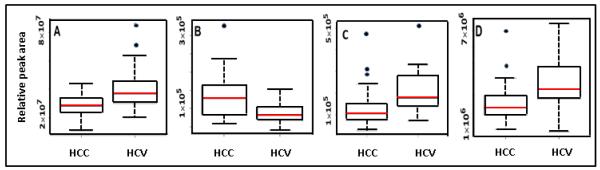
Box-and-whisker plots for the four biomarker candidates with lowest p-values between HCC and HCV: A) methionine, B) 5-hydroxymethyl-2′-deoxyuridine, C) N2,N2-dimethylguanosine and D) uric acid. The middle horizontal line in a box represents the median, the bottom and top boundaries represent the 25th and 75th percentiles, respectively. The lower and upper whiskers represent the 5th and 95th percentiles, respectively, and the open circles represent outliers.
Figure 2.

ROC curve generated from the PLS-DA model of the four metabolites shown in Figure 1.
A second approach for metabolite selection was used based on high variable importance in projection (VIP) scores. VIP analysis of the results of PLS-DA modeling using all 73 metabolites provided a number of metabolites with scores above 1. Four metabolites (5-hydroxymethyl-2′-deoxyuridine, 1-methyladenosine, 2-deoxyguanosine, and 4-hydroxybenzoic acid) were found to have the highest VIP scores. While one of the metabolites (5-hydroxymethyl-2′-deoxyuridine) thus selected was the same, three metabolites (1-methyladenosine, 2-deoxyguanosine, and 4-hydroxybenzoic acid) were different from those selected based on lowest p-values. The PLS-DA model developed using these 4 metabolites thus selected provided somewhat poorer results compared to results derived using the 4 metabolites with lowest p-values, with a sensitivity of 90% and specificity of 83%. The AUROC was also lower (0.91 versus 0.98) (Supplementary Figure S2). R2 and Q2 analysis showed that this model was not very predictive with values of 0.04 and −0.11, respectively. Further, while three of the metabolites (5-hydroxymethyl-2′-deoxyuridine, 1-methyladenosine and 2-deoxyguanosine) differed significantly between PC and controls (p<0.05), one metabolite (4-hydroxybenzoic acid) did not differ significantly (p> 0.05).
Overall, the 16 distinguishing metabolites are associated with a number of important pathways (vida infra), many of which have been previously associated with cancer [3, 4, 10, 19, 21-24]. A metabolic pathway diagram was constructed highlighting the biomarker candidates and their relationship to various pathways and is shown in Figure 3.
Figure 3.

Depiction of metabolic pathways highlighting the metabolites that are altered in HCC.
Discussion
Optimized chromatographic conditions and tandem mass spectrometry by MRM in positive and negative ion modes enabled access to a high number of reliably measured and important metabolites. In this study we could detect concentrations for 73 serum metabolites in HCV patients and HCC patients with underlying HCV. These targeted metabolites span a broad range of compound classes, including: amino acids (36% of total measured); organic acids (30%); nucleosides and nucleotides (12%); purines and their derivatives (7%); amino ketones (4%); and others (11%), as shown in Table 3. Sixteen of these metabolites that differed, significantly, indicate pathological differences between the two groups of patients. Further, the high sensitivity and specificity exhibited by the multivariate statistical model that distinguishes HCC and HCV is promising for better understanding the pathogenesis as well as for earlier detection of HCC in HCV infected patients (Figure 2).
Table 3.
Molecular class assignments for the 73 metabolites detected by LC-MS/MS.
| Classa | Number | Percentage |
|---|---|---|
| Amino acids | 26 | 36 |
| Organic acids | 22 | 30 |
| Nucleosides and nucleotides | 9 | 12 |
| Purines and its derivatives | 5 | 7 |
| Amino ketones | 3 | 4 |
| Others | 8 | 11 |
Reference: http://www.hmdb.ca
Considering that HCV is a major cause for primary liver cancer (HCC), as well as the fact that symptoms for HCC do not appear typically until the last stage of the disease, it is of significant interest to identify HCV patients with risk of developing HCC based on the identification of altered metabolites and metabolic pathways. Along these lines we recently demonstrated the potential benefit of identifying metabolite markers in serum using NMR spectroscopy [27]. However, due to the limited sensitivity of NMR, a relatively small number of distinguishing metabolites was identified from the study. The high sensitivity of the LC-MS/MS approach used in the present study provided a much wider pool of distinguishing metabolites that are complementary to those identified by NMR. To understand the pathogenesis of the disease and indicate the relationship among candidate biomarkers, a schematic pathway diagram highlighting potential biomarker candidates and their pathway relationships is shown in Figure 3. In the figure, metabolites that showed statistically significant alterations in intensity are shown in square boxes. The three up-regulated metabolites are shown with an upward pointing arrow.
A number of altered metabolic pathways including the beta-alanine pathway (metabolite: N-carbamoyl-β-alanine), glycolipid (glycerol), amino acid (phenylalanine, tyrosine, creatine, cysteine, methionine, homocysteine), purine (xanthine and uric acid), and nucleoside pathways (1-methyladenosine, 1-methylinosine, deoxyguanosine, 1-methylguanosine and N,N-dimethylguanosine) were identified as being affected due to HCC, based on the 16 metabolites with altered levels. To the best of our knowledge, 4 of these 16 metabolites (N-carbamoyl-β-alanine, 5- hydroxymethyl-2′-deoxyuridine, 2-deoxyguanosine, and aconitic acid) have not been previously reported as being associated with the development of liver cancer, while 12 of 16 have been reported as potential biomarkers for liver cancer and hepatitis [3, 4, 10, 19-24].
As shown in Table 2, the mean levels for all of the amino acid biomarker candidates with low p-values, including tyrosine, phenylalanine, methionine, homocysteine, and N-carbamoyl-β-alanine decrease in HCC compared with HCV. The results are in agreement with the previous studies that reported a decrease of amino acids in malignant tumors is related to an increase demand for amino acid in the presence of tumors [32, 33]. Creatine was observed to increase in the HCC patients, in agreement with previous studies that showed an increase in concentration of creatine reported in HCC and lung tissue that reflect alterations in energy metabolism [4, 34, 35]. A decrease in methionine levels may be related to the low level of serine in the serum of HCC patients that has also been reported previously [3]. We also found that the mean level of xanthine decreased in HCC compared to HCV. Xanthine is formed from hypoxanthine by xanthine oxidase [36]. The activity of xanthine oxidase was observed to decrease in individual cancer [37]. Therefore, a decrease in the mean level of xanthine in HCC compared to HCV may be related to a decrease in xanthine oxidase activity.
Of the four metabolites with low p-values that were used for building the classification model, three metabolites (methionine, N2,N2-dimethylguanosine, uric acid) were down-regulated in HCC, while one (5-hydroxymethyl-2′-deoxyuridine) was elevated in HCC compared to HCV. Association of these metabolites with the metabolic pathways is highlighted in Figure 3. The up-regulated metabolite, 5- hydroxymethyl-2′-deoxyuridine, is reported to be associated with DNA repair and is thought to be involved in the pathogenesis of many diseases including cancer. A number of studies have reported that cancer patients often have higher levels of oxidative DNA damage as indicated by increased levels of 5-hydroxymethyl-2-deoxyuridine [38, 39].
The PLS-DA classification model developed using a panel of 4 highly significant metabolites, based on lowest p-value, provided high performance in terms of sensitivity (97%), specificity (95%) and area under the receiver operating characteristic curve (0.98%) and the results were better than those obtained based on metabolite selected using highest VIP scores (Figures 2 and S2). As a comparison, a similar PLS-DA model developed using the 3 significant metabolites (creatinine, choline and valine) obtained using NMR spectroscopy provided a sensitivity of 80%, specificity of 71% and an area under the receiver operating curve of 0.83 [27]. These results indicate the potential of profiling a larger number of metabolites to distinguish HCC and HCV. The three metabolites identified by NMR were not considered for inclusion in the present PLS-DA model since, in the present study, creatinine was not targeted in the LC-MS/MS analysis, and choline and valine did not show significant differences in their levels. The NMR signal for choline also contains a contribution from phosphocholine, that was not targeted in the LC-MS/MS analysis; valine can overlap with guanadinoacetate [30] and therefore make its accurate measurement challenging. Additional work on a larger set of samples is planned to validate the current and prior findings.
Conclusions
This study reports the relative quantitative measurement of 73 targeted serum metabolites associated with many important metabolic pathways to profile patients with HCC and HCV by LC-MS/MS. Sixteen metabolites showed significantly altered levels between the two patient classes, while the top four biomarker candidates could be combined using multivariate statistical data analysis to provide an accurate model. In particular, the model distinguished the two patient groups with a sensitivity of 97%, specificity of 95%, and an AUROC of 0.98. These results are promising for identifying patients with underlying HCV who have developed HCC, and provide further insights into the altered metabolic processes that occur in the development of HCC in a high risk patient population.
Supplementary Material
Acknowledgements
This study was supported by the NIH (1R21CA133770), the Oncological Sciences Center in Discovery Park and the Purdue University Center for Cancer Research.
Abbreviations
- LC-MS
liquid chromatography–mass spectrometry
- HPLC
high-performance liquid chromatography
- AUROC
area under the receiver operating characteristic
- PLS-DA
partial least squares discriminant analysis
- ROC
receiver operating characteristic
- NMR
nuclear magnetic resonance
- GC-MS
gas chromatography–mass spectrometry
- VIP
Variable Importance in Projection
References
- [1].Lavanchy D. Clin Microbiol Infect. 2011;17:107–115. doi: 10.1111/j.1469-0691.2010.03432.x. [DOI] [PubMed] [Google Scholar]
- [2].Anthony PP. Histopathology. 2001;39:109–118. doi: 10.1046/j.1365-2559.2001.01188.x. [DOI] [PubMed] [Google Scholar]
- [3].Tianlu Chen GX, Wang Xiaoying, Fan Jia, Qiu Yunping, Zheng Xiaojiao, Qi Xin, Cao Yu, Su Mingming, Wang Xiaoyan, Xu Lisa X., Yen Yun, Liu Ping, Jia Wei. MCP Papers. 2011 doi: 10.1074/mcp.M110.004945. in Press. [DOI] [PMC free article] [PubMed] [Google Scholar]
- [4].Shariff MIF, Gomaa AI, Cox IJ, Patel M, Williams HRT, Crossey MME, Thillainayagam AV, Thomas HC, Waked I, Khan SA, Taylor-Robinson SD. J Proteome Res. 2011;10:1828–1836. doi: 10.1021/pr101096f. [DOI] [PubMed] [Google Scholar]
- [5].El-Serag HB. Hepatology. 2002;36:S74–83. doi: 10.1053/jhep.2002.36807. [DOI] [PubMed] [Google Scholar]
- [6].Maasoumy B, Wedemeyer H. Best Pract Res Clin Gastroenterol. 2012;26:401–412. doi: 10.1016/j.bpg.2012.09.009. [DOI] [PubMed] [Google Scholar]
- [7].El-Serag HB, Davila JA, Petersen NJ, McGlynn KA. Ann Intern Med. 2003;139:817–823. doi: 10.7326/0003-4819-139-10-200311180-00009. [DOI] [PubMed] [Google Scholar]
- [8].Altekruse SF, McGlynn KA, Reichman ME. J Clin Oncol. 2009;27:1485–1491. doi: 10.1200/JCO.2008.20.7753. [DOI] [PMC free article] [PubMed] [Google Scholar]
- [9].Siegel R, Naishadham D, Jemal A. CA Cancer J Clin. 2013;63:11–30. doi: 10.3322/caac.21166. [DOI] [PubMed] [Google Scholar]
- [10].Gao H, Lu Q, Liu X, Cong H, Zhao L, Wang H, Lin D. Cancer Science. 2009;100:782–785. doi: 10.1111/j.1349-7006.2009.01086.x. [DOI] [PMC free article] [PubMed] [Google Scholar]
- [11].Zhang J, Liu L, Wei S, Nagana Gowda GA, Hammoud Z, Kesler KA, Raftery D. The Journal of Thoracic and Cardiovascular Surgery. 2011;141:469–475.e464. doi: 10.1016/j.jtcvs.2010.08.025. [DOI] [PubMed] [Google Scholar]
- [12].Mayr M. Circ Cardiovasc Genet. 2008;1:58–65. doi: 10.1161/CIRCGENETICS.108.808329. [DOI] [PubMed] [Google Scholar]
- [13].Gowda GA, Zhang S, Gu H, Asiago V, Shanaiah N, Raftery D. Expert Rev Mol Diagn. 2008;8:617–633. doi: 10.1586/14737159.8.5.617. [DOI] [PMC free article] [PubMed] [Google Scholar]
- [14].Li S, Liu H, Jin Y, Lin S, Cai Z, Jiang Y. J Chromatogr B Analyt Technol Biomed Life Sci. 2011;879:2369–2375. doi: 10.1016/j.jchromb.2011.06.018. [DOI] [PubMed] [Google Scholar]
- [15].Tan Y, Yin P, Tang L, Xing W, Huang Q, Cao D, Zhao X, Wang W, Lu X, Xu Z, Wang H, Xu G. Mol Cell Proteomics. 2012;11:M111 010694. doi: 10.1074/mcp.M111.010694. [DOI] [PMC free article] [PubMed] [Google Scholar]
- [16].Wang J, Zhang S, Li Z, Yang J, Huang C, Liang R, Liu Z, Zhou R. Tumour Biol. 2011;32:223–231. doi: 10.1007/s13277-010-0116-7. [DOI] [PubMed] [Google Scholar]
- [17].Zhou L, Wang Q, Yin P, Xing W, Wu Z, Chen S, Lu X, Zhang Y, Lin X, Xu G. Anal Bioanal Chem. 2012;403:203–213. doi: 10.1007/s00216-012-5782-4. [DOI] [PubMed] [Google Scholar]
- [18].Patterson AD, Maurhofer O, Beyoglu D, Lanz C, Krausz KW, Pabst T, Gonzalez FJ, Dufour JF, Idle JR. Cancer Res. 2011;71:6590–6600. doi: 10.1158/0008-5472.CAN-11-0885. [DOI] [PMC free article] [PubMed] [Google Scholar]
- [19].Chen F, Xue J, Zhou L, Wu S, Chen Z. Anal Bioanal Chem. 2011;401:1899–1904. doi: 10.1007/s00216-011-5245-3. [DOI] [PMC free article] [PubMed] [Google Scholar]
- [20].Yin P, Wan D, Zhao C, Chen J, Zhao X, Wang W, Lu X, Yang S, Gu J, Xu G. Molecular BioSystems. 2009;5:868. doi: 10.1039/b820224a. [DOI] [PubMed] [Google Scholar]
- [21].Wu H, Xue R, Dong L, Liu T, Deng C, Zeng H, Shen X. Anal Chim Acta. 2009;648:98–104. doi: 10.1016/j.aca.2009.06.033. [DOI] [PubMed] [Google Scholar]
- [22].Lin X, Zhang Y, Ye G, Li X, Yin P, Ruan Q, Xu G. J Sep Sci. 2011;34:3029–3036. doi: 10.1002/jssc.201100408. [DOI] [PubMed] [Google Scholar]
- [23].Yang J, Xu G, Zheng Y, Kong H, Pang T, Lv S, Yang Q. Journal of Chromatography B. 2004;813:59–65. doi: 10.1016/j.jchromb.2004.09.032. [DOI] [PubMed] [Google Scholar]
- [24].Xue R, Lin Z, Deng C, Dong L, Liu T, Wang J, Shen X. Rapid Commun Mass Sp. 2008;22:3061–3068. doi: 10.1002/rcm.3708. [DOI] [PubMed] [Google Scholar]
- [25].Wang B, Chen D, Chen Y, Hu Z, Cao M, Xie Q, Chen Y, Xu J, Zheng S, Li L. J Proteome Res. 2012;11:1217–1227. doi: 10.1021/pr2009252. [DOI] [PubMed] [Google Scholar]
- [26].Patterson AD, Maurhofer O, Beyoglu D, Lanz C, Krausz KW, Pabst T, Gonzalez FJ, Dufour JF, Idle JR. Cancer Research. 2011;71:6590–6600. doi: 10.1158/0008-5472.CAN-11-0885. [DOI] [PMC free article] [PubMed] [Google Scholar]
- [27].Wei S, Suryani Y, Gowda GAN, Skill N, Maluccio M, Raftery D. Metabolites. 2012;2:701–716. doi: 10.3390/metabo2040701. [DOI] [PMC free article] [PubMed] [Google Scholar]
- [28].Bajad SU, Lu W, Kimball EH, Yuan J, Peterson C, Rabinowitz JD. Journal of chromatography. A. 2006;1125:76–88. doi: 10.1016/j.chroma.2006.05.019. [DOI] [PubMed] [Google Scholar]
- [29].Lewis GD, Wei R, Liu E, Yang E, Shi X, Martinovic M, Farrell L, Asnani A, Cyrille M, Ramanathan A, Shaham O, Berriz G, Lowry PA, Palacios IF, Tasan M, Roth FP, Min J, Baumgartner C, Keshishian H, Addona T, Mootha VK, Rosenzweig A, Carr SA, Fifer MA, Sabatine MS, Gerszten RE. J Clin Invest. 2008;118:3503–3512. doi: 10.1172/JCI35111. [DOI] [PMC free article] [PubMed] [Google Scholar]
- [30].Wei R, Li G, Seymour AB. Anal Chem. 2010;82:5527–5533. doi: 10.1021/ac100331b. [DOI] [PubMed] [Google Scholar]
- [31].Djukovic D, Baniasadi HR, Kc R, Hammoud Z, Raftery D. Rapid Commun Mass Sp. 2010;24:3057–3062. doi: 10.1002/rcm.4739. [DOI] [PubMed] [Google Scholar]
- [32].Lai HS, Lee JC, Lee PH, Wang ST, Chen WJ. Semin Cancer Biol. 2005;15:267–276. doi: 10.1016/j.semcancer.2005.04.003. [DOI] [PubMed] [Google Scholar]
- [33].Asiago VM, Alvarado LZ, Shanaiah N, Gowda GA, Owusu-Sarfo K, Ballas RA, Raftery D. Cancer Res. 2010;70:8309–8318. doi: 10.1158/0008-5472.CAN-10-1319. [DOI] [PMC free article] [PubMed] [Google Scholar]
- [34].Rocha CM, Barros AS, Gil AM, Goodfellow BJ, Humpfer E, Spraul M, Carreira IM, Melo JB, Bernardo J, Gomes A, Sousa V, Carvalho L, Duarte IF. J Proteome Res. 2010;9:319–332. doi: 10.1021/pr9006574. [DOI] [PubMed] [Google Scholar]
- [35].Yokota H, Guo J, Matoba M, Higashi K, Tonami H, Nagao Y. J Magn Reson Imaging. 2007;25:992–999. doi: 10.1002/jmri.20902. [DOI] [PubMed] [Google Scholar]
- [36].Newaz MA, Adeeb NNN, Muslim N, Razak TA, Htut NN. Clin Exp Hypertens. 1996;18:1035–1050. doi: 10.3109/10641969609081033. [DOI] [PubMed] [Google Scholar]
- [37].Weber G. Clin Biochem. 1983;16:57–63. doi: 10.1016/s0009-9120(83)94432-6. [DOI] [PubMed] [Google Scholar]
- [38].Djuric Z, Heilbrun LK, Simon MS, Smith D, Luongo DA, LoRusso PM, Martino S. Cancer. 1996;77:691–696. [PubMed] [Google Scholar]
- [39].Evans MD, Saparbaev M, Cooke MS. Mutagenesis. 2010;25:433–442. doi: 10.1093/mutage/geq031. [DOI] [PubMed] [Google Scholar]
Associated Data
This section collects any data citations, data availability statements, or supplementary materials included in this article.