Abstract
Emulsions of monopalmitoylglycerol (MPG) and of a neutral lipid blend (NLB), consisting of MPG, monostearoylglycerol, dipalmitoylglycerol, dioleoylglycerol and dilineoylglycerol (4:2:1:1:1), the composition associated with hemozoin from the malaria parasite Plasmodium falciparum, have been used to mediate the formation of β-hematin microcrystals. Transmission electron microscopy (TEM), electron diffraction and electron spectroscopic imaging/electron energy loss spectroscopy (ESI/EELS) have been used to characterize both the lipid emulsion and β-hematin crystals. The latter have been compared with β-hematin formed at a pentanol/aqueous interface and with hemozoin both within P. falciparum parasites and extracted from the parasites. When lipid and ferriprotoporphyrin IX solutions in 1:9 v/v acetone/methanol were thoroughly pre-mixed either using an extruder or ultrasound, β-hematin crystals were found formed in intimate association with the lipid droplets. These crystals resembled hemozoin crystals, with prominent {100} faces. Lattice fringes in TEM indicated that these faces made contact with the lipid surface. The average length of these crystals was 0.62 times the average diameter of NLB droplets and their size distributions were statistically equivalent after 10 min incubation, suggesting that the lipid droplets also controlled the sizes of the crystals. This most closely resembles hemozoin formation in the helminth worm Schistosoma mansoni, while in P. falciparum, crystal formation appears to be associated with the much more gently curved digestive vacuole membrane which apparently leads to formation of much larger hemozoin crystals, similar to those formed at the flat pentanol-water interface.
1. INTRODUCTION
Hemozoin, or malaria pigment, is a crystalline cyclic dimer of ferriprotoporphyrin IX (Fe(III)PPIX), chemically, spectroscopically and crystallographically identical to β-hematin (recently also referred to as hematin anhydride).1–3 The biocrystallization of Fe(III)PPIX into hemozoin is employed by several blood-feeding organisms, including the protozoan malaria parasite, the helminth worm Schistosoma and the kissing bug Rhodnius as a heme detoxification process.4–6 Inhibition of hemozoin formation has been implicated as the mechanism of action of several antimalarial drugs, most notably chloroquine.7–9
The cyclic dimeric structure of hemozoin arises from the coordination of the propionate side chain of one Fe(III)PPIX molecule to the Fe(III) center of another. These dimers are linked to one another by hydrogen bonds in the crystal structure. The unit cell structure has been shown to be triclinic with dimensions a = 12.2 Å, b = 14.7 Å, c = 8.0 Å, α = 90.2°, β = 96.8° and γ = 97.9°.1 The theoretical growth form has been shown to be lath-shaped with the long axis coinciding with the c-axis of the unit cell and exhibiting dominant {100} and {010} side faces, a less-developed {011} face and a minor {001} face.10
The mechanism of hemozoin formation is not yet fully understood. Histidine-rich proteins,11 enzymes7 and lipids12 have all been thought to mediate its formation. Recently, a protein referred to as heme detoxification protein (HDP) has been implicated in its formation,13 possibly as part of a larger protein complex.14 Nonetheless, there is compelling evidence that hemozoin formation is closely associated with lipids. In the insect Rhodnius prolixus hemozoin has been shown to form in vesicles bounded by a phospholipid bilayer with crystals formed in close contact with the membrane.15 In Schistosoma mansoni the crystals have been observed to form in association with lipid droplets in the gut lumen of the worm.15,16 Neutral acyl glycerol lipids have also been found to be associated with hemozoin from the malaria parasite Plasmodium falciparum.17,18 Pisciotta et al. reported that initial formation of hemozoin occurs within so-called neutral lipid nanospheres.18 Recently, however, evidence from synchrotron X-ray nanoprobe Fe fluorescence, X-ray diffraction and cryogenic X-ray tomography have provided evidence that clusters of oriented hemozoin crystals are formed on the inner leaflet of the parasite digestive vacuole membrane (DV), possibly in association with a neutral lipid patch or layer on the inside of the DV.19,20
Analysis by global mass spectrometric lipidomics of lipids associated with hemozoin extracted by sucrose cushion centrifugation has identified considerable amounts of monopalmitoylglycerol (MPG) and monostearoylglycerol (MSG), but not monooleoylglycerol or monolineoylglycerol to be closely associated with hemozoin. Minor quantities of dipalmitoylglycerol (DPG), dioleoylglycerol (DOG) and dilineoylglycerol (DLG) were also detected. Fatty acid analysis of the neutral lipid blend (NLB) showed that it comprises MSG/MPG/DPG/DOG/DLG in the ratio 4:2:1:1:1.18 Subsequent kinetic studies have shown this NLB to be very efficient in mediating the process of β-hematin formation under conditions of temperature, pH and ionic composition that mimic the parasite DV.21–23
In previous studies it has been shown that neutral lipids including MPG, MSG and the NLB spontaneously form a lipid emulsion when deposited as a 9:1 acetone/methanol solution (v/v) on the surface of citrate buffered aqueous medium. The resulting lipid droplets fall into a range of sizes. When Fe(III)PPIX is introduced with the lipid, β-hematin crystals form rapidly.21,22 It has been proposed that the size of the crystals may be controlled by the size of the lipid droplets,21 but this has not been demonstrated. Nor has there been a systematic investigation of the influence of the lipid on shape, crystallinity or locality of formation of β-hematin.
In this study, we characterized β-hematin crystals produced in the presence of MPG and NLB emulsions prepared in three different ways with different sized droplets as well as at the pentanol-aqueous interface. These were compared to hemozoin crystals isolated from the parasite itself using transmission electron microscopy (TEM) and electron diffraction. In addition, we investigated the location of β-hematin crystals formed with respect to NLB particles, the nature and structure of NLB emulsions and, finally, the relationship between β-hematin crystal length and NLB particle size. These findings show that the crystals occur with their {100} faces in contact with the lipid and that crystal sizes are correlated with lipid particle sizes. Comparisons are made with hemozoin in Plasmodium falciparum.
2. EXPERIMENTAL PROCEDURE
2.1 Materials and Apparatus
An Avanti® Mini-Extruder and 1,2-dimyristoyl-sn-glycero-3-phosphocholine (DMPC) were purchased from Avanti Polar Lipids, Alabaster, USA. Lipids rac-1-monopalmitoylglycerol (MPG), rac-1-monostearoylglycerol (MSG), 1,3-dipalmitoylglycerol (DPG), 1,3-dilinoleoylglycerol (DLG), 1,3-dioleoylglycerol (DOG) as well as citric acid monohydrate were all purchased from Sigma-Aldrich. Lipophilic 3,3'-dioctadecyloxacarbocyanine perchlorate fluorescent dye (DiO) was purchased from Molecular Probes and porcine hemin from Fluka. Sodium hydroxide, acetone and methanol were obtained from KIMIX. Fe(III)PPIX solutions were prepared by dissolving 2 mg hemin in 400 μL 0.1 M NaOH. The solution was vortexed and sonicated for 3–5 minutes and then made up to 1 mL with 1:9 v/v acetone/methanol. Neutral lipid blend (NLB) solutions of 3.31 mM (total lipid concentration) were prepared by dissolving MSG, MPG, DPG, DLG and DOG (4:2:1:1:1) in 1:9 v/v acetone/methanol. Citric acid solution (50 mM) was prepared from citric acid monohydrate salt and the pH adjusted to 4.8 with NaOH. NLB solutions alone or in combination with Fe(III)PPIX at lipid/heme mol ratios of 2.15, 1.07 and 0.54 were mixed in three different ways. They were mixed by vortexing, by “micromixing” through 10 μm pore filters using an Avanti® Mini-Extruder (passing the solution 23 times through the extruder), or by ultrasonication. The concentration of DiO dye used in staining NLB was 5 μg/mL.
2.2 Preparation of β-Hematin Crystals
β-Hematin crystals were prepared using a method previously described.21,24 Briefly, 50 mL citric acid buffer (50 mM, pH 4.8) in a Schott-Duran crystallization dish with internal diameter of 9 cm was pre-incubated for 30 min at 37°C in a water bath. Vortexed, “micromixed” or ultrasonicated solutions of lipid and Fe(III)PPIX mixture (2.15, 1.07 and 0.54 lipid/heme mol ratio) in 1:9 v/v acetone/methanol were layered carefully on the surface of the citric acid buffer using a 1 mL syringe and this was incubated further at 37 °C for different lengths of time. In the case of β-hematin formation at the pentanol-water interface,24 10 mL of pentanol was introduced onto 50 mL citric acid buffer (50 mM, pH 4.8) and pre-incubated for 30 min at 37 °C in a water bath. These two solutions are immiscible and so the pentanol floats above the citric acid buffer solution forming an interface between the two solutions. Fe(III)PPIX solution (1.5 mL) was carefully introduced at the pentanol-aqueous interface and allowed to incubate for about 4 hours at 37°C in a water bath. The entire mixture was then filtered through Whatman filter discs (0.22 μm) using a filtration device and the precipitate was washed with 5% pyridine solution. The filtered products were washed twice with deionized water before imaging using TEM.
2.3 Characterization of β-hematin crystals
Solutions containing the product formed at the NLB-water interface were placed on a glow-discharged carbon-coated grid and excess solution was blotted with filter paper. The grid was stained with uranyl acetate so that the material could be clearly viewed against a stained background. Excess stained material was blotted with filter paper and the grid was allowed to dry at room temperature before visualizing using a TECNAI TF20 TEM operating at 200 kV for both normal imaging and acquisition of electron diffraction data. Crystals of β-hematin were also prepared from 2.15, 1.07 and 0.54 lipid/heme mol ratios for normal TEM imaging to check for any differences in the external morphology of crystals formed.
2.4 Indexing of diffraction patterns
The SingleCrystal application of CrystalMaker® software Version 2.2 was used to index the diffraction patterns obtained from β-hematin crystals.25 The calculated structural data for β-hematin described by Pagola et al. was used to build a structural model of the β-hematin crystal using CrystalMaker®. The single crystal diffraction software was then used to predict a simulated diffraction pattern based on this structure. The Grid tool in SingleCrystal™ was used to index the diffraction pattern obtained from β-hematin crystals. Briefly, the observed electron diffraction pattern obtained from the β-hematin crystals was opened using the single crystal window of the software. In the same window, the CrystalMaker® file for the reported β-hematin crystal structure was loaded. The Grid tool was superimposed on the observed diffraction pattern, making sure that all observed diffraction spots coincided. The grid was adjusted such that all grid points lay directly over the observed points. The software was then used to match the simulated pattern with the observed pattern, with the strongest reflections being indexed in this manner.
2.5 Observation of NLB droplet size
NLB solutions prepared in 1:9 v/v acetone/methanol were carefully layered using a 1 mL syringe on the surface of 50 mL citric acid buffer (50 mM, pH 4.8) that had been pre-incubated for 30 minutes at 37 °C in a water bath. This was allowed to incubate further at 37 °C in a water bath. At 10, 30 and 60 min incubation time, materials were taken from the NLB-water interface and placed on a glow-discharged carbon-coated grid. Excess solution was blotted on filter paper followed by staining with uranyl acetate. Excess stained material was blotted with filter paper and the grid was allowed to dry at room temperature before imaging using a TECNAI TF20 TEM operating at 200 kV.
2.6 Confocal laser microscopy characterization of neutral lipid emulsions
Solutions of NLB stained with hydrophobic DiO dye were observed for fluorescence using an LSM510-META Zeiss confocal microscope. A suspension of 2 μL DiO stained NLB solution was placed on a microscope glass slide and a thin glass cover slip was placed on top of the solution taking care to avoid air bubble formation in the NLB solution between the glass slide and cover slip. The microscope slide was carefully inverted and mounted in the confocal microscope sample chamber. The sample was viewed with water immersion. Acquisition of continuous z-stacked images through NLB droplets was carried out under the following conditions; pin-hole diameter of 444 μm, excitation laser at 488 nm, 20% transmission power, detection band pass 500–530 nm (emission) and LD C-Apochromat 40×/1.1 W objective.
2.7 TEM characterization of neutral lipid emulsions
NLB solution prepared in 1:9 v/v acetone/methanol was carefully layered using a 1 mL syringe on the surface of 50 mL citric acid buffer (50 mM, pH 4.8) containing 6.75 mg/mL CsCl which had been pre-incubated for 30 minutes at 37 °C in a water bath. Solutions containing NLB droplets collected at the interface were placed on a glow-discharged carbon-coated grid and processed further as described above for imaging using a TECNAI TF20 TEM. Electron spectroscopic imaging/electron energy loss spectroscopy (ESI/EELS) analysis of Cs distribution in NLB droplets was performed using the TECNAI TF20 TEM.
2.8 Liposome preparation and characterization
Lipid solution was prepared by dissolving 15 mg of DMPC in 1 mL chloroform. A laboratory vacuum pump was used to evaporate the chloroform (lyophilization) for 3 days, leaving behind a dry lipid film or cake. The DMPC lipid film was hydrated with 6.75 mg/mL aqueous CsCl solution at 70 °C and the solution was vortexed every 5–10 minutes for about 80 minutes to form predominantly large multilamellar vesicles (liposomes). The liposome solution was then sonicated for 30 minutes in a water bath sonicator at 70 °C. It was then extruded using an Avanti® Mini-Extruder by passing it back and forth 23 times through a 0.1 μm filter. The extruded solution was placed on a glow-discharged carbon-coated grid and processed for TEM imaging as described above. ESI/EELS analysis of Cs distribution in liposome structures was carried out on a FEI TECNAI TF20 with GIF 863 Tridiem transmission electron microscope using a slit width of 20 eV. Data were processed with Digital micrograph software from Gatan. Images were recorded at energies before the CsM4,5 absorption edge (681 and 711 eV), and the third was centered at 726 eV. The background images were then extrapolated from the data at 681 and 711 eV and subtracted from the image collected at 726 eV.
Liposome preparations were also viewed using Cryo-TEM. Briefly, a solution of liposome preparation was placed on a glow-discharged quantifoil holey carbon-coated grid and mounted on PC controlled automated sample preparation machine (Vitrobot MkIV). Excess solution on the grid was blotted on filter paper and the grid was immidiately plunged into liquid ethane (ethane cooled to its melting point with liquid nitrogen). The grid was then taken out and mounted in a cryo-holder (Gatan) and imaged at liquid nitrogen temperature using the TECNAI TF20 TEM operating at 200kV.
2.9 Localization of β-hematin crystals formed with NLB
Solutions containing product formed using MPG/Fe(III)PPIX or NLB/Fe(III)PPIX solutions either “micromixed” or ultrasonicated were carefully taken from the lipid-water emulsion at 10, 30 and 60 min incubation time and placed on a glow-discharged carbon-coated grid. The carbon-coated grids were carefully blotted on filter paper and stained with uranyl acetate. Excess solution was blotted on filter paper and the grid was allowed to dry at room temperature. Imaging was done using a TECNAI TF20 TEM operating at 200 kV equipped with a Gatan US4000 CCD camera. Electron spectroscopic imaging/electron energy loss spectroscopy (ESI/EELS) analysis of Fe distribution in NLB droplets was performed using a FEI TECNAI TF20 with GIF 863 Tridiem transmission electron microscope with a slit width of 20 eV. Data were processed with Digital micrograph software from Gatan. Images were recorded at energies before the FeL3 absorption edge (650 and 693 eV), and the third was centered at 708 eV. The background images were then extrapolated from the data at 650 and 693 eV and subtracted from the image collected at 708 eV.
2.10 Estimation of lipid droplet and crystal sizes
The sizes of NLB droplets and β-hematin or hemozoin crystals from a minimum of 34 randomly selected TEM image fields of NLB and β-hematin preparations at different incubation times were manually measured. A total of 309 NLB droplets and 223 β-hematin crystals was measured in the case of the 10 min incubation time point and used for statistical analyses.
2.11 Parasite culturing, TEM and hemozoin extraction
Parasites were grown in continuous culture according to the method of Trager and Jensen,26 with minor modifications. Briefly, parasites (chloroquine sensitive strain, D10) were maintained in culture with complete culture medium consisting of RPMI 1640, glutamine, glucose, HEPES buffer, hypoxanthine, NaHCO3 and albumax. Parasitized red blood cells were diluted to 5% hematocrit with complete culture medium in a flask. The flask was gassed with oxygen for about 2 min before incubating it in a CO2 incubator at 37 °C. The complete culture medium was changed after every 24 hours. Parasites were subcultured after every 48 hours with the addition of washed red blood cells (group O+).
For TEM, parasites were synchronized with 5% sorbitol. The parasite culture was harvested after 24 h by centrifuging at 750 rpm for 5 min. The pellet, consisting of infected and uninfected red blood cells, was washed three times with 10 volumes of cacodylate wash buffer. Fixative (paraformaldehyde, glutaraldehyde and 0.1% malachite green) was then added to the washed pellet and the sample kept at 4 °C for 24 h. The pellet was then washed again with wash buffer followed by fixation with 1% tannic acid in wash buffer while tumbling for 1 h. It was then washed two times with wash buffer and post fixed with 1% OsO4 and 0.1% malachite green in wash buffer for 1 h while tumbling. Further washing was carried out three times with wash buffer followed by dehydration of cells by sequential incubation in 30, 50, 75 and 100 % ethanol for 10 min each while tumbling. Further dehydration was effected with 100% acetone for 10 min. The dehydrated cells were resuspended and incubated in 25:75, 50:50 and 75:25 Spurr's resin/acetone mixture for 2 h each. The cells were finally incubated in 100% Spurr's resin overnight. They were then transferred into freshly prepared 100% Spurr's resin and tumbled for a day. The cells were then again transferred into fresh 100% Spurr's resin in a microfuge tube and heated at 60 °C in a heating block to solidify. The solid blocks were cut into ultra-thin sections (60 – 80 nm) with an ultra-microtome using a diamond knife.
Hemozoin was isolated from purified DVs. For this purpose, trophozoite stage parasites were isolated from infected red blood cells by lysis with 1% saponin solution for 2 min. The lysate was centrifuged at 1500 rpm for 10 min and the supernatant decanted leaving behind the pelleted trophozoites. These were then washed three times with phosphate buffered saline. The isolated trophozoites were washed with reaction buffer, the supernatant decanted and the pellet resuspended in deionized water (pH 4.6). The suspension was triturated 10 times using a 26.5 gauge needle to break open the trophozoites and release the parasite DVs and other cytosolic materials into solution. This was centrifuged at 1300 rpm for 1 min. The supernatant was decanted and the pelleted DVs resuspended in 1 mL of reaction buffer. 10 μL DNase I was added to the solution to digest any DNA present and the solution was incubated for 5 min at 37 °C in a water bath. The incubated solution was centrifuged at 1300 rpm for 1 min and the supernatant decanted. The pelleted parasite DVs were washed three times with reaction buffer.27 Isolated DVs were resuspended in deionized water and then broken open by freeze-thaw at −80 °C to release the hemozoin crystals. The mixture was then spun down at 1300 rpm for 1 minute. The supernatant was discarded, leaving the pelleted hemozoin crystals. This process was repeated at least three times to ensure all DVs were completely lysed.
3. RESULTS
3.1 Survey of the size and appearance of β-hematin crystals nucleated at lipid-water and pentanol-water interfaces and comparison with hemozoin
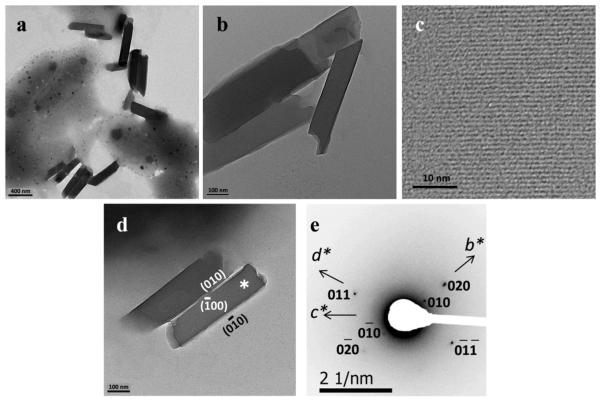
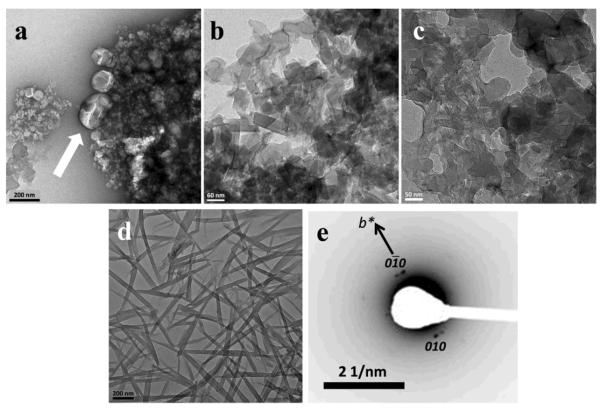
Hemozoin extracted from P. falciparum consisted of large very uniform crystals which exhibited readily discernible lattice fringes and tended to lie on their {100} or faces as demonstrated by electron diffraction (Figure 1 and Supporting Information Figure S1). The observed average length-to-width ratio of the isolated hemozoin crystals was 3.4. This value is consistent with the corresponding calculated length-to-width ratio of 3.3 previously reported based on the ratio of attachment energy values (Eatt{001}/Eatt{100}) that were obtained for the theoretical growth form of β-hematin.10 The average length of hemozoin crystals was found to be around 0.5 μm, but covered a range from about 0.18–1.4 μm (Figure S2).
Figure 1.
Hemozoin extracted from P. falciparum observed using TEM. Crystals were lath shaped (a and b), exhibited very regular lattice fringes with a spacing of 12.6 Å (c), confirming that the crystals tended to lie on their {100} or faces (d). The electron diffraction pattern from the crystals in (d) is shown in (e) and shows that crystal faces such as that marked * were normal to a* and corresponded to the face.
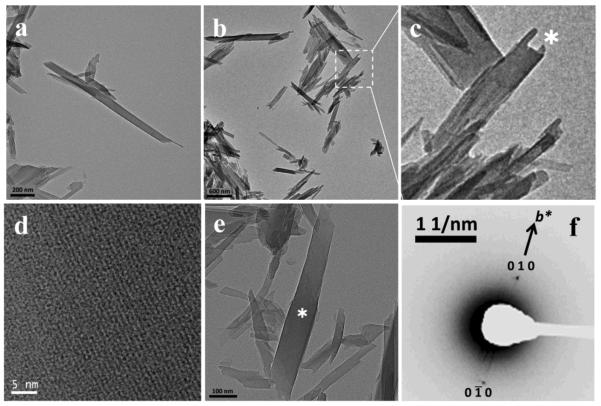
Crystals of β-hematin formed at the pentanol-aqueous interface were rather similar to hemozoin in both size and external morphology (Figure 2a and b). Some of these crystals were more than 1 μm in length with many showing signs of broken ends (Figure 2c), suggesting that they were originally even longer. Like hemozoin, they also exposed large {100} faces (Figure 2a), but appeared to be thinner.
Figure 2.
β-hematin formed at the interface of pentanol and aqueous citrate buffer, pH 4.8, 37 °C observed using TEM. Crystals were similar or even larger than hemozoin in size (a and b), with evidence of broken ends as shown in the enlargement (c) and marked *. Like hemozoin, they exhibited very regular lattice fringes with a spacing of 11.9 Å, confirming that these crystals tended to lie on their {100} or faces (d) when deposited on the grid for TEM. The electron diffraction pattern from the crystals in (e) is shown in (f) and demonstrates that crystal faces such as that marked * were again normal to a* and were the face.
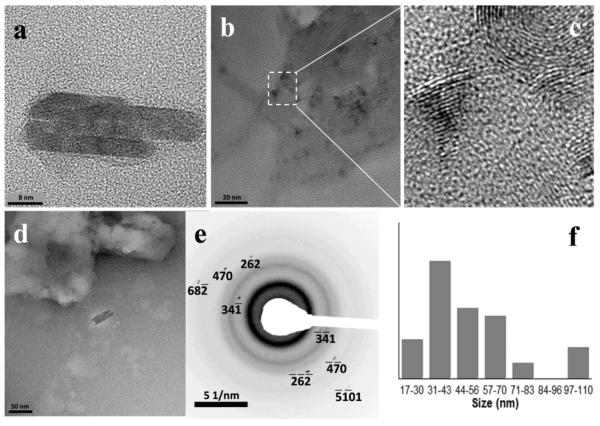
TEM imaging of β-hematin formed using a MPG/Fe(III)PPIX stock solution which was mixed by vortexing lipid and Fe(III)PPIX solutions, both in 1:9 acetone/methanol, showed that the crystals were extremely small, with lengths ranging from 17 – 102 nm and averaging 55 nm (Figure 3a). Most crystals showed regular lath-like shapes, but some were irregular and displayed lattice fringes that exhibited evidence of growth defects or a mosaic structure (Figure 3b and c). Previous studies in our laboratory using bulk material produced in this system have demonstrated that the product is indeed β-hematin by a combination of infrared spectroscopy and X-ray powder diffraction.21 This was further confirmed by observation of electron diffraction spots that coincided with those predicted for β-hematin (Figure 3d and e). However, unlike hemozoin and material from the pentanol/aqueous interface these crystals were found to lie in entirely arbitrary orientations when deposited on the grid and exposed randomly selected diffraction planes to the electron beam. The principal crystallographic axes could not be found, even with a double tilt goniometer stage, probably on account of the very small size of the crystals. The observed distribution of crystal sizes obtained with MPG is shown in Figure 3f and fell in a similar range to the major population of lipid droplets previously reported.21
Figure 3.
β-hematin formed in the presence of MPG dispersed in aqueous citrate buffer, pH 4.8, 37 °C observed using TEM. Lipid and Fe(III)PPIX solutions in 1:9 v/v acetone/methanol were mixed by vortexing. Crystals were very much smaller than hemozoin or β-hematin formed at the pentanol-water interface and were virtually identical whether formed at a lipid to heme ratio of 0.54 (a) or 2.15 (d). Some material (b) exhibited evidence of defects or mosaic structure in the crystal (c). Electron diffraction from crystals in (d) is shown in (e) and indicated that the crystals diffracted electrons from high index planes (in this case ). Distribution in sizes of 43 crystals observed in a lower magnification image indicated that the largest population fell in the range 31 – 43 nm (f).
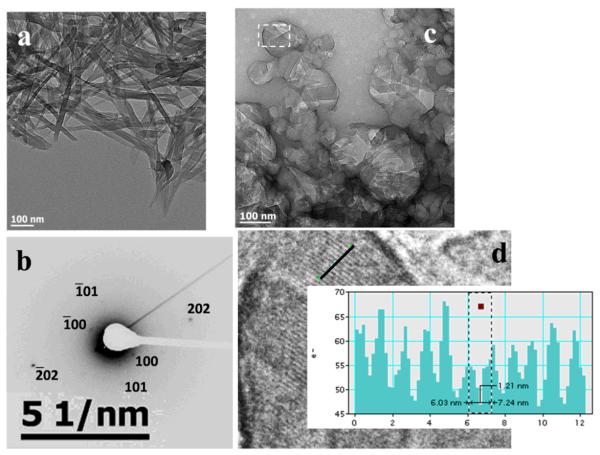
When the MPG and Fe(III)PPIX solutions in 1:9 acetone/methanol were mixed either by “micromixing” with an extruder, or by ultrasonication, the crystals produced were considerably larger (Figure 4a). Electron diffraction showed that isolated crystals tended to lie on their large {100} faces (Figure 4b). Crystals associated with lipid droplets in the sonicated sample (Figure 4c) tended to lie over the lipid droplets on what appeared to be their large {100} faces. Observation of lattice fringes in these images demonstrated that this was indeed the case (Figure 4d). Numerous images showed evidence of very many β-hematin crystals associated with lipid droplets (see also Figure S3).
Figure 4.
Crystals of β-hematin mediated by MPG obtained from “micromixed” MPG and Fe(III)PPIX in 1:9 v/v acetone/methanol showing relatively large crystals (a). Electron diffraction (b) identified these crystals as lying on their {100} faces. MPG droplets with numerous associated β-hematin crystals formed after lipid and Fe(III)PPIX solutions in 1:9 v/v acetone/methanol were pre-mixed by ultrasonication and then dispersed in citrate buffer, pH 4.8 and incubated at 37 °C (c). An enlargement of the region enclosed by the white rectangle showed clear evidence of lattice fringes with a lattice spacing of 12.1 Å, corresponding to the {100} or face of β-hematin (d).
Emulsions prepared from vortexed mixtures of NLB/Fe(III)PPIX solutions in acetone/methanol (1:9) produced by deposition of the lipid/Fe(III)PPIX solution onto the surface of aqueous citrate buffer produced very small β-hematin crystals similar to vortexed MPG/Fe(III)PPIX (Figure 5a). In this case, well-defined lattice fringes could be seen in the TEM and strong diffraction spots were also seen (Figure 5b). This material has also been previously characterized as β-hematin in the bulk by both infrared spectroscopy and powder XRD.22
Figure 5.
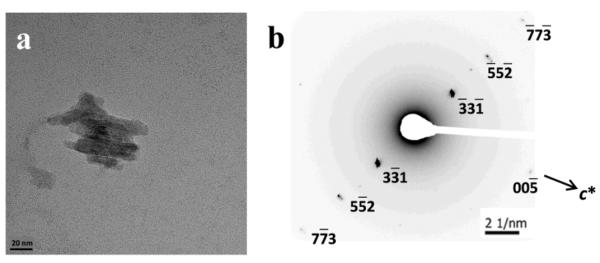
Small β-hematin crystals formed in the presence of NLB dispersed in aqueous citrate buffer, pH 4.8, 37 °C observed using TEM. Lipid and Fe(III)PPIX solutions in 1:9 v/v acetone/methanol were mixed by vortexing (a). In this example electron diffraction was from the (110) planes (b).
When NLB and Fe(III)PPIX solution in acetone and methanol was first mixed by ultrasonication, lipid-associated crystals were observed similar to those with MPG (Figures 6a, S4 and S5). When the NLB and Fe(III)PPIX solutions were thoroughly mixed more gently by “micromixing” through a 10 μm extrusion filter before layering on the aqueous citrate medium, similarly large β-hematin crystals were again observed (Figure 7a). Lattice fringes from β-hematin crystals in Figure 6a again demonstrated that the large faces lying over the lipid droplets were the {100} or faces (Figure 6b). Changing lipid to Fe(III)PPIX ratios from 2.15 to 0.54 were found to have little effect on the size or appearance of β-hematin crystals (Figures 7b – c). Isolated crystals such as those in Figure 7d exhibited electron diffraction patterns showing that they tended to lie on their {100} faces (Figure 7e).
Figure 6.
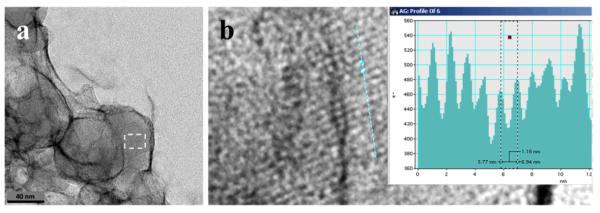
NLB particles with associated β-hematin crystals formed after lipid and Fe(III)PPIX solutions in 1:9 v/v acetone/methanol were pre-mixed by ultrasonication and then dispersed in citrate buffer, pH 4.8 and incubated at 37 °C (a). An enlargement of the region enclosed by the white rectangle showed clear evidence of lattice fringes with a lattice spacing of 11.8 Å, corresponding to the {100} or face of β-hematin (b).
Figure 7.
NLB particles with associated β-hematin crystals formed after lipid and Fe(III)PIX solutions in 1:9 v/v acetone/methanol were pre-mixed by “micromixing” and then dispersed in citrate buffer, pH 4.8 and incubated at 37 °C (example indicated by white arrow). In many cases β-hematin crystals were found to be associated with obvious lipid droplets (a). Crystals of β-hematin formed in the presence of 2.15 (b) or 0.54 (c) equivalents of NLB were similar in size and appearance. Isolated crystals (d) displayed an electron diffraction pattern (e) consistent with the {100} face, similar to hemozoin.
Given the probable role of neutral lipids in hemozoin formation, the NLB system appeared to come closest to mimicking the natural process (provided that the NLB and Fe(III)PPIX solutions were very intimately mixed). This was therefore examined in greater detail.
3.2 Characterization of NLB droplets
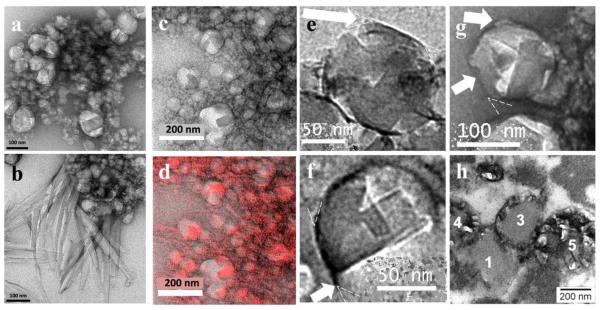
NLB droplets present in the milky emulsion layer formed when acetone/methanol NLB solutions were mixed with aqueous buffer and collected after 10, 30 and 60 minutes of incubation were imaged using TEM. Droplet sizes varied with incubation time, with the population of small particles formed increasing with longer incubation times from 10 to 60 minutes. Images shown in Figure 8 illustrate the appearance of increasing numbers of very small droplets with time. Measurement of droplet sizes (see Figure S6) showed that lipid droplets smaller than 120 nm increased from 21% of the sample at 10 min to 48% at 30 min and 57% at 60 min.
Figure 8.
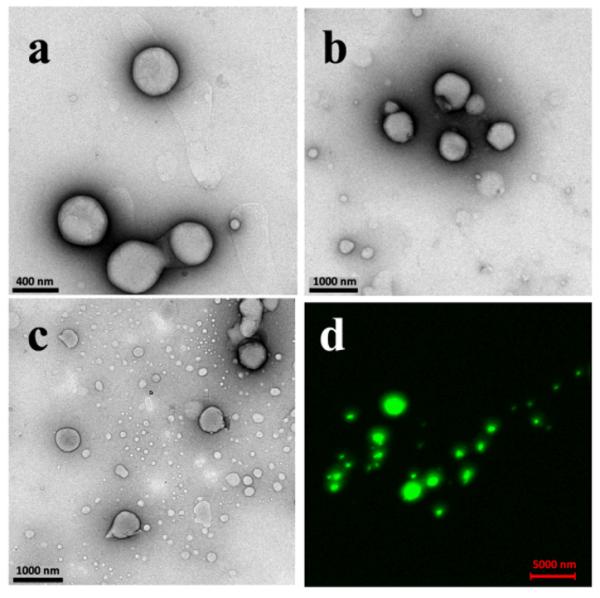
NLB droplets observed 10 (a), 30 (b) and 60 min (c) after mixing with citrate buffer, pH 4.8 at 37 °C to form the emulsion. Numerous very small droplets (<120 nm in diameter) became evident at 30 and especially 60 min. Confocal z-stacked fluorescence microscopy of droplets visible by light microscopy with the lipophilic fluorescent dye DiO are shown in (d).
Further characterization using confocal laser microscopy (CLM) was used to investigate the structure of NLB droplets formed at the lipid-water interface. Emulsions of DiO stained NLB droplets formed by delivery of 1:9 v/v acetone/methanol solutions of lipid onto aqueous citrate were visualized using CLM. Continuous z-stack images taken through the DiO stained NLB droplets showed continuous fluorescence throughout the interior of the NLB droplet as seen in the resultant z-stacked image in Figure 8d. This confirmed previous reports that the interior of the NLB droplets are hydrophobic in nature, continuous and non-hollow.21,22
As further confirmation of the non-hollow structure of the NLB droplets, they were compared with deliberately prepared phospholipid liposomes. These were formed in an aqueous medium doped with CsCl. TEM images of Cs-treated liposomes showed structures with a darker interior (Figure 9a and c) indicating an electron-dense area while Cs-treated NLB showed structures with light interiors of lower electron density than the surrounding medium (Figure 9e). Multilamellar (MLV), small unilamellar (SUV) and large unilamellar vesicles (LUV) could clearly be seen with liposome preparations using both TEM and cryo-TEM (Figures 9a and 9b respectively) while no similar structures could be seen in TEM images of NLB as shown in Figure 9e. The water soluble Cs+ ion distribution in the images was determined using ESI/EELS. The Cs distribution map of Cs-treated liposome structures in Figure 9d showed the presence of Cs inside the liposome as expected, while Cs-treated NLB droplets showed a complete absence of Cs inside lipid droplet structures as clearly seen in Figure 9f. Collectively, these studies unequivocally demonstrated that NLB droplets consist of lipid throughout their interiors and were not hollow water-filled structures like liposomes.
Figure 9.
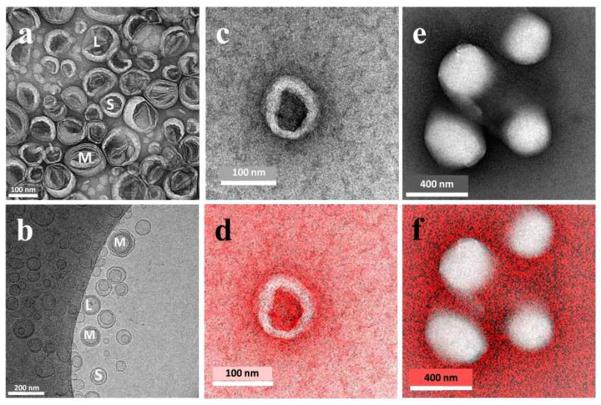
TEM (a) and cryo-TEM (b) images of DMPC liposomes. Both images show examples of large unilamellar vesicles (L), small unilamellar vesicles (S) and multilamellar vesicles (M). Liposomes prepared in the presence of aqueous CsCl such as that in (c) contained Cs+ both in the surrounding medium and within the aqueous interior of the liposome, but not in the lipid membrane, which could be readily visualized by electron energy loss spectroscopy (rendered red in d). By contrast, NLB particles showed no evidence of a liposome-like structure (e) and this was confirmed by the absence of Cs inside the droplet as seen by electron energy loss spectroscopy (f). This unequivocally confirmed that the NLB droplets are non-hollow.
3.3 Visualization of β-hematin formed at the NLB-water interface
Samples taken for TEM during the β-hematin formation process with NLB were carefully removed from the milky layer near the surface of the reaction medium at 10, 30 and 60 min incubation times. A striking feature was the observation of crystals that were associated with nearly all of the observed NLB droplets (Figure 10a). These were observed at all three incubation times. A smaller number of much longer crystals were also observed apparently not directly associated lipid droplets (Figure 10b), but which may have grown from lipid-associated crystals. ESI/EELS analysis of iron distribution confirmed that crystalline material associated with NLB droplets was iron-containing and hence identified these crystals as the β-hematin crystals known to be present in the sample (Figure 10c and d). Careful examination of these images indicates that the crystals lie on the surface of the droplets (Figures 10e – g and S7). A further striking feature of this population of crystals is that they all appear to match the size of the lipid droplet with which they are associated. Lattice fringes showed that the face exposed to the droplet surface was the {100} or face (Figure 6b), an observation also made with MPG droplets (Figure 4b).
Figure 10.
TEM of β-hematin and hemozoin associated with the surface of lipid droplets. In images (a) and (c) numerous β-hematin crystals could be seen associated with NLB droplets, while in (b) longer crystals that may have grown from the lipid-associated crystals could also be seen. Electron spectroscopic imaging revealed the location of Fe in (d), showing that the numerous crystals were all iron-containing, consistent with β-hematin. White arrows in e, f and g point to examples of very thin β-hematin crystals seen edge-on that are clearly at the surfaces of lipid droplets. Dotted wedges represent an angle of 38°, which is close to that between surface crystals and the lipid droplet surface at the ends of most of the crystals. These images are similar to that reported by Corrêa Soares et al. for hemozoin crystals formed on the surface of lipid droplets in Schistosoma mansoni (h). Panel (h) adapted from Corrêa Soares, J. B. R.; Lara, F. A.; Cunha, P. R. B. B.; Atella, G. C.; Maya-Monteiro, C. M.; d'Avila, J. C. P.; Menezes, D.; Vannier-Santos, M.; Oliveira, P. L.; Egan, T. J.; Oliveira, M. F. Extracellular lipid droplets promote hemozoin crystallization in the gut of the blood fluke Schistosoma mansoni. FEBS Lett. 2007, 581, 1742–1750. ©Federation of European Biochemical Societies (2006), with permission from Elsevier.16
Finally, the appearance of these NLB-droplets with associated crystals is remarkably similar to that of previously reported hemozoin crystals associated with lipid droplets in S. mansoni (Figure 10h).16
3.4 Size distribution of NLB particles and β-hematin crystals formed at the lipid-water interface
The sizes of both NLB droplets and β-hematin crystals mediated by NLB at different incubation times were measured. The relative numbers of NLB particles and β-hematin crystals falling into various size ranges formed at 10 min are shown in Figure 11a and b. Both the lipid droplets and β-hematin crystals fell into similar size ranges with two distinct population maxima. In the case of the NLB there was a population of smaller particles with a maximum between 74 and 146 nm and a population of larger droplets with a maximum between 366 and 438 nm. In the case of β-hematin crystals, the distribution of smaller crystals had a maximum between 94 and 140 nm and the larger crystals between 188 and 234 nm. On average, the length of the β-hematin crystals was found to be shorter than the diameter of the lipid droplets, with the average length of β-hematin crystals being 0.62× the average diameter of the lipid droplets (206 versus 331 nm). To test whether the distribution of β-hematin crystal sizes is indicative of growth to 0.62× the diameter of the lipid droplet, a Kolmogorov-Smirnov test was conducted.28 This non-parametric statistical test can be used to determine whether the distribution of data in two different data sets differ significantly. The test compares the cumulative distributions of two data sets. In this case the null hypothesis holds if the cumulative distribution of β-hematin crystal sizes and lipid droplet diameters (× 0.62) are the same at a given significance level. The null hypothesis is rejected if the inequality in equation 1 holds.
| 1 |
The absolute value of the supremum between the two cumulative distributions (Dnn') was found to be 0.1124 (Figure 11c) giving a value for the left hand side of equation 1 of 1.28 which is less than the critical value (Kα) of 1.36 at α = 0.05. Thus the null hypothesis could not be rejected at the α = 0.05 significance level and the distribution of crystal sizes and lipid droplet diameters (×0.62) was deemed statistically equivalent.
Figure 11.

Plots showing the size distributions of NLB particles and β-hematin crystals. The NLB emulsion in (a) was prepared by spreading a solution of “micromixed” NLB in 1:9 v/v acetone/methanol on an aqueous citrate solution, pH 4.8, 37 °C and incubating for 10 min. The milky emulsion layer was then extracted and observed by TEM. The diameters of 309 approximately spherical lipid particles were measured manually. In (b) β-hematin was prepared in the presence of NLB prepared in exactly the same manner, but with Fe(III)PPIX and NLB stock solutions in 1:9 v/v acetone methanol pre-mixed by “micromixing”. Incubation was also for 10 min. Materials containing β-haematin crystals were randomly taken just below the surface of the solution. These were observed by TEM. The lengths of 223 crystals were manually measured. Size distribution is shown in deciles. The cumulative size distribution of the lipid droplets normalized to 0.62× their diameters (solid line) and β-hematin crystals (dotted line) are shown in (c). The cumulative fraction plot was used in the Kolmogorov-Smirnov test comparison and showed that the distributions were statistically indistinguishable, since the null hypothesis cannot be rejected ( which is smaller than the critical value of 1.36 at a significance level of 0.05).
The distributions of sizes were found to be statistically different at 30 and 60 min incubation owing to the very large number of small lipid droplets that appeared at these longer times which were not correlated with smaller β-hematin crystals. In a recent study we have shown that β-hematin formation is completed within less than 10 min in the presence of NLB at the ratios used in this study.23 Since large numbers of very small lipid droplets were only seen in images collected at 30 and 60 min, these presumably formed only after the β-hematin formation process had ended. Thus a size correlation would not be expected.
3.5 Comparison with hemozoin in P. falciparum
Hemozoin crystals in mature trophozoites did not appear to be associated with droplets similar to those seen in Figure 10 despite the use of malachite green staining. Rather, crystals appeared to be aligned, probably in associated with the membrane of the DV. Images could be interpreted as being in agreement with the recent reports by Kapishnikov et al. showing that hemozoin crystals nucleated from the DV membrane on the {100} face of the crystal.19,20 Indeed, angles between the faces of some of the crystals in Figure 12 appeared to suggest that the crystals lay on their {100} faces. In at least one case this could be confirmed by observation of lattice fringes with a spacing of 12.6 Å.
Figure 12.
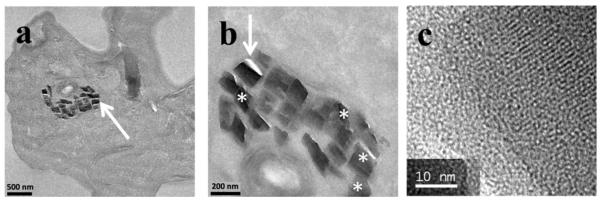
Hemozoin crystals in the digestive vacuole of a mature trophozoite appear to be aligned. An enlargement of (a) shows that many crystals (*) exhibited angles between their edge faces close to 119°, the expected value if the {100} face is exposed. An enlargement of the crystal marked with an arrow showed clear evidence of lattice fringes (c). These exhibited a lattice spacing of 12.6 Å, confirming observation of the {100} face.
4. DISCUSSION
The theoretical growth form of β-hematin was described by Buller et al. as lath-like, extended along the c-axis and exhibiting dominant {100} and {010} side faces with a less-developed slanted {011} end face and a minor {001} face.10 This structural description is consistent with hemozoin crystals from several organisms. β-Hematin crystals formed with NLB prepared by layering either a “micromixed” or ultrasonicated solution of Fe(III)PIX and NLB in 1:9 v/v acetone/methanol on the surface of aqueous citrate, pH 4.8 at 37 °C conformed to this overall shape, although they were considerably thinner than natural hemozoin crystals isolated from the D10 chloroquine-sensitive strain of P. falciparum. Crystallographic characterization from indexed electron diffraction patterns of β-hematin crystals formed with NLB showed diffraction spots and lattice fringes consistent with the {100} face, similar to that of hemozoin crystals isolated from the parasite. These observations of β-hematin crystal growth forms with NLB are consistent with β-hematin and hemozoin crystal growth structures described by other authors.10,15,29 The identical morphology of β-hematin crystals formed at different ratios of lipid to Fe(III)PPIX is a clear indication that the crystal habit of β-hematin does not depend on the ratio of lipid to Fe(III)PPIX present or on the kinetics of crystal growth in this medium.
The observation that the method of mixing lipid and Fe(III)PPIX solutions in acetone/methanol affects the appearance of the crystals was unexpected. Both lipid and Fe(III)PPIX appear to be fully soluble in 1:9 acetone/methanol. It is evident that this is either not the case, or that the lipid and Fe(III)PPIX solutions are not fully miscible. Large lipid associated β-hematin crystals are thus only obtained when these solutions (or suspensions) are very intimately mixed either by “micromixing” with an extruder or by ultrasonication. A possible explanation for this observation is that Fe(III)PPIX which is first dissolved in a minimum volume of 0.1 M NaOH bears a 2– charge. This is then mixed with 1:9 v/v acetone/methanol and may actually result in a transient colloidal suspension which requires through mixing with the lipid solution in order to bring Fe(III)PPIX into intimate contact with the lipid molecules.
An intriguing question is whether the very small crystals seen in the cases where lipid and Fe(III)PPIX solutions were vortexed prior to depositing on the citrate buffer surface were essentially trapped on the pathway to larger structures, possibly having formed from an amorphous precursor. This question cannot be definitively answered from the available data, but several lines of evidence make us suspect that this is probably not the case. Firstly, in a previous study on β-hematin formation at 60 °C in 4.5 M acetate medium, we readily observed conversion from an amorphous glass-like solid which did not exhibit X-ray diffraction peaks, to a microcrystalline solid with a β-hematin X-ray diffraction pattern.30 A similar precursor deposit was not evident in the images seen in the present study, although it could be difficult to observe, especially in the presence of lipid. Secondly, if the precursor does exist, it must be very short lived because previous studies using MPG under conditions where the reaction was slowed down about seven-fold exhibited evidence of β-hematin fluorescence within 10 min.23 Bohle and co-workers have shown that this fluorescence arises from an exciton process specific to the β-hematin crystal lattice.3 Under conditions of the current work, that would translate into appearance of crystals within about 90 s of initiation of the process. This fast rate does not seem consistent with deposition of an amorphous phase and subsequent conversion to the crystalline product. Thirdly, small crystallites such as those seen in Figures 3 and 5 do not appear to be seen in electron micrographs where more thorough premixing was carried out. However, we concede that they may not easily be noticed in the presence of many larger crystals, or they may have all grown larger by the time of measurement.
It is evident from TEM imaging that the sizes of NLB particles in the aqueous emulsion varied with incubation time. The longer the incubation time, ranging from 10 to 60 minutes, the greater the population of very small NLB particles formed. It seems unlikely that these small droplets arose from disintegration of larger droplets, since smaller droplets are thermodynamically less stable than larger ones owing to their greater surface to volume ratio. Rather, it is probable that these small droplets grew by aggregation of even smaller droplets that could not be resolved in the TEM images at earlier times, or even from dispersed lipid molecules which took longer to aggregate. Either way, they came to dominate the emulsion over time. However, since they appeared to form only after β-hematin, they probably played no role in its formation.
Visualization by confocal laser microscopy of fluorescence arising from continuous z-stacked images taken from NLB emulsions stained with lipophilic DiO dye showed continuous fluorescence throughout the interior of NLB droplets. This continuous fluorescence suggested that the interiors of NLB droplets were completely hydrophobic and that they were not hollow water-filled vesicles. This is in agreement with a study that has shown orthogonal projections of spontaneously formed spherical NLB droplets to have continuous non-hollow interiors using the lipophilic fluorophore Nile Red.21,22 Aqueous Cs-treated liposomes and NLB droplets imaged using TEM showed contrasting structures for each preparation. TEM imaging showed that NLB droplets were neither multilamellar nor unilamellar. Based on ESI/EELS analysis of Cs distribution in Cs+-treated NLB and liposomes, the complete absence of Cs+ inside NLB droplets confirmed that the interior part of NLB droplets indeed was devoid of aqueous solution and therefore they were definitively continuous throughout their interiors. By contrast, liposomes exhibited a strong Cs signal from the aqueous interior space of the membrane-bounded vesicle which was readily observed, while only the membrane was devoid of Cs+.
Observation of β-hematin crystals formed at either the MPG-water or the NLB-water interface using TEM showed that the vast majority of β-hematin crystals were seen to be in contact with lipid droplets. Indeed, nearly every droplet observed in the emulsion had several crystals associated with it. In many images it was difficult to directly discern whether the crystals were on the surface, or within the droplets. However, in a number of cases where crystals could fortuitously be seen edge-on it was clearly evident that they lay at the surface of the droplets. We therefore concluded that β-hematin crystals most likely all lay at the surfaces of the droplets. Almost invariably, the large prominent faces of crystals were the ones seen in association with the droplets. Lattice fringes and diffraction patterns of β-hematin crystals formed with both MPG and NLB showed that these prominent faces were the {100} or faces. We could therefore conclude that these are the faces that make contact with the lipid surface. This observation itself does not necessarily imply that the crystals nucleated from these faces or even grew with these faces in contact with the lipid. It is quite possible that the crystals could have nucleated from a different face and then subsequently interacted with the lipid. Such an interaction might be expected to occur via these faces simply because they are the largest. Even the match between crystal and lipid droplet sizes seen in Figures 7 and 10 could have arisen from lipid associating with these large crystal faces after formation of β-hematin. However, the observation that crystal lengths correlate with the diameters of lipid droplets formed totally independently of Fe(III)PPIX (Figure 11) is difficult to explain unless one of the faces incorporating the long axis of the crystal ({100}, , {010} or ) was in contact with the lipid face during crystal growth. Given the near match between β-hematin propionic acid groups and glycerol head groups as well as the previous observation of nucleation from the {100} face in the case of self-assembled monolayers (SAMs) with –OH head groups,31 we suspect this would more likely be the {100} face, although we emphasize that it remains unproven. This idea is consistent with the proposal that the neutral lipid surface acts as a template for the growth of β-hematin (Figure 13a and b),21,32 a suggestion that has been made previously on the basis of findings obtained with SAMs.31–33
Figure 13.
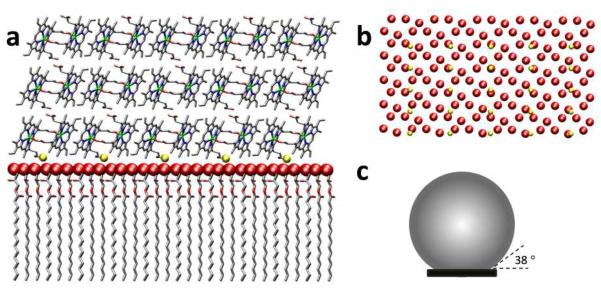
A molecular graphics representation of templated growth of β-hematin at the surface of a droplet of MPG (a and b). The structure of the MPG surface is based on the 2D unit cell of a monolayer of monomyristoylglycerol (MMG) observed at the air-water interface in a previous study by grazing incidence X-ray diffraction and specular X-ray reflectivity.31 Panel (b) shows the near match between positions of β-hematin propionic acid groups at the {100} surface of the crystal (rendered in gold) and every third glycerol −OH group of MPG (red). The size of β-hematin crystals relative to lipid droplets found in this study is shown in (c). Assuming a spherical droplet, the angle between the end of the β-hematin crystal and the surface of the droplet was 38°. This is close to the angles observed in a several TEM images (see Figure 10).
The correlation in size of both NLB droplets and β-hematin crystals formed at the NLB lipid-water interface, coupled with the location of these β-hematin crystals on the surface of NLB droplets both in vitro (and in vivo in the case of S. mansoni),15,16 strongly suggests that the size of β-hematin/hemozoin crystals is controlled by the size of NLB droplets. Indeed, the observation that the crystals apparently grew to a maximum length of 0.62× the lipid droplet diameter suggests that the maximum angle subtended between the lipid surface (assuming a spherical structure) and β-hematin crystal is 38°, similar to that observed in images shown in Figure 10. Presumably the interaction between β-hematin and lipid is exceeded by the surface tension after this and contact can no longer be sustained between crystal and lipid, preventing further growth as shown schematically in Figure 13c.
The idea that the lipid droplet size controls the size of the β-hematin crystals was further supported by observation of extremely long β-hematin crystals formed at the interface of pentanol and aqueous solution. Indeed, β-hematin crystals isolated from the pentanol-aqueous interface were in many cases larger than hemozoin crystals from P. falciparum and exhibited broken ends, suggesting that they were even longer prior to centrifugation. These long crystals may arise as a result of the essentially infinite flat interface formed between pentanol and water which offers little or no restriction to crystal growth unlike the strongly curved surfaces of NLB droplets. The relatively large size of hemozoin crystals from P. falciparum could be related in this model to the large, gently curving interior surface of the DV which evidently nucleates the crystals. This is consistent with the recent report of aligned crystals in the parasite digestive vacuole and indeed observations of hemozoin crystals in our study also appeared to support an association with the digestive vacuole inner membrane.19,20 In fact, in the case of flat or gently curved systems such as pentanol/water or the P. falciparum digestive vacuole, the growth of β-hematin may be limited not by curvature of the template surface, but rather by the presence of small amounts of the non-centrosymmetric isomer of the μ-propionato dimer of Fe(III)PPIX which acts as an inhibitor of β-hematin formation as originally suggested by Buller et al.10
5. CONCLUSION
This study has shown that β-hematin crystals formed with NLB at the lipid-water interface under physiological conditions of temperature and pH are structurally identical to hemozoin crystals from the malaria parasite. The habit of β-hematin crystals formed under these conditions is unaffected by lipid to Fe(III)PPIX ratios. The NLB droplets are non-hollow structures with no lipid bilayer membrane and with interiors that are completely hydrophobic. The β-hematin crystals appear to be found at the surface of these droplets, with the {100} face in contact with the lipid surface. This is consistent with the templated nucleation model proposed for hemozoin formation in P. falciparum, although in the latter case recent evidence points to formation at the inner surface of the parasite digestive vacuole membrane. Indeed, the synthetic system seems to mimic the process in S. mansoni more closely. Finally, observation of numerous images showed that crystal size appears to be strongly controlled by the size of the lipid droplets at least in the case of small lipid-associated crystals. Indeed, at short incubation times, the size of these crystals is statistically correlated with the lipid droplets.
Supplementary Material
ACKNOWLEDGEMENTS
We acknowledge support from the NIH (R01AI083145) for this work. We thank Mr David Kuter for preparing Figure 13a and b. We also thank Mr Mohamed Jaffer for cutting sections of the parasites.
Footnotes
The authors declare no competing financial interest.
SUPPORTING INFORMATION AVAILABLE TEM images of hemozoin, an electron diffraction pattern of hemozoin, distribution of hemozoin crystal sizes, MPG and NLB lipid droplets with associated β-hematin crystals, distribution of NLB particle sizes as a function of time and β-hematin crystals on the surfaces of NLB droplets. This information is available free of charge via the Internet at http://pubs.acs.org/.
REFERENCES
- (1).Pagola S, Stephens PW, Bohle DS, Kosar AD, Madsen SK. Nature. 2000;404:307–310. doi: 10.1038/35005132. [DOI] [PubMed] [Google Scholar]
- (2).Klonis N, Dilanian R, Hanssen E, Darmanin C, Streltsov V, Deed S, Quiney H, Tilley L. Biochemistry. 2010;49:6804–6811. doi: 10.1021/bi100567j. [DOI] [PubMed] [Google Scholar]
- (3).Bellemare M-J, Bohle DS, Brosseau C-N, Georges E, Godbout M, Kelly J, Leimanis ML, Leonelli R, Olivier M, Smilkstein M. J. Phys. Chem. B. 2009;113:8391–8401. doi: 10.1021/jp8104375. [DOI] [PubMed] [Google Scholar]
- (4).Egan TJ, Combrinck JM, Egan J, Hearne GR, Marques HM, Ntenteni S, Sewell BT, Smith PJ, Taylor D, van Schalkwyk DA, Walden JC. Biochem. J. 2002;365:343–347. doi: 10.1042/BJ20020793. [DOI] [PMC free article] [PubMed] [Google Scholar]
- (5).Chen MM, Shi L, Sullivan DJ. Mol. Biochem. Parasitol. 2001;113:1–8. doi: 10.1016/s0166-6851(00)00365-0. [DOI] [PubMed] [Google Scholar]
- (6).Oliveira MF, Silva JR, Dansa-Petretski M, de Souza W, Lins U, Braga CMS, Masuda H, Oliveira PL. Nature. 1999;400:517–518. doi: 10.1038/22910. [DOI] [PubMed] [Google Scholar]
- (7).Slater AFG, Cerami A. Nature. 1992;355:167–169. doi: 10.1038/355167a0. [DOI] [PubMed] [Google Scholar]
- (8).Egan TJ, Ross DC, Adams PA. FEBS Lett. 1994;352:54–57. doi: 10.1016/0014-5793(94)00921-x. [DOI] [PubMed] [Google Scholar]
- (9).Combrinck JM, Mabotha TE, Ncokazi KK, Ambele MA, Taylor D, Smith PJ, Hoppe HC, Egan TJ. ACS Chem. Biol. 2013;8:133–137. doi: 10.1021/cb300454t. [DOI] [PMC free article] [PubMed] [Google Scholar]
- (10).Buller R, Peterson ML, Almarsson Ö, Leiserowitz L. Cryst. Growth Des. 2002;2:553–562. [Google Scholar]
- (11).Sullivan DJ, Gluzman IY, Goldberg DE. Science. 1996;271:219–222. doi: 10.1126/science.271.5246.219. [DOI] [PubMed] [Google Scholar]
- (12).Bendrat K, Berger BJ, Cerami A. Nature. 1995;378:138–139. doi: 10.1038/378138a0. [DOI] [PubMed] [Google Scholar]
- (13).Jani D, Nagarkatti R, Beatty W, Angel R, Slebodnick C, Andersen J, Kumar S, Rathore D. PLOS Pathogens. 2008;4:e1000053. doi: 10.1371/journal.ppat.1000053. [DOI] [PMC free article] [PubMed] [Google Scholar]
- (14).Chugh M, Sundararaman V, Kumar S, Reddy VS, Siddiqui WA, Stuart KD, Malhotra P. Proc. Natl. Acad. Sci. USA. 2013;110:5392–5397. doi: 10.1073/pnas.1218412110. [DOI] [PMC free article] [PubMed] [Google Scholar]
- (15).Oliveira MF, Kycia S, Gonzales A, Kosar AD, Bohle DS, Hempelmann E, Menezes D, Vannier-Santos M, Oliveira PL, Ferreira ST. FEBS Lett. 2005;579:6010–6016. doi: 10.1016/j.febslet.2005.09.035. [DOI] [PubMed] [Google Scholar]
- (16).Corrêa Soares JBR, Lara FA, Cunha PRBB, Atella GC, Maya-Monteiro CM, d'Avila JCP, Menezes D, Vannier-Santos M, Oliveira PL, Egan TJ, Oliveira MF. FEBS Lett. 2007;581:1742–1750. doi: 10.1016/j.febslet.2007.03.054. [DOI] [PubMed] [Google Scholar]
- (17).Jackson KE, Klonis N, Ferguson DJP, Adisa A, Dogovski C, Tilley L. Mol. Microbiol. 2004;54:109–122. doi: 10.1111/j.1365-2958.2004.04284.x. [DOI] [PubMed] [Google Scholar]
- (18).Pisciotta JM, Coppens I, Tripathi AK, Scholl PF, Shuman J, Bajad S, Shulaev V, Sullivan DJ. Biochem. J. 2007;402:197–204. doi: 10.1042/BJ20060986. [DOI] [PMC free article] [PubMed] [Google Scholar]
- (19).Kapishnikov S, Berthing T, Hviid L, Dierolf M, Menzel A, Pfeiffer F, Als-Nielsen J, Leiserowitz L. Proc. Natl. Acad. Sci. USA. 2012;109:11184–11187. doi: 10.1073/pnas.1118134109. [DOI] [PMC free article] [PubMed] [Google Scholar]
- (20).Kapishnikov S, Weiner A, Shimoni E, Guttmann P, Schneider G, Dahan-Pasternak N, Dzikowski R, Leiserowitz L, Elbaum M. Proc. Natl. Acad. Sci. USA. 2012;109:11188–11193. doi: 10.1073/pnas.1118120109. [DOI] [PMC free article] [PubMed] [Google Scholar]
- (21).Hoang AN, Ncokazi KK, de Villiers KA, Wright DW, Egan TJ. Dalton Trans. 2010;39:1235–1244. doi: 10.1039/b914359a. [DOI] [PMC free article] [PubMed] [Google Scholar]
- (22).Hoang AN, Sandlin RD, Omar A, Egan TJ, Wright DW. Biochemistry. 2010;49:10107–10116. doi: 10.1021/bi101397u. [DOI] [PMC free article] [PubMed] [Google Scholar]
- (23).Ambele MA, Egan TJ. Malar. J. 2012;11:337. doi: 10.1186/1475-2875-11-337. [DOI] [PMC free article] [PubMed] [Google Scholar]
- (24).Egan TJ, Chen JY-J, de Villiers KA, Mabotha TE, Naidoo KJ, Ncokazi KK, Langford SJ, McNaughton D, Pandiancherri S, Wood BR. FEBS Lett. 2006;580:5105–5110. doi: 10.1016/j.febslet.2006.08.043. [DOI] [PubMed] [Google Scholar]
- (25).CrystalMaker® version 2.2. CrystalMaker Software Ltd; Oxford, England: 2009. [Google Scholar]
- (26).Trager W, Jensen JB. Science. 1976;193:673–675. doi: 10.1126/science.781840. [DOI] [PubMed] [Google Scholar]
- (27).Saliba KJ, Folb PI, Smith PJ. Biochem. Pharmacol. 1998;56:313–320. doi: 10.1016/s0006-2952(98)00140-3. [DOI] [PubMed] [Google Scholar]
- (28).Massey FJ., Jr J. Am. Stat. Assoc. 1951;46:68–78. [Google Scholar]
- (29).Noland GS, Briones N, Sullivan DJ. Mol. Biochem. Parasitol. 2003;130:91–99. doi: 10.1016/s0166-6851(03)00163-4. [DOI] [PubMed] [Google Scholar]
- (30).Egan TJ, Mavuso WW, Ncokazi KK. Biochemistry. 2001;40:204–213. doi: 10.1021/bi0013501. [DOI] [PubMed] [Google Scholar]
- (31).de Villiers KA, Osipova M, Mabotha TE, Solomonov I, Feldman Y, Kjaer K, Weissbuch I, Egan TJ, Leiserowitz L. Cryst. Growth Des. 2009;9:626–632. [Google Scholar]
- (32).Solomonov I, Osipova M, Feldman Y, Baehtz C, Kjaer K, Robinson IK, Webster GT, McNaughton D, Wood BR, Weissbuch I, Leiserowitz L. J. Am. Chem. Soc. 2007;129:2615–2627. doi: 10.1021/ja0674183. [DOI] [PubMed] [Google Scholar]
- (33).Wang X, Ingall E, Lai B, Stack AG. Cryst. Growth Des. 2010;10:798–805. [Google Scholar]
Associated Data
This section collects any data citations, data availability statements, or supplementary materials included in this article.


