

Abstract
Lymphotactin, the sole identified member of the C class of chemokines, specifically attracts T lymphocytes and natural killer cells. This 93-residue protein lacks 2 of the 4 conserved cysteine residues characteristic of the other 3 classes of chemokines and possesses an extended carboxyl terminus, which is required for chemotactic activity. We have determined the three-dimensional solution structure of recombinant human lymphotactin by NMR spectroscopy. Under the conditions used for the structure determination, lymphotactin was predominantly monomeric; however, pulsed field gradient NMR self-diffusion measurements and analytical ultracentrifugation revealed evidence of dimer formation. Sequence-specific chemical shift assignments were determined through analysis of two- and three-dimensional NMR spectra of 15N- and 13C/15N-enriched protein samples. Input for the torsion angle dynamics calculations used in determining the structure included 1258 unique NOE-derived distance constraints and 60 dihedral angle constraints obtained from chemical-shift-based searching of a protein conformational database. The ensemble of 20 structures chosen to represent the structure had backbone and heavy atom rms deviations of 0.46 ± 0.11 and 1.02 ± 0.14 Å, respectively. The results revealed that human lymphotactin adopts the conserved chemokine fold, which is characterized by a three-stranded antiparallel β-sheet and a C-terminal α-helix. Two regions are dynamically disordered as evidenced by 1H and 13C chemical shifts and {15N}-1H NOEs: residues 1–9 of the amino terminus and residues 69±93 of the C-terminal extension. A functional role for the C-terminal extension, which is unique to lymphotactin, remains to be elucidated.
Chemokines (chemotactic cytokines) are small, soluble proteins that play important roles in regulating leukocyte trafficking. They act primarily through high-affinity interactions with seven-transmembrane G-protein coupled receptors (1, 2). To stimulate migration of target cells, a gradient of increasing chemokine concentration is thought to arise through the binding of chemokines to cell-surface glycosaminoglycans (GAGs)1 (3, 4). These interactions may also promote chemokine oligomerization in some cases (5). The general degree to which GAG binding and chemokine aggregation are involved in receptor activation is unclear. A subset of chemokine receptors has been implicated as coreceptors for HIV entry into cells, and the cognate chemokine ligands have been found to inhibit HIV infection (6–12).
On the basis of the number and relative positions of their conserved cysteine residues, chemokines are divided into four classes: CXC, CC, C, and CX3C. Each class shows distinct specificity for the general cell types that they chemoattract. CXC chemokines containing the ELR sequence motif specifically chemoattract neutrophils, whereas those without the ELR motif are chemotactic for T and B cells. Among the cytokines, CC chemokines exhibit the widest range of target cell specificity, although they act preferentially on monocytes. This class includes chemotactic effectors for most leukocyte cell types except neutrophils (1). The single known member of the CX3C class, fractalkine, has potent chemoattractant activities for T cells, monocytes, and natural killer (NK) cells (13).
The structures of more than 20 chemokine have been solved (14–29); these reveal a highly conserved chemokine fold, which consists of a 3-stranded, antiparallel β-sheet and a C-terminal α-helix. Most CXC and CC chemokines form dimers, but the dimer interfaces of these two classes are distinctly different (30). Fractalkine and a few of the CXC and CC chemokines are monomeric (22, 26, 27, 29).
Lymphotactin (Ltn), the sole member of the C class of chemokines, is specific for T lymphocytes and NK cells (31–33). In contrast to all other chemokines, Ltn contains only 1 disulfide bond, and its sequence contains an extension of about 25 amino acid residues at the carboxyl terminus. The C-terminal extension of Ltn is conserved across species (mouse, human, rat, and rhesus), as shown in Figure 1 (34), and truncation of the C-terminus by 21 residues abolishes the Ca2+-flux and chemotaxis activities of hLtn (33, 35).
Figure 1.
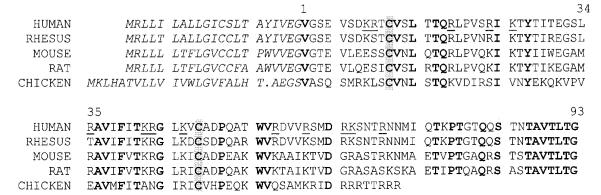
Multiple sequence alignment for lymphotactins from various species. Sequences for human (GenBank accession no. AAC50164), rhesus (M. Kitabwalla and C. D. Pauza, unpublished results), mouse (AAA56752), rat (AAA69478), and chicken (AAB99904) were aligned with the program GCG. The N-terminal signal sequence which is removed posttranslationally is shown in italics. Residue numbering is for the mature extracellular species. Residues which are absolutely conserved across the five known species are in boldface type, and conserved basic residues are underlined in the human sequence.
To provide a basis for understanding the functional significance of its unique sequence elements, we have investigated the structure and association state of human lymphotactin (hLtn) by NMR spectroscopy and analytical ultracentrifugation. We present the complete nuclear magnetic resonance assignments and solution structure of hLtn. Pulsed field gradient (PFG) self-diffusion and sedimentation equilibrium measurements showed that hLtn forms dimers. Like all other chemokines, hLtn adopts a fold consisting of a three-stranded β-sheet and C-terminal α-helix. The unique C-terminal extension is completely unstructured. Examination of this structure reveals differences that are related to the disulfide bridge that Ltn lacks compared to chemokines of the other classes.
MATERIALS AND METHODS
Plasmids, Enzymes, and Chemicals
Commercial sources for reagents were the following: Fisher Scientific (Pittsburgh, PA) for HPLC-grade acetonitrile; Isotec (Miamisburg, OH) for 15NH4Cl and [13C]glucose; Novagen (Madison, WI) for plasmids (pET-3a, pET-9a, pET-16a, pET-22b), bacterial strains [HMS174 and BL21(DE3)pLysS], and the factor Xa cleavage and arrest kit; Promega (Madison, WI) for restriction enzymes (NdeI and BamHI) and T4 DNA ligase; Sigma-Aldrich (St. Louis, MO) for dithiothreitol and guanidinium chloride; and Stratagene (La Jolla, CA) for Pfu DNA polymerase. Oligonucleotides coding for the hLtn gene sequence were chemically synthesized at the University of Utah; shorter DNA oligonucleotides used as primers in cloning reactions were synthesized at the University of Wisconsin–Madison Biotechnology Center.
Cloning
The GCG program [Wisconsin Package Version 9.0, Genetics Computer Group (GCG), Madison, WI] was used to design an artificial gene sequence, based on the published sequence for the mature hLtn gene (GenBank accession no. U23772), optimized for expression in Escherichia coli (E. coli). This gene was synthesized as two, 150-base oligonucleotides with a central overlapping sequence of 27 base pairs. PCR amplification with secondary primers was used to generate the 300 base pair full-length hLtn gene with NdeI and BamHI sites at the 5′ and 3′ ends, respectively, to facilitate insertion of the gene into the pET vector system. The gene was subcloned into the various pET bacterial expression vectors, either by itself or as a fusion with a (His)6 tag or signal peptidase sequence. All plasmids were verified by DNA sequencing. However, none of these plasmids expressed detectable amounts of hLtn (by SDS–PAGE analysis). An alternative strategy, which proved successful, was to clone the synthetic hLtn gene into a pET-3a vector as a fusion with staphylococcal nuclease (SNase) (36); a factor Xa cleavage site was inserted between the SNase and hLtn genes to provide a means for cleaving the SNase-hLtn fusion protein. The expression plasmid, which was called pET-3a SNase-Xa-hLtn, was then transformed into E. coli strain BL21(DE3)pLysS.
Protein Expression, Purification, and Refolding
Cells were grown at 37 °C in LB medium containing 100 μg/mL ampicillin and 34 μg/mL chloramphenicol until the cell density reached OD600 = 0.8–1.0. At that point, protein expression was induced by the addition of isopropyl β-d-thiogalactopyranoside (IPTG) to a final concentration of 1 mM. Following induction, cells were grown for another 3–5 h, harvested, and stored at −20 °C until processed further. For uniform labeling with 15N and 13C, cells were grown in M9 minimal media containing [13C]glucose (2 g/L) and [15N]-ammonium chloride (1 g/L) as the respective sole carbon and nitrogen sources.
Analysis of the cell lysate by SDS–PAGE on 16% Tris–glycine precast gels (Novex, San Diego, CA) showed that more than 80% of the fusion protein was expressed in the form of inclusion bodies. Initial attempts to purify hLtn from the soluble fraction were unsuccessful. The following procedure was used to isolate and purify the protein from inclusion bodies: Cell paste from a 1–2 L culture was suspended in 50 mL of lysis buffer (50 mM Tris-HCl, pH 8.0, 50 mM sodium chloride, 50 mM PMSF, 2 mM EDTA) and lysed by multiple freeze/thaw cycles. The SNase in the fusion protein was activated by the addition of CaCl2 to a final concentration of 10 mM; this catalyzed the digestion of DNA and RNA in the lysate and reduced its viscosity. The lysate was then stirred at room temperature for about 20 min or until no longer viscous. Inclusion bodies were isolated by centrifugation at 20000g for 15 min in a JLA-16.250 rotor (Beckman, Palo Atlo, CA). The supernatant was decanted and discarded, and the pellet, which contained the inclusion bodies, was washed once with 50 mL of lysis buffer, once with 50 mL of lysis buffer containing 0.5% Triton-X100, and again with 50 mL of lysis buffer. The inclusion bodies were solubilized, and disulfide bonds were reduced by the addition of 30–50 mL of solubilization buffer (7 M guanidinium chloride, 40 mM Tris-HCl, pH 7.4, 20 mM EDTA, 50 mM DTT) followed by stirring at room temperature for 2–3 h. The denaturant and reducing agent were removed by dialysis against 12 L of 20 mM acetic acid solution, repeated twice for 12 h. The resulting solution was clarified by centrifugation at 20000g for 20 min. The supernatant was added dropwise into oxidation buffer (200 mM Tris–acetate, pH 8.0, 25 μM 2-mercaptoethanol). To prevent aggregation due to intermolecular disulfide formation, the protein concentration was kept below 0.3 mg/mL. Oxidation was carried out with stirring at 4 °C for about 16 h. The oxidized fusion protein was concentrated to ~10 mL in an Amicon (Beverly, MA) stirred-cell ultrafiltration concentrator using a 3000 Da molecular mass cutoff membrane (Millipore, Bedford, MA). To remove the oxidation buffer, the concentrated fusion protein was washed 3 times with 50 mL of deionized water. An appropriate amount of 10× cleavage buffer stock solution (0.5 M Tris-HCl, pH 8.0, 1 M NaCl, 10 mM CaCl2) was then mixed with the concentrated fusion protein solution. The factor Xa cleavage reaction was optimized by treating varying amounts of fusion protein (5–10 mg/mL) with varying amounts of factor Xa (1–2 units). Although cleavage proceeded faster at higher concentrations (2 units of factor Xa/10 mg fusion at 10 mg/mL concentration) at room temperature, lower overall yields of hLtn were obtained due to nonspecific digestion of fusion protein. Subsequent cleavage reactions were carried out at 4 °C using 1 unit of enzyme for 10 mg of fusion protein at 5 mg/mL concentration for 1–2 days, or until the reaction was nearly complete. The hLtn product was separated from SNase by reversed-phase HPLC on a C18 column (Vydac, Hesperia, CA).
Sedimentation Equilibrium Studies
Sedimentation equilibrium studies were conducted in a Beckman XL-A Analytical Ultracentrifuge. Samples with initial concentrations of 235, 100, and 36 μM were prepared by dissolving appropriate amounts of hLtn in a buffer consisting of 20 mM sodium phosphate, 200 mM NaCl, pH 6.0. The samples were placed in separate Biodialyzers (Sialomed Inc., Columbia, MD) with 1000 Da cutoff membrane, and dialyzed simultaneously against 500 mL of the buffer overnight at 4 °C. The centrifuge cell centerpieces were double-sector charcoal-filled Epon (12 mm path length for the lowest concentration, 3 mm for the others), and dialysate was used in the reference sector. Equilibrium data were collected at 20 000, 26 000, 36 000, and 42 000 rpm at 10 °C. Concentration gradients were monitored by the absorbance at 280 nm with superimposable gradients recorded 2–4 h apart used as the criterion that equilibrium had been reached. At 26 000 rpm, the gradient was monitored for more than 12 h after equilibration and found to be stable. Integration of the concentration gradients showed no significant loss of protein during the experiment. High-speed sedimentation was used to deplete protein from the centrifuge cell and to measure the amount of nonsedimenting absorbance in each cell (<0.006).
The molecular weight of hLtn was calculated from the sequence to be 10 254. The partial specific volume was calculated to be 0.735 mL/g. The extinction coefficient was calculated as 7115 M−1 cm−1 using the extinctions for Trp, Tyr, and cystine in Pace and Schmid (37). The solvent density was measured at 10 °C with an Anton Paar DMA5000 to be 1.01 g/mL.
Data were analyzed using programs written by Darrell R. McCaslin in the Igor Pro Data Analysis Program (Wavemetrics Inc., Lake Oswego, OR). Prior to analysis, all data sets were corrected for the amount of nonsedimenting absorbance measured after high-speed depletion of the protein, and the data from the lowest concentration of hLtn were normalized to a 3 mm path length for global fitting purposes. All data sets (three concentrations each at four speeds) were fit simultaneously to various models in a manner analogous to that discussed by Laue (38). Models included single species, two and three species in equilibrium, and two independent noninteracting species.
Diffusion Coefficient Measurements
A water-suppressed longitudinal encode–decode (Water-SLED) experiment (39) was used for measurements of translational self-diffusion coefficients at 600 MHz. All proteins were dissolved in 20 mM sodium phosphate buffer, pH 6.0, containing 0.05% sodium azide and 200 mM sodium chloride. All measurements utilized a 30.5 G/cm Z-gradient and were carried out at 10 °C. The gradient duration was incremented by 0.5 ms from 0.5 to 6.5 ms. One percent cyclodextrin dissolved in 90% H2O/10% D2O, which has a diffusion coefficient of 3.239 × 106 cm2/s at 25 °C (40), served as the standard sample for calibration of gradient strength. Self-diffusion coefficients were obtained by nonlinear least-squares fits to the following equation:
| (1) |
where γ is the magnetogyric ratio of 1H, G is the gradient strength (G/cm), δ is the pulsed field gradient (PFG) duration (s), and Δ is the time between the gradient pulses.
NMR Spectroscopy
NMR experiments were carried out at the National Magnetic Resonance Facility at Madison (NMRFAM) on Bruker DMX600 and Bruker DMX750 spectrometers equipped with three-axis gradient triple-resonance probes. All NMR samples were prepared either in 90% H2O/10% D2O or in 100% D2O containing 20 mM sodium phoshate (pH 6.0), 0.05% sodium azide, 200 mM sodium chloride. Samples for NMR spectroscopy contained 0.5–1.3 mM hLtn and were placed in Shigemi (Tokyo, Japan) microcells. Heteronuclear NOEs were measured from an interleaved pair of 2D 15N-1H gradient sensitivity enhanced correlation spectra of hLtn (41). NOEs were calculated as the ratios of the peak heights in spectra recorded with and without a 3 s proton saturation period. The total recycle delay was 5 s.
The following experiments were used for obtaining complete sequence-specific resonance assignments and the NOEs used in the structure calculations: 3D SE HNCA (42–44), 3D SE HN(CO)CA (44), 3D SE C(CO)NH (45), 3D SE HNCO (43, 44), 3D 15N NOESY–HSQC (46), 3D 15N TOCSY–HSQC (46), 3D HCCH–TOCSY (47), 2D 15N HSQC (46), 2D 13C constant-time SE HSQC (48), 2D NOESY, and 3D 13C SE NOESY–HSQC. A pair of 2D 13C-1H spin–echo difference CT-HSQC experiments (JCC and JNC) were used to obtain stereospecific assignments of Val Cγ methyl groups (49, 50). All NOESY mixing times were 80 ms. NMR data were processed with the NMRPipe software package (51) on personal computers running the Linux operating system. Chemical shifts were referenced to internal DSS (taken as 0 ppm) as described by Markley et al. (52). The XEASY software package (53) was used for resonance assignments and analysis of NOE spectra. The CSI program was used for determining the secondary structure from the chemical shift index (54, 55).
Structure Calculation and Analysis
The simulated annealing protocol of the torsion angle dynamics program DYANA (56) was used in calculating all structures. In preliminary rounds of structure calculations, 8000 dynamics steps were used in calculating each of 50 conformers; in the final round of calculations, 10 000 dynamics steps were used. NOE intensities were converted into upper distance bounds with the CALIBA function of DYANA. To account for disparities in line widths and peak intensities, separate NOE calibrations were performed for residues of the structured and unstructured regions (residues 1–9 and 69–93). The ASSIGN function of DYANA was utilized for automated assignment of NOEs on the basis of chemical shifts and initial structures. Additional NOE constraints were added in each round of calculations, and restraints that were consistently violated were removed. In addition to NOE restraints, a total of 60 ϕ and ψ dihedral angle constraints were generated from 1Hα, 13Cα, 13Cβ, 13C’, and 15N secondary shifts by the program TALOS and included in the later rounds of refinement (57). Of the final 50 structures calculated, the 20 conformers with the lowest target function values were selected for analysis. The mean structure, calculated from this ensemble of 20 structures in MOLMOL (58), was minimized in DYANA using 300 steps of variable target function minimization.
RESULTS
Protein Expression and Purification
Human lymphotactin was produced successfully from E. coli as a fusion protein with SNase. SDS–PAGE analysis indicated that more than 80% of the fusion protein was localized in the insoluble fraction. Protein isolated from inclusion bodies was purified as described above. The natural precursor form of lymphotactin contains an N-terminal signal sequence, which is removed in the mature secreted protein (32). A sequence identical to this mature 93 amino acid species (hLtn) was produced by proteolysis of the recombinant fusion protein catalyzed by factor Xa. The hLtn product was separated from intact fusion protein and SNase by reverse-phase HPLC. The identity of the purified protein (>95% pure) was confirmed by mass spectrometry. Biological activity was confirmed in a Ca2+-flux assay performed as described previously (data not shown) (35). Typical yields from a 1 L culture ranged from 3 to 6 mg. Purified hLtn was lyophilized and dissolved directly in NMR buffer.
Choice of Conditions for Structural Analysis
Two-dimensional 1H-15N HSQC spectra were acquired at various temperatures and ionic strengths to determine appropriate conditions for structure determination. These studies indicated that hLtn exhibits conformational heterogeneity at some combinations of temperature and ionic strength. A similar temperature effect on NMR spectra of hLtn has been reported by others (35). The 1H-15N HSQC spectrum of hLtn in 200 mM NaCl at pH 6.0 at 10 °C (Figure 2) is well dispersed, and the number of resolved signals indicates that hLtn adopts a single folded conformation under these conditions. These solution conditions were therefore chosen for the structure determination.
Figure 2.

2D 1H-15N HSQC spectrum of 15N-hLtn at 10 °C. Backbone NH assignments are indicated by the one-letter amino acid code and residue number. The inset box shows peaks for two residues with 1H chemical shifts upfield of the others due to ring-current effects from the side chain of Trp55.
Self-Association of hLtn
A plot of the logarithm of absorbance vs squared radial position would be linear for a single species in sedimentation equilibrium. Plots for hLtn exhibited increasing slope with radial position requiring the presence of two or more species. This was confirmed by global fitting of the data to a single species model. This fit yielded a molecular weight of 12 950 ± 30, corresponding to neither the monomer nor the dimer species of hLtn. Moreover, the quality of the single species fit is poor, exhibiting systematic deviations with radial position. An example of a fit constrained to the monomer molecular weight is shown in Figure 3. Using a model for a monomer to oligomer equilibrium and allowing the values for molecular weight, aggregation state, and equilibrium constant to vary, a mass consistent with the monomer was obtained as well as an aggregation number near 2 (2.10 ± 0.08). A fit with the aggregation number fixed at 2 resulted in a molecular weight of 10 550 ± 140 and an association constant of 660 ± 80 M−1. Fitted curves for this model are shown in Figure 3. Close examination of the fit residuals showed some systematic deviations at high concentrations, but attempts to include an additional association step did not yield consistent results. It is possible that higher molecular weight species are formed at higher concentration, but the present study has not permitted their enumeration. Therefore, hLtn is best described as existing in a monomer–dimer equilibrium under these solution conditions. A final fit with the aggregation number fixed at 2 and the mass constrained to that calculated from the hLtn sequence (10 254 Da) gave an association constant for dimer formation of 850 ± 10 M−1.
Figure 3.

Sedimentation equilibrium gradient of hLtn. Absorbance data at 280 nm (open circles) are shown for each of the initial concentrations used after equilibrium has been reached at 26 000 rpm and 10 °C. Solid lines are from a global fit to all 12 sets of data using a monomer–dimer equilibrium model resulting in a mass of 10 550 Da and an equilibrium constant of 660 M−1. The additional curve (monomer) is the result of fitting the data to a single species model where the mass was constrained to that calculated from the hLtn sequence.
Self-Diffusion Measurements
The results of diffusion measurements on hLtn and two other proteins are summarized in Table 1. A series of 1D 1H spectra with PFG pulses of increasing duration (0.5–6.5 ms) were collected for each sample. The diffusion delay between gradient pulses was adjusted to obtain signal attenuation of at least 10-fold for accurate fitting of the data to eq 1. Each diffusion coefficient (Ds) in Table 1 reflects an average obtained from fits of the intensities of at least four peaks in the protein spectrum.
Table 1.
Self-Diffusion Coefficients for Various Proteins at 10 °C
| protein | M r | Ds (×10−6 cm2/s) | concn (mM) | Δ (ms) |
|---|---|---|---|---|
| hLtn | 10254 | 0.78 ± 0.03 | 0.5 | 150 |
| ubiquitin | 8565 | 1.09 ± 0.01 | 0.5 | 120 |
| ribonuclease A | 13690 | 0.81 ± 0.01 | 0.5 | 150 |
Values of Ds obtained for hLtn at 10 °C in 200 mM NaCl were nearly constant over the concentration range 0.1–1.0 mM (data not shown). Comparison of the diffusion coefficients obtained for Ltn with those for ribonuclease A (13.7 kDa) and ubiquitin (8.6 kDa) showed that the Ds for hLtn is nearer to that of the larger protein.
Resonance Assignments
Sequential backbone assignments were deduced from HNCO, HNCA, HN(CO)CA, and 15N NOESY–HSQC data. CCONH, 15N TOCSY–HSQC, and HCCH-TOCSY spectra were used to assign aliphatic side chain 13C and 1H resonances. Aromatic side chain proton resonances were assigned from the 2D NOESY spectrum of a sample dissolved in 100% D2O. The existence of a disulfide bridge linking Cys11 and Cys48 was confirmed by analysis of the cysteine 13Cα and 13Cβ chemical shifts, which are indicative of the oxidation states of cysteine pairs (59). All chemical shift assignments have been deposited in the BioMagResBank (accession number 5042).
Secondary Structure Elements from CSI and NOE Data
Secondary structure elements were identified on the basis of NOE connectivities and the chemical shift index (CSI). The consensus CSI values calculated from experimental 1Hα, 13Cα, 13Cβ, and 13C’ chemical shifts, along with the summary of sequential and medium-range NOEs, are shown in Figure 4. The CSI identified four β-strands and one α-helix. Interstrand NOEs connect three of the β-strands (24–30, 36–41, 46–50) in an antiparallel sheet. An α-helix from residues 54 to 66 was confirmed by characteristic i, i+3 NOEs (Figure 4). No long-range NOEs were observed for the 9 N-terminal and 26 C-terminal residues.
Figure 4.

Summary of NOE connectivities and consensus chemical shift index for hLtn. Relative intensities of sequential NOEs are indicated by the bar thickness. Consensus CSI values are indicated by +1, 0, and −1 values for sheet, no prediction, and helix, respectively. Secondary structure elements deduced from CSI and NOE patterns are shown above the amino acid sequence. While the CSI predicts sheet for residues 10−16, no interstrand NOEs were observed. Torsion angle constraints obtained from the program TALOS are also indicated. Circles, up triangles, and down triangles indicate torsion angle restraints in the random coil, helix, and sheet regions, respectively, of the Ramachandran plot.
The internal mobility of the polypeptide chain was probed by measuring {1H}15N NOE values for all backbone amides; these are shown as a function of residue number in Figure 5A. A steady decline is seen in the heteronuclear NOE values for the unstructured residues approaching the ends of the N- and C-termini with negative NOE values observed for residues near each terminus; these values are consistent with large-amplitude motions on the picosecond to nanosecond time scale and a complete lack of stable secondary or tertiary structure. Residues connecting the first two β-strands (30’s loop) also exhibit low heteronuclear NOE values and few NOE constraints.
Figure 5.

Evidence for dynamic disorder in the 30’s loop and N- and C-terminal residues. (A) Heteronuclear 15N-1H NOE values are plotted as a function of amino acid sequence. Lower values are an indication of greater backbone mobility. (B) Distribution of NOE constraints along the primary sequence (intraresidue, short, medium, and long range NOEs are indicated by white, light gray, dark gray, and black bars, respectively). (C) Average backbone (solid lines) and heavy atom (dashed lines) rmsd values for the family of 20 structures to the mean structure. Residues of the N- and C-terminus reach maximal rmsd values of 10.7 and 57 Å, respectively.
Structure Determination
A total of 3270 NOE peaks were assigned in 3 different NOESY spectra (15N NOESY–HSQC, 13C NOESY–HSQC, and 2D NOESY); these yielded 1258 unique, nontrivial distance constraints, which were used in the structure calculations. In addition, two upper bound and two lower bound distance constraints served to define the disulfide bond between Cys11 and Cys48. Backbone dihedral angle restraints (ϕ and ψ) from TALOS were used only in regions of secondary structures and in the N-loop, not in terminal regions or in the loops connecting the β-strands. Stereospecific assignments for valine Cγ methyl groups of residues 37, 56, 59, and 60 were obtained from quantitative J-correlation experiments (JCC and JNC) and included in structure calculations. No other stereospecific assignments were determined. The distribution of distance constraints along the sequence is shown in Figure 5B. Structural statistics are summarized in Table 2. Although the average number of constraints per residue is 13.5 for the entire molecule, the structured region of hLtn (residues 9–68) is defined by an average of 16.8 constraints per residue. Superposition of residues 9–68 for the final ensemble of 20 TAD structures yielded a root-mean-square deviation (rmsd) of 0.46 and 1.02 Å from the mean structure for backbone (N, Cα, and, C’) and heavy atoms, respectively. Average backbone and heavy atom rmsd values relative to the mean structure are shown as a function of residue number in Figure 5C. The atomic rms deviations for terminal residues are much higher, reaching 10.7 Å for residue Val1 and 57 Å for Gly93. None of the 20 structures had NOE violations greater than 0.42 Å or van der Waals violations greater than 0.22 Å (Table 2).
Table 2.
Structural Statistics for hLtn Structures
| NOE constraints | number |
|---|---|
| long | 286 |
| medium | 184 |
| short | 387 |
| intraresidue | 401 |
| constraints/residue | 13.5 |
|
| |
| Ramachandran statistics (residues 9–68) |
|
|
| |
| most favored | 76.8% |
| additionally allowed | 19.6% |
| generously allowed | 3.3% |
| disallowed | 0.3% |
| parameter | family | minimized average |
|
| ||
| target function (Å2) | 0.70 ± 0.23 | 0.29 |
| upper limit violations | ||
| number >0.1 Å | 9 ± 3 | 0 |
| sum of violations (Å) | 4.5 ± 0.8 | 1.9 |
| maximum violation (Å) | 0.42 | 0.13 |
| van der Waals violations | ||
| number >0.2 Å | 0 ± 0 | 0 |
| sum of violations (Å) | 2.5 ± 0.5 | 1.7 |
| maximum violation (Å) | 0.22 | 0.11 |
|
| ||
| atomic rmsd’s (residues 9–68) (Å) family of 20 structures vs |
mean | minimized average |
|
| ||
| backbone | 0.46 ± 0.11 | 0.53 ± 0.14 |
| heavy atom | 1.02 ± 0.14 | 1.21 ± 0.20 |
Figure 6 shows a superposition of the ensemble of 20 structures for the well-ordered residues (9–68) of hLtn, together with a ribbon representation of the minimized mean structure. The hLtn molecule adopts the domain fold observed in all other chemokine structures, with a C-terminal α-helix packing against a three-stranded antiparallel β-sheet. Residues 1–8 and 69–93 are highly disordered. Residues 14–20 form the characteristic ‘N-loop’ lying above the β-sheet. A helical turn connects the N-loop to strand β1. Strand β1 contains a β-bulge involving residues 24 and 25. Strands β1 (24–30) and β2 (36–41) are joined by the 30’s loop consisting of residues 31–35. A hydrogen bond is observed between side chain Oγ1 of Thr30 and backbone HN of Ala36. A type I turn involving residues 41–44 connects β2 and β3 (46–50) with Leu45 bulged out. An α-helix (residues 54–66) follows β3 and lies atop the β-sheet, nearly parallel to the N-loop.
Figure 6.
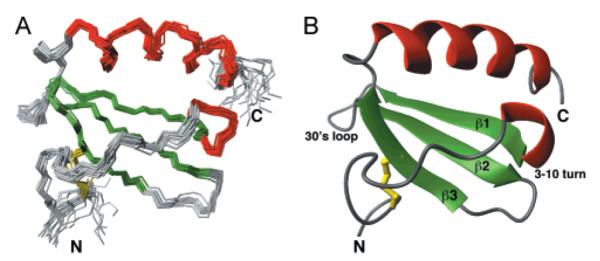
NMR structure of hLtn. (A) The ensemble of 20 TAD conformers with lowest target function, from a total of 50 structures, is superimposed on the mean structure using backbone atoms of residues 9–68. (B) The minimized average structure of hLtn is shown in a ribbon representation. The disulfide bridge is shown in yellow, β-strands in green, and helices in red.
A number of hydrophobic interactions position the helix with respect to the β-sheet. Side chains of Ile24, Tyr27, Val37, and Phe39 from the β-sheet and Trp55, Val56, Val60, and Met63 from the helix contribute to the hydrophobic core. Residues of the N-loop also contribute to the core, including Leu19 and Val21. In addition to NOEs between hydrophobic side chains, unusual ring-current effects on chemical shift also provide evidence of key tertiary interactions. Owing to their proximity to the Trp55 side chain, the backbone 1HN resonances of Val56 and Leu19 are shifted upfield of the normal range for backbone amide protons (Figure 2, inset).
DISCUSSION
Association State
Curvature in logarithmic plots of data from sedimentation equilibrium requires the presence of two or more species in the sample undergoing centrifugation. hLtn exhibited such curvature, and analysis by direct, global curve-fitting to specific models results in the simplest model being that of a monomer–dimer equilibrium. The best estimate for the association constant was found to be 850 ± 10 M−1.
The measured self-diffusion coefficient constant for hLtn, 0.78 × 10⁻⁶ cm2 s−1, is very close to that obtained for the 13.7 kDa protein ribonuclease A. Given a Ka of 850 M−1, a 0.5 mM solution of hLtn would contain 0.32 mM monomer and 0.09 mM dimer, with an average mass near that of ribonuclease A. The unstructured C-terminus of hLtn may reduce the reliability of molecular weight estimates from self-diffusion measurements, but these results are generally consistent with the sedimentation analysis. Taken together, ultracentrifugation and NMR self-diffusion results indicate that hLtn exists in a monomer–dimer equilibrium.
NMR Structure of hLtn
Most CXC and CC chemokines form dimers, although with two very distinct mechanisms for oligomerization. Sedimentation and self-diffusion results clearly indicated that hLtn is able to form dimers, with a typical 1 mM NMR sample predicted to contain up to 50% of the total protein in the dimeric form (~0.53 mM monomer, ~0.23 mM dimer). Throughout the refinement process, we searched unsuccessfully for NOEs that might identify a dimer interface. Moreover, NMR spectra of hLtn acquired as a function of protein concentration showed no shifting or broadening of peaks that might be taken as evidence of exchange between monomer and dimer forms (data not shown). Only one set of resonances was observed in all the spectra, indicating that exchange between the monomer and dimer species is rapid on the NMR time scale. We conclude that the relatively low abundance and short lifetime of the dimer combine to prevent detection of NOEs between monomers. In the absence of specific information about the dimer interface, the NMR structure of hLtn was refined as a monomer. Whether hLtn forms a dimer analogous to either the typical CXC or the CC type remains to be determined. While unusual sequence features (missing disulfide, extended C-terminus) distinguish lymphotactin from the other classes, it adopts the same features of secondary and tertiary structure seen in all chemokines to date. Despite their role in lymphotactin function, residues of the unique C-terminal extension are dynamically disordered (Figure 5). While the absence of unique structural elements fails to explain the functional role of the hLtn C-terminal tail, it is still reasonable to assume that these residues, along with the mobile 30’s loop and N-terminus, can play a role in receptor binding or activation, as discussed below.
Glycosaminoglycan Binding
Virtually all chemokines, including lymphotactin, bind glycosaminoglycans such as heparin, and this interaction is thought to be important in forming chemokine concentration gradients directing cell migration to the site of injury or infection (3–5). A number of different heparin binding residues have been identified in chemokines involving basic residues in the N-terminal loop, strand β1, the C-terminal helix, and, most commonly, the 40’s loop connecting β2 and β3 (29, 60–63). Ltn is a very basic protein, with an estimated isoelectric point of 10.6, and it binds to a heparin–Sepharose column with a high affinity (4). The electrostatic surface map of hLtn shown in Figure 7 reveals several clusters of positively charged residues that could participate in GAG–hLtn interactions. Two basic residues in the 40’s loop (Lys42 and Arg43) are proximal to Arg23, Lys25, Lys 66, and Arg70; these create a large positively charged surface area (Figure 7A,B). Another cluster is located on the solvent-exposed surface of the α-helix. Three equally spaced arginine residues (Arg57, Arg61, and Arg65) of the α-helix together with Arg35 from the 30’s loop make another possible binding site for GAGs.
Figure 7.

hLtn is a highly basic protein. (A) Ribbon diagram of hLtn with side chains of basic residues shown in blue. (B) A surface representation of hLtn oriented as in (A), colored according to electrostatic potential with positive regions in blue and negative regions in red. Potentials were calculated using the program MOLMOL. (C) Electrostatic surface as in (B) rotated by 180° about the vertical axis.
Comparison of hLtn with Other Chemokines
The structures of all known chemokines share the same conserved chemokine fold. We have compared hLtn, the sole example of the C class, with representative members from each of the other chemokine classes (CXC, CC, and CX3C). Figure 8 shows the sequence alignment and superposition of the backbone of the structured regions of hLtn and IL-8 (CXC), RANTES (CC), and fractalkine (CX3C). Despite its lack of one of the two conserved disulfides, hLtn adopts the same folded structure as the other proteins (Figure 8B). The similarity of hLtn to the CC and CX3C chemokines is somewhat greater than to this CXC chemokine in terms of both sequence and structure. hLtn shares 37.5%, 31.9%, and 20% sequence identity with RANTES, fractalkine, and IL8, respectively (Figure 8A). Backbone rms deviations from hLtn for structured regions of RANTES, fractalkine, and IL8, excluding the N-terminal residues and 30’s loop, were calculated to be 0.9, 0.9, and 1.3 Å, respectively. Residues of the N-terminus preceding the first cysteine are highly mobile in hLtn as well as in other chemokine structures (22, 27, 29). The three-stranded, antiparallel β-sheet and α-helix superimpose very closely in all four structures, with only minor differences in the lengths of the strands and the helices. Positioning of the N-loop and 310 helical turn relative to the sheet are also similar (Figure 8B).
Figure 8.

Comparison of hLtn structure with IL-8, RANTES, and FRCD. (A) Sequence alignment of hLtn with human interleukin 8 (IL-8), human RANTES, and human fractalkine chemokine domain (FRCD). Sequences were aligned based on structural alignments obtained with the program SwissPDBViewer. (B) Structural overlay for hLtn (green), IL-8 (yellow), RANTES (red), and FRCD (blue). All disulfides are shown with sulfur atoms in yellow. Residue ranges and backbone rmsds for the superimpositions were as follows: hLtn(13–15,18–32,35–64), IL-8(11–13,16–30,37–66) 1.3 Å; hLtn(14–15,18–29,34–62), RANTES(14–15,18–29,36–64) 0.9 Å; hLtn(13–15,18–28,-35–65), FRCD(14–16,18–28,37–67) 0.9 Å. (C) Detailed view of the 30’s loop and N-terminal cysteines, with structures colored and superimposed as in (B).
Significant structural differences between hLtn and the other chemokines arise from the absence of a second disulfide and a shortened 30’s loop in hLtn and are localized to these regions (Figure 8C). Rotation of the χ1 angle of Cys11 by ~150° in hLtn relative to the analogous residue in IL-8, RANTES, and fractalkine results in a completely different orientation for this disulfide. As a result, the backbone conformation for residues Cys11–Leu14 of hLtn diverges from the other three structures, which are quite similar to each other. Interestingly, these residues are predicted by the consensus CSI to form a β-strand, though no evidence for this was found in the NOESY data. In all other chemokines, the 30’s loop is tethered to the N-terminal region by another disulfide bond. This interaction is completely absent in hLtn owing to the missing disulfide. Increased backbone flexibility for these residues, as detected by {1H}15N heteronuclear NOE measurements, is not unique to hLtn, however, as the 30’s loop is known to be highly mobile in a number of other chemokines (20, 64).
The positioning of the C-terminal helix relative to the sheet also varies throughout the chemokine family. Hydrophobic interactions of the helix and sheet in hLtn are similar to those in CC chemokines and fractalkine. This results from conservation in hLtn of apolar residues that play key roles in the hydrophobic core of CC chemokines (65), including Leu19, Tyr27, Val37, Phe39, Trp55, Val60, and Met63.
Receptor Binding and the Functional Role of C-Terminal Extension
Structural characterization of the mode of action of chemokines upon their cognate G-protein-coupled receptors (GPCR) is hampered by the insoluble nature of these integral membrane proteins. Other investigators have studied the interactions of chemokines and peptides derived from the N-terminal extracellular domain of the corresponding GPCR. Residues of the unstructured N-terminus, N-loop, and 30’s loop as well as residues adjacent to the conserved disulfide motifs and in the α-helix have been implicated in various receptor-derived peptide–chemokine interactions (22, 66, 67). The unique C-terminal tail of Ltn has been shown to be necessary for its function by several groups (33, 35). It is clear from the structure presented here that the C-terminal extension of hLtn is highly dynamic and does not adopt any stable conformation in solution. Since they do not play a key structural role, it seems likely that residues of the C-terminus are involved in direct interactions with the receptor. However, our current studies do not predict which residues participate in binding or the relevant conformation.
As mentioned above, the 30’s loop, often implicated in receptor–chemokine interactions, is decoupled from the N-terminal region of hLtn and is shorter by at least two residues in hLtn than in other chemokines (Figure 8C). It is possible that the 30’s loop in Ltn interacts differently with its receptor than the corresponding loops in other chemokines do with their cognate receptors. In a commonly suggested two-part mechanism for GPCR signaling by chemokines, binding to the receptor N-terminus is followed by activation through interactions with the mobile loops and termini of the chemokine. Specific receptor-activating interactions provided by the 30’s loop in other classes of chemokines might be augmented in hLtn by interactions with unstructured terminal residues.
Summary
Lymphotactin is an unusual member of the chemokine family owing to its single disulfide and extended C-terminal sequence (Figure 1). A synthetic gene coding for hLtn was constructed and used for expression of recombinant protein. We concluded from analytical ultracentrifugation and NMR self-diffusion measurements that at the conditions studied (10 °C, 200 mM NaCl, 20 mM phosphate buffer, pH 6.0) hLtn exists in a monomer–dimer equilibrium with an association constant of approximately 850 M−1 (Table 1, Figure 3). All 1H, 15N, and 13C chemical shifts were assigned (Figure 2), and the solution structure was refined using NOE distance constraints and dihedral angle constraints generated with the program TALOS (Table 2). Residues comprising the unique C-terminal sequence of hLtn are entirely disordered in solution (Figures 4 and 5), but residues 9–68 adopt the conserved fold observed for all other chemokines (Figure 6). Our studies provide a structural basis for further investigations into the binding reactions of hLtn with cell-surface GAGs (Figure 7) and its specific G-protein-coupled receptor, XCR1 (Figure 8).
ACKNOWLEDGMENT
We thank Dr. Ed Mooberry for assistance with NMR instrumentation and gratefully acknowledge Dr. Steve L. Alam and Ed Meenen for synthesis of DNA oligonucleotides.
Footnotes
The study was supported by NIH Grant R01 AI45843. For all multidimensional NMR experiments, this study made use of the National Magnetic Resonance Facility at Madison (NMRFAM), using equipment purchased with funds from the University of Wisconsin, the NSF Biological Instrumentation Program (DMB-8415048), the NIH Biomedical Research Technology Program (RR02301), the NSF Academic Research Instrumentation Program (BIR-9214394), the NIH Shared Instrumentation Program (RR02781 and RR08438), and the U.S. Department of Agriculture. Sedimentation equilibrium data were obtained at the University of Wisconsin–Madison Biophysics Instrumentation Facility, which is supported by the University of Wisconsin–Madison and Grants BIR-9512577 (NSF) and S10 RR13790 (NIH).
Coordinates for the minimized average structure and the family of 20 structures have been deposited in the RCSB Protein Data Bank under codes 1J9O and 1J8I, respectively. Chemical shifts have been deposited in the BioMagResBank under accession number 5042.
Abbreviations: E. coli, Escherichia coli; GAGs, glycosaminogly-cans; hLtn, human lymphotactin; IL8, interleukin 8; RANTES, regulated upon activation, normal T-cell expressed and secreted; FRCD, fractalkine chemokine domain; IPTG, isopropyl β-d-thiogalactopyranoside; LB, Luria broth; Ltn, lymphotactin; PCR, polymerase chain reaction; PFG, pulsed field gradient; rmsd, root-mean-square deviation; TAD, torsion angle dynamics; EDTA, ethylenediaminetetraacetic acid; PMSF, phenylmethylsulfonyl fluoride; HIV, human immunodefficiency virus; NK cells, natural killer cells; DTT, dithiothreitol.
REFERENCES
- 1.Gale LM, McColl SR. BioEssays. 1999;21:17–28. doi: 10.1002/(SICI)1521-1878(199901)21:1<17::AID-BIES3>3.0.CO;2-4. [DOI] [PubMed] [Google Scholar]
- 2.Murphy PM, Baggiolini M, Charo IF, Hebert CA, Horuk R, Matsushima K, Miller LH, Oppenheim JJ, Power CA. Pharmacol. ReV. 2000;52:145–176. [PubMed] [Google Scholar]
- 3.McFadden G, Kelvin D. Biochem. Pharmacol. 1997;54:1271–1280. doi: 10.1016/s0006-2952(97)00182-2. [DOI] [PubMed] [Google Scholar]
- 4.Kuschert GSV, Coulin F, Power CA, Proudfoot AEI, Hubbard RE, Hoogewerf AJ, Wells TNC. Biochemistry. 1999;38:12959–12968. doi: 10.1021/bi990711d. [DOI] [PubMed] [Google Scholar]
- 5.Hoogewerf AJ, Kuschert GSV, Proudfoot AE, Borlat F, Clark-Lewis I, Power CA, Wells TNC. Biochemistry. 1997;36:13570–13578. doi: 10.1021/bi971125s. [DOI] [PubMed] [Google Scholar]
- 6.Cocchi F, DeVico AL, Garzinio-Demo A, Arya SK, Gallo RC. Science. 1995;270:1811. doi: 10.1126/science.270.5243.1811. [DOI] [PubMed] [Google Scholar]
- 7.Feng Y, Broder CC, Kennedy PE, Berger EA. Science. 1996;272:872–877. [Google Scholar]
- 8.Bates P. Cell. 1996;86:1–3. doi: 10.1016/s0092-8674(00)80070-7. [DOI] [PubMed] [Google Scholar]
- 9.D’Souza MP, Harden VA. Nat. Med. 1996;2:1293–1300. doi: 10.1038/nm1296-1293. [DOI] [PubMed] [Google Scholar]
- 10.He J, Chen Y, Farzan M, Choe H, Ohagen A, Gartner S, Busciglio J, Yang X, Hofmann W, Newman W, Mackay C, Sodroski J, Gabuzda D. Nature. 1997;384:645–649. doi: 10.1038/385645a0. [DOI] [PubMed] [Google Scholar]
- 11.Greco G, Mackewicz C, Levy JA. J. Gen. Virol. 1999;80:2369–2373. doi: 10.1099/0022-1317-80-9-2369. [DOI] [PubMed] [Google Scholar]
- 12.Berger EA, Murphy PM, Farber JM. Annu. ReV. Immunol. 1999;17:657–700. doi: 10.1146/annurev.immunol.17.1.657. [DOI] [PubMed] [Google Scholar]
- 13.Bazan JF, Bacon KB, Hardiman G, Wang W, Rossi D, Greaves DR, Zlotnik A, Schall TJ. Nature. 1997;385:640–644. doi: 10.1038/385640a0. [DOI] [PubMed] [Google Scholar]
- 14.Clore GM, Appella E, Yamada M, Matsushima K, Gronenborn AM. Biochemistry. 1990;29:1689–1696. doi: 10.1021/bi00459a004. [DOI] [PubMed] [Google Scholar]
- 15.St. Charles R, Walz DA, Edwards BFP. J. Biol. Chem. 1989;264:2092–2099. [PubMed] [Google Scholar]
- 16.Lodi PJ, Garrett DS, Kuszewski J, Tsang ML-S, Weatherbee JA, Leonard WJ, Gronenborn AM, Clore GM. Science. 1994;263:1762–1767. doi: 10.1126/science.8134838. [DOI] [PubMed] [Google Scholar]
- 17.Kim KS, Clark-Lewis I, Sykes BD. J. Biol. Chem. 1994;269:32909–32915. [PubMed] [Google Scholar]
- 18.Chung C-W, Cooke RM, Proudfoot AEI, Wells TNC. Biochemistry. 1995;34:9307–9314. doi: 10.1021/bi00029a005. [DOI] [PubMed] [Google Scholar]
- 19.Handel TM, Domaille PJ. Biochemistry. 1996;35:6569–6584. doi: 10.1021/bi9602270. [DOI] [PubMed] [Google Scholar]
- 20.Young H, Roongta V, Daly TJ, Mayo KH. Biochem. J. 1999;338:591–598. [PMC free article] [PubMed] [Google Scholar]
- 21.Meunier S, Bernassau JM, Guillemot JC, Ferrara P, Darbon H. Biochemistry. 1997;36:4412–4422. doi: 10.1021/bi9627929. [DOI] [PubMed] [Google Scholar]
- 22.Crump MP, Gong J-H, Loetscher P, Rajarathnam K, Amara A, Arenzana-Seisdedos F, Virelizier J-L, Baggiolini M, Sykes BD, Clark-Lewis I. EMBO J. 1997;16:6996–7007. doi: 10.1093/emboj/16.23.6996. [DOI] [PMC free article] [PubMed] [Google Scholar]
- 23.Crump MP, Rajarathnam K, Kim K-S, Clark-Lewis I, Sykes BD. J. Biol. Chem. 1998;273:22471–22479. doi: 10.1074/jbc.273.35.22471. [DOI] [PubMed] [Google Scholar]
- 24.LiWang AC, Wang Z-X, Sun Y, Peiper SC, LiWang PJ. Protein Sci. 1999;8:2270–2280. doi: 10.1110/ps.8.11.2270. [DOI] [PMC free article] [PubMed] [Google Scholar]
- 25.Qian YQ, Johanson KO, McDevitt P. J. Mol. Biol. 1999;294:1065–1072. doi: 10.1006/jmbi.1999.3333. [DOI] [PubMed] [Google Scholar]
- 26.Sticht H, Escher SE, Schweimer K, Forssmann W-G, Rosch P, Aderman K. Biochemistry. 1999;38:5995–6002. doi: 10.1021/bi990065i. [DOI] [PubMed] [Google Scholar]
- 27.Mizoue LS, Bazan JF, Johnson EC, Handel TM. Biochemistry. 1999;38:1402–1414. doi: 10.1021/bi9820614. [DOI] [PubMed] [Google Scholar]
- 28.Mayer KL, Stone MJ. Biochemistry. 2000;39:8382–8395. doi: 10.1021/bi000523j. [DOI] [PubMed] [Google Scholar]
- 29.Rajarathnam K, Li Y, Rohrer T, Gentz R. J. Biol. Chem. 2001;276:4909–4916. doi: 10.1074/jbc.M005085200. [DOI] [PubMed] [Google Scholar]
- 30.Clore GM, Gronenborn AM. FASEB J. 1995;9:57–62. doi: 10.1096/fasebj.9.1.7821760. [DOI] [PubMed] [Google Scholar]
- 31.Kelner G, Kennedy J, Bacon K, Kleyensteuber S, Largaespada D, Jenkins N, Copeland N, Bazan J, Moore K, Schall T, Zlotnik A. Science. 1994;266:1395–1399. doi: 10.1126/science.7973732. [DOI] [PubMed] [Google Scholar]
- 32.Kennedy J, Kelner G, Kleyensteuber S, Schall T, Weiss M, Yssel H, Schneider P, Cocks B, Bacon K, Zlotnik A. J. Immunol. 1995;155:203–209. [PubMed] [Google Scholar]
- 33.Hedrick JA, Saylor V, Figueroa D, Mizoue L, Xu Y, Menon S, Abrams J, Handel T, Zlotnik A. J. Immunol. 1997;158:1533–1540. [PubMed] [Google Scholar]
- 34.Hedrick JA, Zlotnik A. Methods Enzymol. 1997;287:206–215. doi: 10.1016/s0076-6879(97)87016-4. [DOI] [PubMed] [Google Scholar]
- 35.Marcaurelle LA, Mizoue LS, Wilken J, Oldham L, Kent SBH, Handel TM, Bertozzi CR. Chem. Eur. J. 2001;7:1129–1132. doi: 10.1002/1521-3765(20010302)7:5<1129::aid-chem1129>3.0.co;2-w. [DOI] [PubMed] [Google Scholar]
- 36.Hinck A, Walkenhorst W, Westler W, Choe S, Markley J. Protein Eng. 1993;6:221–227. doi: 10.1093/protein/6.2.221. [DOI] [PubMed] [Google Scholar]
- 37.Pace N, Schmid FX. Protein Structure: A Practical Approach. IRL Press; Oxford: 1997. [Google Scholar]
- 38.Laue TM. Methods Enzymol. 1995;259:427–452. doi: 10.1016/0076-6879(95)59055-2. [DOI] [PubMed] [Google Scholar]
- 39.Altieri AS, Hinton DP, Byrd RA. J. Am. Chem. Soc. 1995;117:7566–7567. [Google Scholar]
- 40.Uedaira H, Uedaira H. J. Phys. Chem. 1970;74:2211–2214. [Google Scholar]
- 41.Farrow NA, Muhandiram R, Singer AU, Pascal SM, Kay CM, Gish G, Shoelson SE, Pawson T, Forman-Kay JD, Kay LE. Biochemistry. 1994;33:5984–6003. doi: 10.1021/bi00185a040. [DOI] [PubMed] [Google Scholar]
- 42.Kay LE, Xu GY, Yamazaki T. J. Magn. Reson., Ser. A. 1994;109:129–133. [Google Scholar]
- 43.Muhandiram DR, Kay LE. J. Magn. Reson., Ser. B. 1994;103:203–216. [Google Scholar]
- 44.Grzesiek S, Bax A. J. Magn. Reson. 1992;96:432–440. [Google Scholar]
- 45.Grzesiek S, Anglister J, Bax A. J. Magn. Reson., Ser. B. 1993;101:114–119. [Google Scholar]
- 46.Zhang O, Kay LE, Olivier JP, Forman-Kay JD. J. Biomol. NMR. 1994;4:845–858. doi: 10.1007/BF00398413. [DOI] [PubMed] [Google Scholar]
- 47.Kay LE, Xu G-Y, Singer AU, Muhandiram DR, Forman-Kay JD. J. Magn. Reson., Ser. B. 1993;101:333–337. [Google Scholar]
- 48.Santoro J, King GC. J. Magn. Reson. 1992;97:202–207. [Google Scholar]
- 49.Grzesiek S, Vuister GW, Bax A. J. Biomol. NMR. 1993;3:487–493. doi: 10.1007/BF00176014. [DOI] [PubMed] [Google Scholar]
- 50.Vuister GW, Wang AC, Bax A. J. Am. Chem. Soc. 1993;115:5334–5335. [Google Scholar]
- 51.Delaglio F, Grzesiek S, Vuister GW, Zhu G, Pfeifer J, Bax A. J. Biomol. NMR. 1995;6:277–293. doi: 10.1007/BF00197809. [DOI] [PubMed] [Google Scholar]
- 52.Markley J, Bax A, Arata Y, Hilbers C, Kaptein R, Sykes B, Wright P, Wüthrich K. Eur. J. Biochem. 1998;256:1–15. doi: 10.1046/j.1432-1327.1998.2560001.x. [DOI] [PubMed] [Google Scholar]
- 53.Bartels CH, Xia TH, Billeter M, Günter P, Wüthrich K. J. Biomol. NMR. 1995;5:1–10. doi: 10.1007/BF00417486. [DOI] [PubMed] [Google Scholar]
- 54.Wishart DS, Sykes BD. J. Biomol. NMR. 1994;4:171–180. doi: 10.1007/BF00175245. [DOI] [PubMed] [Google Scholar]
- 55.Wishart DS, Sykes BD, Richards FM. Biochemistry. 1992;31:1647–1651. doi: 10.1021/bi00121a010. [DOI] [PubMed] [Google Scholar]
- 56.Güntert P, Mumenthaler C, Wüthrich K. J. Mol. Biol. 1997;273:283–298. doi: 10.1006/jmbi.1997.1284. [DOI] [PubMed] [Google Scholar]
- 57.Cornilescu G, Delaglio F, Bax A. J. Biomol. NMR. 1999;13:289–302. doi: 10.1023/a:1008392405740. [DOI] [PubMed] [Google Scholar]
- 58.Koradi R, Billeter M, Wuthrich K. J. Mol. Graph. 1996;14:51–55. doi: 10.1016/0263-7855(96)00009-4. [DOI] [PubMed] [Google Scholar]
- 59.Sharma D, Rajarathnam K. J. Biomol. NMR. 2000;18:165–171. doi: 10.1023/a:1008398416292. [DOI] [PubMed] [Google Scholar]
- 60.Koopman W, Krangel MS. J. Biol. Chem. 1997;272:10103–10109. doi: 10.1074/jbc.272.15.10103. [DOI] [PubMed] [Google Scholar]
- 61.Amara A, Lorthioir O, Valenzuela A, Magerus A, Thelen M, Montes M, Virelizier JL, Delepierre M, Baleux F, Lortat-Jacob H, Arenzana-Seisdedos F. J. Biol. Chem. 1999;274:23916–23925. doi: 10.1074/jbc.274.34.23916. [DOI] [PubMed] [Google Scholar]
- 62.Proudfoot AEI, Fritchley S, Borlat F, Shaw JP, Vilbois F, Zwahlen C, Trkola A, Marchant D, Clapham PR, Wells TNC. J. Biol. Chem. 2001;276:10620–10626. doi: 10.1074/jbc.M010867200. [DOI] [PubMed] [Google Scholar]
- 63.Laurence JS, Blanpain C, Leener AD, Parmentier M, LiWang PJ. Biochemistry. 2001;40:4990–4999. doi: 10.1021/bi002593w. [DOI] [PubMed] [Google Scholar]
- 64.Ye J, Mayer KL, Stone MJ. J. Biomol. NMR. 1999;15:115–124. doi: 10.1023/a:1008376728947. [DOI] [PubMed] [Google Scholar]
- 65.Fernandez EJ, Wilken J, Thompson DA, Peiper SC, Lolis E. Biochemistry. 2000;39:12837–12844. doi: 10.1021/bi001166f. [DOI] [PubMed] [Google Scholar]
- 66.Clubb RT, Omichinski JG, Clore GM, Gronenborn AM. FEBS Lett. 1994;338:93–97. doi: 10.1016/0014-5793(94)80123-1. [DOI] [PubMed] [Google Scholar]
- 67.Laurence JS, Blanpain C, Burgner JW, Parmentier M, LiWang PJ. Biochemistry. 2000;39:3401–3409. doi: 10.1021/bi9923196. BI011106P. [DOI] [PubMed] [Google Scholar]