Abstract
Using conventional materials, the resolution of focusing and imaging devices is limited by diffraction to about half the wavelength of light, as high spatial frequencies do not propagate in isotropic materials. Wire array metamaterials, because of their extreme anisotropy, can beat this limit; however, focusing with these has only been demonstrated up to microwave frequencies and using propagation over a few wavelengths only. Here we show that the principle can be scaled to frequencies orders of magnitudes higher and to considerably longer propagation lengths. We demonstrate imaging through straight and tapered wire arrays operating in the terahertz spectrum, with unprecedented propagation of near field information over hundreds of wavelengths and focusing down to 1/28 of the wavelength with a net increase in power density. Applications could include in vivo terahertz-endoscopes with resolution compatible with imaging individual cells.
 Wire array metamaterials can be used to beat the fundamental diffraction limit of light, but most demonstrations have been limited to microwaves and very short propagation lengths. Tuniz et al. scale these metamaterial fibres up to the terahertz region over longer distances and show focussing down to λ/28.
The well-known diffraction limit is a consequence of the evanescent decay of high spatial frequencies away from their source in conventional materials. Any form of linear imaging in the far field (that is, probing the field more than several wavelengths away from the object) is bound by this limit. While in optical microscopy a number of techniques have been developed providing finer resolutions, these rely either on nonlinear effects or techniques that effectively probe the near field and are difficult to scale to other wavelength ranges. In contrast, a hyperlens uses extremely anisotropic materials (typically metamaterials) with indefinite permittivity tensor1,2,3 in which even very high spatial frequencies propagate, so that no imaging information is lost in the far field within the material. Magnifying hyperlenses have been demonstrated using multilayer stacks in the UV4 and wire arrays for microwaves5,6; however, in both cases propagation of high spatial frequencies was limited to a few wavelengths at most. Hyperlenses are particularly promising for high-resolution imaging at long wavelengths (for example, infrared, THz), where the diffraction limit is very restrictive but spectra are information-rich (for example, on molecular structure), and other forms of subwavelength microscopy techniques have not been developed.
A hyperlens uses an indefinite material with permittivity tensor1,2
 |
where εt>0 and εz<0. Such materials support extraordinary plane waves with wave vector  satisfying
 |
where c is the speed of light in vacuum, ω the angular frequency, having defined the transverse wave vector  . For a given frequency, the dispersion relation (2) defines an unbounded hyperboloid in k-space. In particular, real (propagative) solutions for kz can be found for arbitrarily large spatial frequencies, kx and ky. As a consequence, small, subwavelength details (resolved only in the near field in isotropic materials) can propagate over many wavelengths in indefinite media. The polarization of these extraordinary waves is in the plane defined by
  ; however, ordinary waves with polarization orthogonal to that plane are also supported, diffracting as in an isotropic medium of permittivity εt.
Subwavelength arrays of wires directed along z can be approximated by an indefinite medium5,6,7,8, with the caveat that because currents can flow along the wires the medium is spatially dispersive and εz becomes dependent on kz (ref. 9). However, at terahertz frequencies and for subwavelength wire spacings,  >>εt, so that
  ~0 and all transverse spatial frequencies propagate with the same propagation constant
  . In this ‘canalisation’ regime10, images can in principle propagate without distortion and without being subject to the diffraction limit. Perfect imaging can be achieved using z polarized fields, which are constituted exclusively by extraordinary waves, effectively filtering out all ordinary waves.
In practice, wire arrays are of finite length L; as high spatial frequency waves cannot couple to propagating waves of free space, they are reflected at the interfaces, making the wire arrays finite-sized resonators. Owing to their unusual and unbounded dispersion relation, resonances of indefinite media can be counter-intuitive11. For the finite wire medium, the propagation constant kz is independent of kt and all transverse resonances occur for the same Fabry–Perot (FP) frequencies  , where p is any integer. If a source at ωp excites these resonances in the near field on one end of the wire array, an image of the source is reconstituted on the other side of the array. At other frequencies, the image is dominated by other resonances, and the image deteriorates12, although because of the presence of dispersive surface waves above the FP resonance, it can be shown that the best possible imaging occurs in fact at frequencies a few per cent below the FP resonances (see also Supplementary Fig. S1).
An alternate viewpoint is that the modes of the wire medium are a superposition of TEM modes of individual wires; thus, the wire medium acts as a subwavelength endoscope7. If the wires taper out along the length of the device, each ‘pixel’ of the endoscope becomes more separated, and images can be magnified, with the magnification given by the ratio between wire spacing at both ends of the taper. Despite the profound implication of using wire arrays for subwavelength magnifying and focusing for subwavelength field manipulation, the difficulty of fabricating tapered high aspect ratio metallic wire arrays has prevented their demonstration at frequencies above microwaves6.
Here we overcome these fabrication difficulties by using fibre drawing to produce straight and tapered wire arrays operating at terahertz frequencies, and experimentally demonstrate propagation of deeply subwavelength near-field information over optically long distances, up to several hundreds of wavelengths. The wire-based hyperlenses we demonstrate here are three orders of magnitude smaller than previous experiments in the microwave.
Results
Fabrication and characterization of wire array
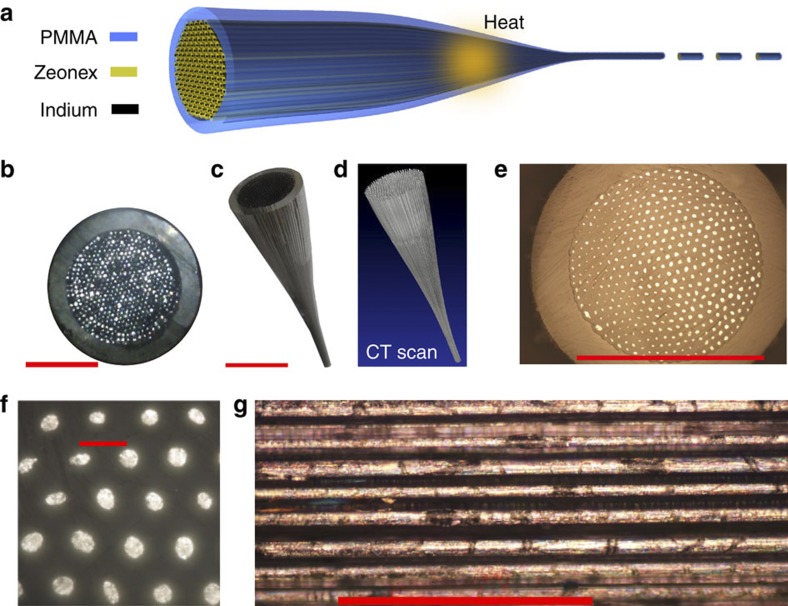
The wire media presented here are produced using the fibre drawing method13,14,15, a top-down, industrially scalable method for producing metamaterials, as summarized in Fig. 1a. By heating and stretching a centimetre-sized preform (Fig. 1b), two devices are simultaneously produced: a tapered wire medium (Fig. 1c,d) and a long length of uniform diameter fibre containing a wire medium (Fig. 1e,f). The taper and fibre contain 453 hexagonally arranged indium wires of nominally 10 μm diameter and 50 μm pitch at the fibre end. The diameter of the region containing the wire medium varies between 8 mm on the larger end of the taper and 1 mm on the smaller end of the taper and fibre. Note that in the subwavelength regime, imaging performance is not particularly sensitive to the exact locations of the wires, variation in wire radius or to the precise shape of the wire cross-sections16,17. The small variations in diameter observed in the cross-section of Fig. 1e,f are therefore not expected to negatively influence imaging performance.
Figure 1. Fibre and taper fabrication.
(a) A centimetre-sized preform is assembled by stacking indium wires surrounded by Zeonex29 (a polymer with low absorption at terahertz frequencies) into a hollow polymethyl methacrylate (PMMA) tube. This is heated and drawn to fibre, forming a tapered transition region where the polymer is viscous and the metal is liquid. The end product is a fibre containing a long continuous array of metal microwires. The fibre can be cut into a large number of smaller length devices. (b) Top-view photograph of the preform cross-section. Scale bar: 10 mm. (c) Photograph and (d) X-ray CT scan of the taper used in this work. Scale bar: 8 mm. Complete CT scans are included in Supplementary Movies 1 and 2. (e) × 10 (scale bar: 1 mm) and (f) × 40 (scale bar: 50 μm) magnified microscope image of a metamaterial fibre cross-section. (g) Typical side view of the straight fibre section, showing wire continuity and good uniformity over the length scales considered. Scale bar: 500 μm.
Wire media rely on exciting the resonances of the metallic rods, which therefore need to be continuous and electrically connected. Conductivity measurements performed on the wires contained in the taper confirm that all the 453 wires remain electrically connected during the draw process. X-ray computed tomography (CT) measurements of the taper used in this work (Fig. 1d) provide a further confirmation that wires are continuous. A full analysis of the CT scans reveals a smooth reduction in wire diameters in the tapered region, with no fluctuations within the 9.5 μm resolution of the CT images. Although optical microscopy images of the wires within the straight fibres show small imperfections on the surface of the wires (Fig. 1g), these do not appear to affect the overall performance of the device, as discussed below.
We characterize the subwavelength imaging properties of sections of the longitudinally invariant fibre and the described tapered array using a near field scanning terahertz time domain spectroscopy system18: we place a range of apertures in contact with the metamaterial fibres at one end, illuminated by focused THz pulses. The time domain spectroscopy antenna detecting transversal field components only is placed in close proximity to the output of the fibre or taper, and raster scanned along the x and y coordinates, recording the full time-dependent amplitude and phase of the x component of the electric field. Spectrally resolved images are obtained from the Fourier transform of the time-dependent THz signals.
Subwavelength imaging through straight fibre sections
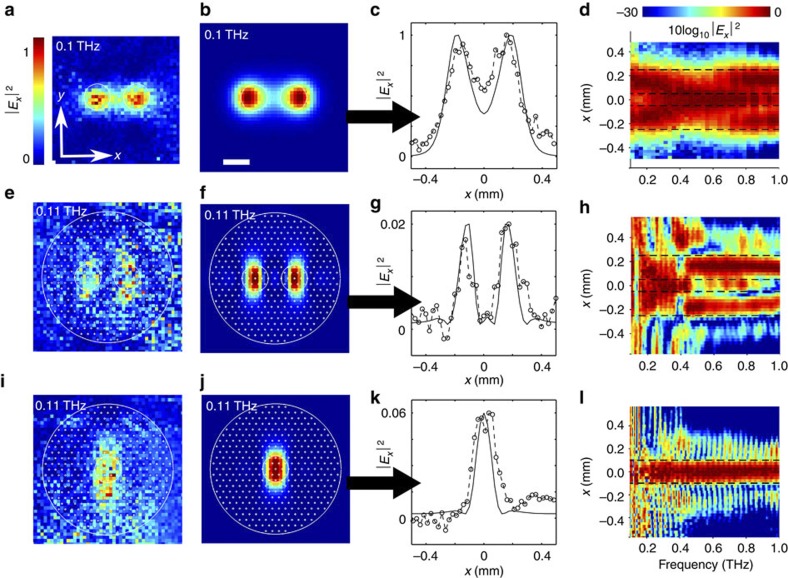
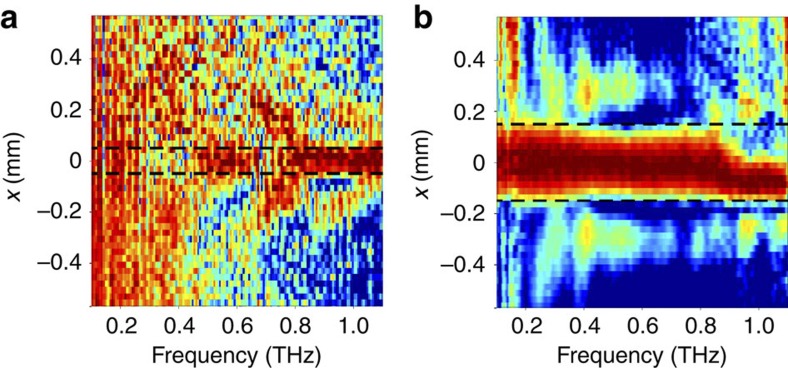
Figure 2 summarizes the experimental and simulated results of imaging of a double and a single aperture through a 3.4-mm straight section of metamaterial fibre and of the direct near-field of the double aperture without fibre for comparison. The last column in Fig. 2 shows the intensity in all three cases as a function of frequency, and x coordinate averaged around the centre of the image (y=0). For all plots as a function of frequency and position, the intensity at each frequency is normalized to the maximum in x and plotted using a logarithmic colour scale, thus removing the frequency dependence on transmission18, showing the important field characteristics. The direct near-field measurements of the double aperture show diffraction effects above 0.2 THz, where the two lobes of the apertures merge into a central one—this is consistent with a distance between antenna and aperture of 125 μm (see Supplementary Fig. S2) and results from the difficulty in making the planar antenna chip and the aperture sufficiently parallel. In contrast, the antenna chip can easily be brought into close contact with the small diameter fibre. At 0.11 THz (λ=2.7 mm in vacuum, λ=1.7 mm in Zeonex, the lowest resolved resonance of the fibre), the 100-μm gap in the x direction between two 200 μm apertures is clearly imaged through the fibre (Fig. 2e–g), indicating a resolution better than λ/27. The fields spread in the y direction as expected, as the x-polarized input excites non-diffracting extraordinary waves with x wave vector components and ordinary, diffracting waves with y wave vector components. While the metamaterial fibre clearly resolves the single 200-μm aperture at all FP resonances (Fig. 2l), and the double apertures at the FP resonances below 0.15 THz and above 0.45 THz, there are artifacts for the double apertures between those two frequencies (Fig. 2h) that may be because of charge coupling between apertures18 and require further investigation. Note in Fig. 2l the periodic appearance of side lobes (light blue) at FP antiresonances, at which imaging is suboptimal; the frequency spacing is 29 GHz—corresponding to the free spectral range of the 3.4 mm Zeonex FP slab—and is only just above the resolution limit of our setup (25 GHz). Details of the simulated geometry are presented in the schematic of Fig. 3 and in the Methods section.
Figure 2. Imaging apertures through straight fibre sections.
(a) Measured and (b) simulated intensity of two 200-μm-diameter apertures with 100 μm inner-edge separation at 0.1 THz, calculated 125 μm from the aperture output. (c) Measured (circles) and simulated (solid curve) intensity along x at y=0 μm. (d) Frequency-dependent beam profile along x averaged over y=0±50 μm. (e) Measured and (f) simulated intensity for the same apertures after propagation through the 3.4-mm-length fibre, calculated 50 μm from the fibre output. (g) Intensity along x averaged over y=0±100 μm. (h) Frequency-dependent intensity profile along x averaged over y=0±100 μm. (i) Measured and (j) simulated intensity for a single aperture after propagation through the 3.4-mm-length fibre, calculated 50 μm from the fibre output. (g) Intensity along x averaged over y=0±100 μm. (h) Frequency-dependent intensity profile along x averaged over y=0±100 μm. Care should be taken interpreting the relative magnitudes between (c,g,k) in that consistent coupling is difficult to achieve. Scale bar in (b) is 200 μm and applies to (a,b,e,f,i,j). The smaller white circles in (a,b,e,f,i,j) indicate the positions of the apertures. The larger white circle in (e,f) and (i,j) indicates the position of the metamaterial fibre. White dots in (e,f) and (i,j) schematically indicate the distribution of indium wires. Dashed lines in (d,h,l) indicate the estimated location of the imaged apertures.
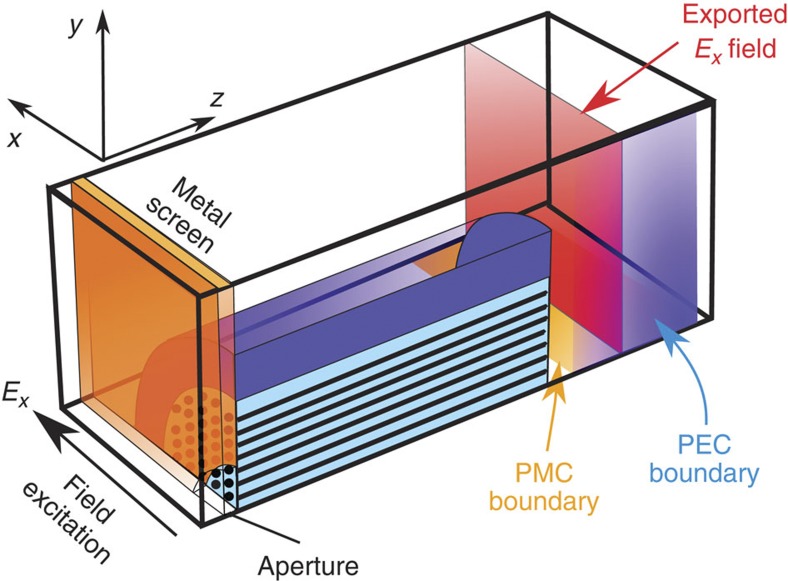
Figure 3. Schematic of the 3D simulation space.
The 3D finite element simulations contain a fibre with hexagonally arranged square indium wires of 20 μm width, and a centre-to-centre pitch of 50 μm, in a 1-mm-diameter Zeonex host, possessing a 1.4-mm-diameter PMMA cladding, with the appropriate material electromagnetic parameters accounted for29,30,31. In this example, the fibre is in contact with a small aperture. The excitation is given by a scattering boundary condition with a plane wave polarized in the x direction. At every other boundary, the scattering boundary condition is set to zero. Intensity images are then obtained from the x-polarized field taken on an xy plane that is 50 μm from the fibre (red); this distance corresponds to the approximate optical path length of the protective dielectric layer separating the detector from the fibre.
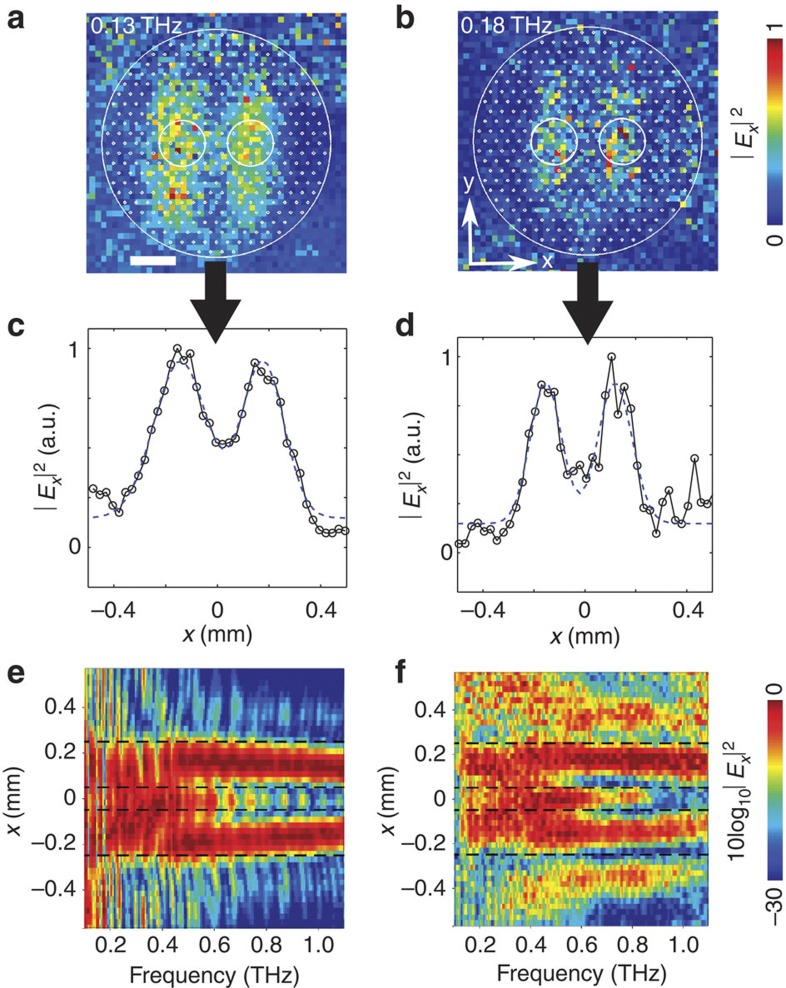
The double aperture measurements are repeated for fibre lengths of 1.5 and 7.0 mm. Good low-frequency images are obtained at frequencies corresponding to the cavity length being one and six and a half optical wavelengths, respectively, as shown in Fig. 4a–d. The frequency-dependent near-field intensity along x at y=0 is shown in Fig. 4e,f. The performance for the different lengths of fibre is similar: below ~0.4 THz, the apertures cannot be distinguished; above ~0.4 THz, there are two distinct intensity peaks corresponding to the location of the apertures, in addition to the periodic antiresonant sidelobes. At frequencies >0.4 THz, the ability to distinguish the apertures with all lengths of fibres represents a remarkable improvement over near-field imaging of the bare apertures (Supplementary Fig. S3).
Figure 4. Imaging apertures through different length fibres.
Experimentally measured x-polarized electric field intensity for the two apertures after propagation through a fibre of length (a) 1.5 mm and (b) 7.0 mm. Scale bar in a: 0.2 mm. A good image is obtained at 0.13 THz (a) and 0.18 THz (b), that is, at the second and thirteenth Fabry–Perot resonance frequency, respectively (within the 25-GHz resolution). (c,d) Measured intensity profiles over the middle of each fibre (y=0±100 μm), which are well fitted by double gaussian distribution fits (dashed lines). Experimental frequency-dependent beam profile along x averaged over y=0±100 μm for the two 200-μm apertures separated by 100 μm in contact with (e) the 1.5-mm fibre and (f) the 7.0-mm fibre, showing the images are qualitatively similar to the frequency-dependent beam profile along x for the 3.4 mm fibre in Fig. 2h. Smaller white circles in (a,b) indicate the estimated positions of the apertures; larger white circles indicate the estimated position of the metamaterial fibre; white dots schematically indicate the distribution of indium wires. The dashed lines in (e,f) indicate the estimated location of the imaged apertures.
Next, we measure the transmission of different sized apertures (100 and 300 μm diameter) in contact with similar length fibres. Their frequency-dependent near-field intensity along x at y=0 is shown in Fig. 5. A comparison with Fig. 2l shows that the metamaterial fibre supports non-diffractive propagation of subwavelength-confined fields, allowing to distinguish between differently sized apertures, thus acting as a subdiffraction-limited waveguide. Note that for the 300-μm aperture case and >0.9 THz, the aperture is larger than the beam size, resulting in an apparent drift of the signal corresponding to the location of the focal point. Owing to the reduced transmission of the 100-μm aperture, the signal to noise ratio becomes unacceptable below 0.4 THz in Fig. 5a. As a final comment, we note that the achievable resolution of the wire medium in this range is only limited by the separation between wires (nominally 50 μm), provided that the wire diameter is larger than the skin-depth of the metal at that frequency19 and that the appropriate fibre length is selected. An example of the simulated point spread function of the device, resolved both in space and frequency, can be found in Supplementary Fig. S1.
Figure 5. Imaging different sized apertures through straight fibre sections.
Experimental frequency-dependent beam profile along x, as a function of x position and frequency at y=0, (a) for a 100-μm aperture in contact with a 3.4-mm fibre, and (b) for a 300-μm aperture in contact with a 3.6-mm fibre. The dashed lines indicate the estimated location of the aperture.
Subwavelength imaging through wire array taper
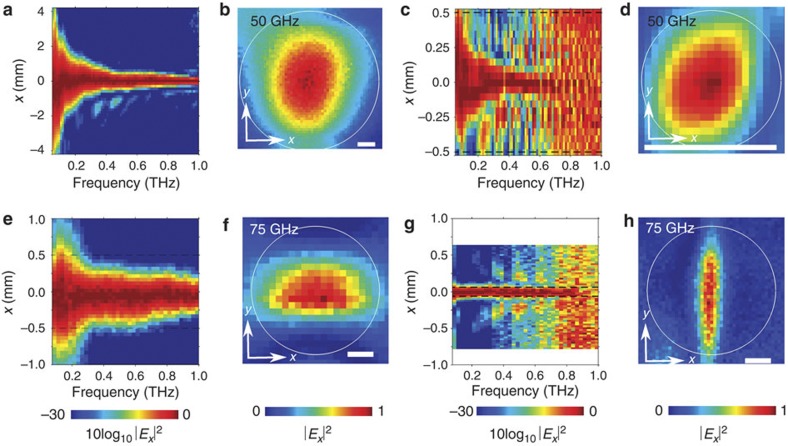
Next, we analyse the focusing properties of the wire array fibre taper (Fig. 6). First, we focus the x-polarized THz beam without any aperture on the large side of the taper (frequency-dependent beam profile along x at y=0 shown in Fig. 6a) and then measure the near field at the narrow end of the taper (Fig. 6c), clearly showing a compression in x. Figure 6b,d shows the complete intensity images before and after the taper at 50 GHz, where the near field at the output of the fibre has a FWHM of λ/9. At this wavelength, the field is also limited by the finite transverse size of the metamaterial region. We also place a 1-mm aperture in front of the larger end of the metamaterial taper and measure the near field at the narrow end of the taper. Figure 6e,f shows the near field directly at the aperture without metamaterial fibre, for comparison. Figure 6h shows that the field is strongly focused in the x direction, down to a full-width at half-maximum (FWHM) of λ/28, but not in the y direction, as expected for x-polarized light. Figure 6g shows the frequency-dependent intensity distribution along x (for y=0) at the output of the taper, showing effective and consistent focusing-down of the aperture across frequencies from 50 GHz to 0.9 THz, with some artifacts appearing at some frequencies above 0.3 THz. The length of the taper corresponds to 182 wavelengths in Zeonex at 0.9 THz and 10 wavelengths at 0.05 THz. Note that for frequencies >0.23 THz, λ/2n is larger than the wire array spacing at the large end of the taper (400 μm), and the wire array can no longer be described by an effective medium along the entire length of the taper.
Figure 6. Focused images using the taper.
(a) Intensity along x at y=0 of the terahertz focal point (taper input). (b) Intensity profile at 50 GHz. The circle delimits the metamaterial region. Scale bar: 1 mm. (c) Intensity along x averaged over y=0±250 μm of the taper output. The dashed lines delimit the metamaterial core. (d) Taper output intensity profile at 50 GHz. The circle delimits the metamaterial core. Scale bar: 1 mm. (e) Intensity along x at y=0 of the terahertz pulse after a 1-mm aperture (dashed line). Above 0.3 THz the beam width is smaller than the aperture. Elsewhere, a spread in signal is observed, as the detector is not in perfect contact with the aperture surface. (f) Intensity at 75 GHz at 1 mm aperture output. The circle delimits the aperture. Scale bar: 0.2 mm. (g) Intensity along x averaged over y=0±100 μm of the taper output in contact with the 1 mm aperture. Dashed lines delimit the expected reduction. (h) Intensity profile at 75 GHz. The circle delimits the metamaterial core. Scale bar: 0.2 mm.
Taper loss and focusing performance
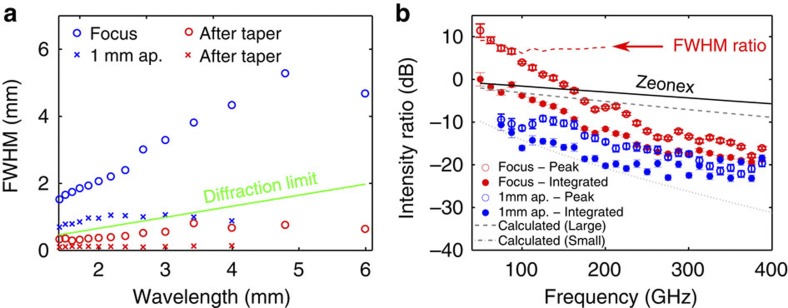
The subdiffraction-limited focusing properties of the taper are summarized in Fig. 7a showing the fitted FWHM along x of the intensity distributions before and after taper, for both experiments. To demonstrate that we observe focusing rather than masking for the THz beam, we compare the peak power density before and after the taper in Fig. 7b; as focusing is only expected along the x-direction, the intensity should increase by a factor 8 (that is, 9 dB) in the absence of losses, as observed for the lowest frequencies. On the same figure, the total power loss (integrated over the full two-dimensional image) shows that overall losses are comparable to those for propagation in pure Zeonex at low frequencies but increase beyond that because of the wire structure at higher frequencies. Losses are discussed in further detail in the Methods section. The net power density increase is not observed for the focused aperture (Fig. 7b); we attribute this to the large coupling losses at the wide end, where light can only couple to a few wires after the aperture as a result of modal mismatch.
Figure 7. Focusing performance of the taper.
(a) Fitted wavelength-dependent FWHM (x direction) for the focal point of the THz pulse before (blue circles) and after (red circles) the taper, and after a 1-mm aperture (blue crosses) and after the taper in contact with the aperture (red crosses). The diffraction limit is λ/2n for Zeonex29 (n=1.52). (b) Taper loss as obtained from the ratio between output and input of integrated (full circles) and peak (empty circles) intensities, for the THz focus (red) and for the 1-mm aperture (blue) compared with calculated values and material losses (see Methods section). The red dashed curve is the peak power enhancement that one expects from the compression of the beam as predicted by the ratios of the FWHM data in a. Error bars reflect the errors resulting from noise in the THz time-domain spectroscopy signal and are determined by the upper and lower bounds of values obtained at each frequency when changing the onset of zero-padding of the reference THz time signal at different times above 20 ps, corresponding to the inverse of the minimum frequency measured.
Discussion
As we have demonstrated, tapered wire array fibres can focus light to subwavelength spots with a net power density increase; however, in addition to other subwavelength-focusing schemes20,21, metamaterial fibres enable the transmission of complex subwavelength images over optically long distances. In particular, the same lenses can in principle be used for magnification: a wire array taper with long propagation lengths used in reflection could enable THz imaging deep within living tissue with high-resolution down to single cells, opening up an entirely new spectrum of molecular resonances for functional imaging. THz imaging by conventional means within tissues is typically impossible because of the high absorption of water at these frequencies and the severe restrictions imposed by the diffraction limit. The metamaterial fibres could also enable increased THz power extraction22 and even be used for spectral measurement-based far-field subwavelength-resolved imaging23,24. The fabrication method we used lends itself to mass production, with a realistic prospect of finding widespread use in THz imaging technology. Although the guiding mechanism is robust to fluctuations in the wires16, preliminary attempts at reducing wire diameters below 1 μm for the combination of materials used in this work have shown that wire continuity is compromized by the onset of Plateau–Rayleigh instability25, resulting in break up. Recent reports have presented continuous in-fibre metal nanowire arrays using alternative material combinations26 and fabrication methods27, potentially paving the way for fibre-based hyperlenses up to infrared frequencies.
Methods
Fibre and taper fabrication
A laboratory syringe is used to draw liquid indium into 50-cm length Zeonex tubes (outer diameter 5 mm, inner diameter 1.5 mm), which are drawn into hundreds of metres of continuous indium-filled fibre (500 μm diameter). This is cut into 453 pieces (40 cm length) and stacked inside a polymethyl methacrylate tube with outer diameter 16 mm and inner diameter 12 mm. This preform is sealed at both ends and fed into a furnace (0.1–0.5 mm min−1, 180–185 °C) and drawn into metamaterial fibres (1.5 mm outer diameter, 1 mm diameter wire array region). Vacuum is applied during the draw to collapse the interstitial holes, obtaining a uniform dielectric surrounding the wires.
Conductivity experiments
Owing to its limited spatial resolution, submicrometre interruptions of wires could be hidden within the apparent continuity of all wires on the micro CT scans. In order to provide direct evidence of microscopic continuity of the wires in the axial direction, point-to-point conductivity measurements were performed as follows. The narrow end of the taper was polished and dipped in silver-loaded electrically conductive glue, which in turn was connected to a multimeter via a copper wire. The multimeter was also connected to a metallic needle (50 μm tip) which, using a micrometre-positioning stage, was controllably placed in contact on each individual wire exposed on the large side of the taper. We measured low resistance on all 453 wires of the taper, demonstrating that the indium wires remain connected during the draw process.
Sample preparation
The fibre is cleaved and polished on each side to make segments of different lengths. These are inserted in the middle of a 25-mm-diameter polymethyl methacrylate disc of 2 mm thickness, over apertures that are centred and in direct contact with the fibre. The apertures are produced by fs-laser machining of 50-μm-thick brass discs. By calibrating the depth of field of a microscope with the disc on a flat surface, one can verify that the fibre is in contact with the disc and that the apertures are centred.
Terahertz near-field microscope
The terahertz emitter consists of a pair of striplines (80 μm gap) deposited on gallium arsenide, on which a bias voltage is applied. Accelerating photocarriers are produced by pumping with a titanium sapphire (Ti:sa) laser (λ=800 nm, 12 fs pulse width, 80 MHz repetition rate), resulting in a THz pulse, which is focused on a chip containing the detector antenna (silicon on sapphire substrate with H-electrode antenna containing a 10-μm gap). The excitation beam gating the emitter is delayed relative to the probe beam. The THz pulse is measured by lock-in amplification. The detector is mounted on a movable periscope, so that spatial distribution of the field can be scanned. A protective dielectric layer of 30 μm thickness covers the detector antenna.
Measurements
The near-field is spatiotemporally resolved at every point on the output plane via a raster scan. FFTs of the temporal response for each pixel provide the spectral information. Fibre output images are obtained over an area of 1.6 × 1.6 mm2 with 25 μm steps, over 12–14 h. The frequency resolution Δf is given by the inverse product of the time step Δt and the number of data points N of the time domain signal,  , where tmax is the maximum detected time. Here tmax=40 ps, which corresponds to a resolution of 25 GHz. The time-domain signal is additionally zero-padded after the measured THz pulse, resulting in an ideally interpolated frequency-resolved signal with a smaller frequency step28.
Three-dimensional (3D) simulations
We use a 3D finite element package (COMSOL) to model the geometry of Fig. 1e, whereby intensity images are obtained from field distributions taken on a plane at a certain distance from the output. The wires were simulated with a square cross-section to enable a higher degree of control over the mesh density. The minimum wire mesh size is 10 μm, in order to use less than the 128 GB of RAM at our disposal. The solver successfully converges; however, it does not accurately model the penetration of the field into the metal; this model is analogous to that of a fibre containing perfectly conducting wires. Whereas this only approximates the behaviour of indium in this frequency range, the field profile at the fibre output is a useful means of comparison with experiment. Owing to the C4v symmetry of such a structure, a quarter-slice of the fibre is considered, with perfect magnetic conductor boundary conditions (magnetic field is zero) in the xz plane that is on the inner boundary of the fibre, and perfect electric conductor boundary conditions in the yz plane (electric field is zero) on the other inner boundary (see Fig. 3). This allows one to model a fibre using only one quarter of the mesh elements of the full structure. Convergence of solutions for a single frequency can take from as little as 1 h to as long as several days.
2D simulations
A 2D finite element mode solver is used to calculate the loss of the metamaterial fibre, which allows one to enforce a sufficiently fine mesh on the wires to accurately account for the field penetration into the metal while staying within the limit imposed by memory constraints. It is found that effective index values converge for mesh sizes that are less than the skin-depth, thus accurately modelling the field penetration in the wires. A typical example is shown in Supplementary Fig. S4. The modes are found to possess a real part of the effective index Re(neff)~1.54, which is close to, but greater than, the Zeonex refractive index of 1.52—these modes are thus the surface modes of indium wires inside the Zeonex. The losses of such modes are reflected in the imaginary part of the effective index. This is affected by the overlap of the modal field with the lossy metal wires, yielding a larger wavelength-dependent imaginary part of neff than the imaginary part of the refractive index of the host material. To estimate the overall loss of the fibre, we consider the mode that possesses the largest imaginary part of neff.
Straight fibre loss
To experimentally characterise the loss of the untapered fibre, ‘cutback’ measurements are performed as follows. A 500-μm aperture is placed in contact with fibres of lengths 1.5, 3.4 and 7 mm. This ensures that only the metamaterial core is illuminated by the THz pulse over the entire frequency range while still having sufficient signal at low frequencies. For each fibre length, we place the field detector in contact with the fibre and measure the signal at the output through the centre of the fibre, scanning along the x direction, but keeping y constant. Fourier transforms of the time-domain pulses yield frequency-dependent intensity measurements, from which the total transmitted intensity as a function of fibre length can be obtained at every frequency. A linear fit then provides the loss coefficient. The fibre loss is between 0.2 and 2 dB mm−1 in the THz frequency range (see Supplementary Fig. S5), which as we have seen proves practical for measurements over several wavelengths.
Taper loss
The calculated losses in Fig. 7b, for comparison with the intensities transmitted by the taper, are obtained assuming propagation in a 38-mm-long structure (corresponding to the length of the taper) using numerically obtained values of the imaginary part of the effective index. For simplicity, our calculations consider two limiting geometries, corresponding to the larger- (input) and smaller (output) side of the taper: the first (labelled ‘large’ in Fig. 7b) is composed of an 8-mm-diameter fibre with hexagonally arranged circular metal cylinders of 160 μm diameter and 400 μm centre; the second (labelled ‘small’ in Fig. 7b) coincides with the structure of Supplementary Fig. S4 and is composed of an eightfold scaled down version of the large geometry. The larger wire medium is less lossy because of a lower field density within the wire modes, resulting in lower absorption. The larger structure thus possesses a loss that is comparable to that of the host material. A complete calculation of the loss of the taper as a function of propagation distance will require further analysis. Here we simply note that the total (integrated) measured losses, as plotted in Fig. 7b, are indeed within the upper and lower bounds of our expectations.
Author contributions
A.T., B.T.K., A.A. and S.C.F. designed the fibre. A.T. fabricated the fibre. A.T. and K.J.K. prepared the samples. M.W., B.M.F. and K.J.K. developed the terahertz near-field microscope. A.T. and K.J.K. performed the terahertz measurements. A.T. performed the simulations. A.T., B.T.K. and A.A. performed the data analysis and wrote the manuscript, with contributions from all authors.
Additional Information
How to cite this article: Tuniz, A. et al. Metamaterial fibres for subdiffraction imaging and focusing at terahertz frequencies over optically long distances. Nat. Commun. 4:2706 doi: 10.1038/ncomms3706 (2013).
Supplementary Material
Supplementary Figures S1-S5 and Supplementary Reference
Rotating animation of the X-ray computed tomography (9:5 m pixel size) of the tapered indium wires, clearly showing the wires are continuous. The larger side is 8 mm in diameter, the smaller side is 1 mm in diameter.
X-ray computed tomography animation of the cross-section of the tapered indium wires, demonstrating the uniform scaling of the wire diameters along the taper. The taper is 38 mm in length.
Acknowledgments
We thank Richard Lwin for providing assistance in fibre fabrication and Pavel Belov for useful discussions. This research was supported by the Australian Research Council under the Discovery Project scheme number DP120103942. B.K. and A.A. acknowledge the support from an Australian Research Council Future Fellowship and Australian Research Fellowship, respectively. This work was performed in part at the Optofab node of the Australian National Fabrication Facility (ANFF) using Commonwealth and NSW State Government funding. We acknowledge the scientific and technical assistance of Matthew Foley for the computed tomography images obtained through the Australian Microscopy & Microanalysis Research Facility located at the Australian Centre for Microscopy & Microanalysis, The University of Sydney.
References
- Smith D. R. & Schurig D. Electromagnetic wave propagation in media with indefinite permittivity and permeability tensors. Phys. Rev. Lett. 90, 077405 (2003). [DOI] [PubMed] [Google Scholar]
- Mackay T. G., Lakhtakia A. & Depine R. A. Uniaxial dielectric media with hyperbolic dispersion relations. Microw. Opt. Techn. Lett. 48, 363–367 (2006). [Google Scholar]
- Jacob Z., Alekseyev L. V. & Narimanov E. Optical hyperlens: Far-field imaging beyond the diffraction limit. Opt. Express. 14, 8247–8256 (2006). [DOI] [PubMed] [Google Scholar]
- Liu Z., Lee H., Xiong Y., Sun C. & Zhang X. Far-field optical hyperlens magnifying sub-diffraction-limited objects. Science 315, 1686–1686 (2007). [DOI] [PubMed] [Google Scholar]
- Belov P. A. et al. Transmission of images with subwavelength resolution to distances of several wavelengths in the microwave range. Phys. Rev. B 77, 193108 (2008). [Google Scholar]
- Belov P. A. et al. Experimental demonstration of multiwire endoscopes capable of manipulating near-fields with subwavelength resolution. Appl. Phys. Lett. 97, 191905 (2010). [Google Scholar]
- Shvets G., Trendafilov S., Pendry J. B. & Sarychev A. Guiding, focusing, and sensing on the subwavelength scale using metallic wire arrays. Phys. Rev. Lett. 99, 53903 (2007). [DOI] [PubMed] [Google Scholar]
- Casse B. D. F. et al. Super-resolution imaging using a three-dimensional metamaterials nanolens. Appl. Phys. Lett. 96, 023114 (2010). [Google Scholar]
- Belov P. A. et al. Strong spatial dispersion in wire media in the very large wavelength limit. Phys. Rev. B 67, 113103 (2003). [Google Scholar]
- Belov P. A., Simovski C. R. & Ikonen P. Canalization of subwavelength images by electromagnetic crystals. Phys. Rev. B 71, 193105 (2005). [Google Scholar]
- Yang X., Yao J., Rho J., Yin X. & Zhang X. Experimental realization of three-dimensional indefinite cavities at the nanoscale with anomalous scaling laws. Nat. Photonics 6, 450–454 (2012). [Google Scholar]
- Belov P. A. & Silveirinha M. G. Resolution of subwavelength transmission devices formed by a wire medium. Phys. Rev. E 73, 056607 (2006). [DOI] [PubMed] [Google Scholar]
- Abouraddy A. F. et al. Towards multimaterial multifunctional fibres that see, hear, sense and communicate. Nat. Materials 6, 336–347 (2007). [DOI] [PubMed] [Google Scholar]
- Tuniz A. et al. Drawn metamaterials with plasmonic response at terahertz frequencies. Appl. Phys. Lett. 96, 191101 (2010). [Google Scholar]
- Tuniz A., Lwin R., Argyros A., Fleming S. C. & Kuhlmey B. T. Fabricating metamaterials using the fiber drawing method. J. Vis. Exp. 68, e4299 doi:10.3791/4299 (2012). [DOI] [PMC free article] [PubMed] [Google Scholar]
- Powell D. A. The sub-wavelength imaging performance of disordered wire media. Phys. Lett. A 372, 3919–3921 (2008). [Google Scholar]
- Capolino F. Metamaterials Handbook Vol. 2, Applications of Metamaterials 3–17CRC Press (2009). [Google Scholar]
- Bitzer A. & Walther M. Terahertz near-field imaging of metallic subwavelength holes and hole arrays. Appl. Phys. Lett. 92, 231101 (2008). [Google Scholar]
- Silveirinha M. G., Belov P. A. & Simovski C. R. Ultimate limit of resolution of subwavelength imaging devices formed by metallic rods. Opt. Lett. 33, 1726–1728 (2008). [DOI] [PubMed] [Google Scholar]
- Zhan H., Mendis R. & Mittleman D. M. Superfocusing terahertz waves below λ/250 using plasmonic parallel-plate waveguides. Opt. Express 18, 9643–9650 (2010). [DOI] [PubMed] [Google Scholar]
- Schnell M. et al. Nanofocusing of mid-infrared energy with tapered transmission lines. Nat. Photon. 5, 283–287 (2011). [Google Scholar]
- Jacob Z. et al. Engineering photonic density of states using metamaterials. Appl. Phys. B 100, 215–218 (2010). [Google Scholar]
- Lemoult F., Lerosey G., De Rosny J. & Fink M. Resonant metalenses for breaking the diffraction barrier. Phys. Rev. Lett. 104, 203901 (2010). [DOI] [PubMed] [Google Scholar]
- Lemoult F., Fink M. & Lerosey G. A polychromatic approach to far-field superlensing at visible wavelengths. Nat. Commun. 3, 889 (2012). [DOI] [PMC free article] [PubMed] [Google Scholar]
- Eggers J. & Villermaux E. Physics of liquid jets. Rep. Prog. Phys. 71, 036601 (2008). [Google Scholar]
- Badinter E., Ioisher A., Monaico E., Postolache V. & Tiginyanu I. M. Exceptional integration of metal or semimetal nanowires in human-hair-like glass fiber. Mat. Lett. 64, 1902–1904 (2010). [Google Scholar]
- Schmidt M. A., Prill Sempere L. N., Tyiagi H. K., Poulton C. G. & Russell P. St. J. Waveguiding and plasmon resonances in two-dimensional photonic lattices of gold and silver nanowires. Phys. Rev. B 77, 033417 (2008). [Google Scholar]
- Oppenheim A. V. & Schafer R. W. Discrete-Time Signal Processing Prentice Hall (1989). [Google Scholar]
- Anthony J., Leonhardt R., Argyros A. & Large M. C. J. Characterization of a microstructured Zeonex terahertz fiber. J. Opt. Soc. Am. B 28, 1013–1018 (2011). [Google Scholar]
- Jin Y. S., Kim G. J. & Jeon S. G. Terahertz dielectric properties of polymers. J. Korean Phys. Soc. 49, 513–517 (2006). [Google Scholar]
- Koyama R. Y., Smith N. V. & Spicer W. E. Optical properties of indium. Phys. Rev. B 8, 2426–2432 (1973). [Google Scholar]
Associated Data
This section collects any data citations, data availability statements, or supplementary materials included in this article.
Supplementary Materials
Supplementary Figures S1-S5 and Supplementary Reference
Rotating animation of the X-ray computed tomography (9:5 m pixel size) of the tapered indium wires, clearly showing the wires are continuous. The larger side is 8 mm in diameter, the smaller side is 1 mm in diameter.
X-ray computed tomography animation of the cross-section of the tapered indium wires, demonstrating the uniform scaling of the wire diameters along the taper. The taper is 38 mm in length.


